Impact Factor
- Issue 14; 2026
- Issue 13; 2026
- Issue 12; 2026
- Issue 11; 2026
- Issue 10; 2026
- Volume 16; 2026
- Advance Articles
- Past Issues
- Cover Images
- Cover Suggestion
- Index & Coverage
- Special Issues
Introduction
Materials and Methods
Results
Discussion
Conclusion
Abbreviations
Supplementary Material
Acknowledgements
References
International Journal of Biological Sciences
International Journal of Medical Sciences
 Global reach, higher impact

Theranostics 2025; 15(14):6615-6627. doi:10.7150/thno.117250 This issue Cite
Research Paper
Direct delivery of MRI contrast through skull vessel/marrow pathways into the brain guided by microCT
Li Liu1, ![]() , Martin J. MacKinnon1, Tatjana Atanasijevic1, Stephen Dodd1, Nadia Bouraoud1, Danielle Donahue2, Harikrishna Rallapalli1, Alan P. Koretsky1,
, Martin J. MacKinnon1, Tatjana Atanasijevic1, Stephen Dodd1, Nadia Bouraoud1, Danielle Donahue2, Harikrishna Rallapalli1, Alan P. Koretsky1, ![]()
1. Section on Plasticity and Imaging of the Nervous System, Laboratory of Functional and Molecular Imaging, National Institute of Neurological Disorders and Stroke, National Institutes of Health, Bethesda, MD 20892, USA.
2. Mouse Imaging Facility, National Institute of Neurological Disorders and Stroke, National Institutes of Health, Bethesda, MD 20892, USA.
Received 2025-5-9; Accepted 2025-5-31; Published 2025-6-9
Abstract

Rationale: The brain remains a challenging organ for drug delivery. Earlier studies demonstrated that transcranial application of small molecular therapeutics and MRI contrast such as manganese ion (Mn2+) could serve as a new method for delivering molecules to the brain. In this earlier work using rats, manganese-enhanced MRI (MEMRI) demonstrated that Mn2+ passed most effectively through regions of the skull containing suture lines or dense vessel/marrow. In the present study, the delivery of Mn2+ to the brain using specific skull vessel/marrow pathways has been investigated.
Methods: In-vivo microCT scans of rat skull was conducted to study the intricate geometry of vessel/marrow pathways connecting the outer skull surface and meninges. Specific vessel/marrow paths were identified. MnCl2 (500 mM) solution was pipetted directly on the skull bone surface above the target path. After 2 hr, rats were subjected to MRI.
Results: High-resolution microCT images reveal that (a) there are "short paths" through the skull which have vessels on the outer surface of the skull, which directly pass through the vessel/marrow and then reach the meninges on the other side of the skull; (b) the skull above the cerebellum (interparietal bone) exhibits a significantly higher density of vessel/marrow compared to the frontal and parietal bone enabling testing whether direct application to skull enables transcranial movement and (c) thinning the skull in specific regions can lead to exposing vessel pathways from mid-skull to the meninges. Guided by microCT imaging, Mn2+ delivery to the brain could be accomplished as assayed with MEMRI through these different specific pathways. Two hours post pipetting MnCl2 solution onto the top of a short path through the intact skull, Mn2+ could be delivered readily to levels that produce detectable brain tissue enhancement by MEMRI. A T1 enhanced volume of 2.27 ± 1.47 mm3 was measured through the short path. Two hours post applying a MnCl2 solution to the intact skull above the cerebellum enabled MEMRI detection of a volume of enhanced brain tissue of 2.48 ± 2.66 mm3. Finally, in areas where surface short paths are absent but a path from mid skull to meninges is present, minimal thinning of the skull led to effective Mn2+ delivery, enabling MEMRI detection of volume of 4.68 ± 2.70 mm3.
Conclusions: MicroCT-guided transcranial delivery via vessel/marrow pathways may offer a less invasive and more localized method for administering imaging probes and therapeutics to the brain.
Keywords: direct/transcranial brain drug delivery, skull vessel/marrow pathways, high resolution microCT, manganese-enhanced MRI, manganese ion (Mn2+)
Introduction
Previous studies showed that transcranial application can be a new brain delivery method for small molecular imaging agents and therapeutics, such as manganese ions (Mn2+), fluorescent molecules, dextrans, glutathione, and several purinergic receptor inhibitors [1, 2]. The efficiency of transcranial delivery through the intact rat skull could be detected by MRI using skull application of MnCl2, to enable imaging small molecules penetration of the skull [1, 2]. As detected by manganese-enhanced MRI (MEMRI) [3], Mn2+ was found to pass most efficiently through areas of the skull that contain suture lines such as bregma and lambda, compared with normal skull bone [2]. It also passed through areas that had a high density of vessel and marrow in the skull.
There has been a renaissance in interest in the connections between skull and brain. The skull contains a complicated network of vessels and marrow. There has been work that demonstrates that immune cells can leave the skull marrow and enter directly into brain circulation [4-7]. Furthermore, there has been interest in bacteria and tumor cells infiltrating the brain via vessel/marrow pathways through the skull [8, 9]. Recently, it was reported that skull marrow and brain meninges are connected and regulated by vessels that bridge the skull and meninges. The perivascular space cerebrospinal fluid (CSF) can pass directly between skull marrow and the subarachnoid space via these skull-dura channels [6, 10, 11]. These reports lend support to the previous work showing that small molecules and MRI contrast agents such as Mn2+ can pass through the skull, traverse the meninges and get into the brain and that MEMRI provides a good tool to study passage through skull vessel/marrow pathways [1, 2], although the mechanism whereby Mn2+ penetrates the meninges into brain is still unclear.
Recently, transcranial delivery methods are being tested to administer small-molecule psychiatric, neuroprotective, anti-cancer agents, and stroke therapies using preclinical mouse and rat models [12-14]. In the delivery study using a mouse model, the concentration of small molecule drugs in the brain achieved through transcranial or “intraosseous” delivery was significantly higher than that obtained through intravenous administration — 115 times higher for risperidone and 294 times higher for paclitaxel. In these studies, skull bone was thinned to deliver drugs without regard to the vessel/marrow structure.
The aim of the present study was to determine if transcranial delivery through specific vessel/marrow pathways could be used at a variety of skull bone locations without regard to the overall density of vessel/marrow in the bone which limited earlier work [1, 2]. This would enable MRI contrast and small therapeutics to be delivered to more specific locations in the brain. To identify specific vessel marrow pathways, high resolution micro computed tomography (microCT) was used to identify different useful geometries for delivering Mn2+ to the brain. MnCl2 was applied in an appropriate manner depending on the specific geometry used. MEMRI was used to monitor the delivery efficiency of Mn2+ in the brain tissue in terms of the amount of tissue that accumulated Mn2+ to get MEMRI contrast. Three different geometries were used. The first geometry was to take advantage of short, direct paths where a vessel enters the skull, enters the mid marrow/vessel region and a vessel continues directly through the skull and enters the meninges. Placing MnCl2 directly on top of the short path on the outer skull led to efficient development of MEMRI contrast. The second geometry was the skull above the cerebellum which contains a high density of vessel/marrow that connect to the meninges. Mn2+ can pass through the intact skull above the cerebellum simply by placing solution on the surface. Finally, and most invasively, microCT was used to find a path from mid skull over a vessel that passed directly to the meninges. CT-guided thinning of skull to about middle of the skull directly on top of the vessels that enters the meninges also led to increased MEMRI enhancement. In conclusion the specific geometry of vessel/marrow paths in the skull can be used to deliver Mn2+ through skull to brain tissues. The mechanism whereby Mn2+ penetrates the meninges is not clear, however, this work demonstrates that the specific vascular/marrow structure of the skull can be used as a brain delivery route.
Materials and Methods
Animal preparation
In this study, adult male Sprague-Dawley rats (age 7-10 weeks, body weights 200-300 g, n = 48 total), purchased from Harlan Laboratories, were used. There is no evidence that any of the results presented would be different in females so only males were used. All rats were handled in accordance with the Institute for Laboratory Animal Research guidelines and study procedures were approved by the Animal Care and Use Committee of the National Institute of Neurological Disorders and Stroke. A micro-CT scan (see below for details) was first obtained to identify the target vessel/marrow region. The rats were placed in an induction box and anesthetized with 3-5% isoflurane before being moved to a stereotaxic apparatus. After the rats were positioned in a stereotaxic apparatus, isoflurane was administered through a nose cone and adjusted between 1-3% as required, depending on the monitored respiratory rate of the animals. A single incision with a sterile scalpel was made through the skin of the skull at the target location. The skull bone was exposed by scraping away the periosteum. Sterile saline (0.9% NaCl) solutions of MnCl2 (500 mM, Sigma-Aldrich), were pipetted directly on the skull bone in 5 µL aliquots. Only saline was used in controls. The solutions were pipetted on the rat skull over a 2 hr period in 5 μL aliquots and replenished as needed. The total volume of applied MnCl2 solutions did not exceed 25 μL. After 2 hr, skin was sutured, and rats were subjected to MRI (see below for details). After MRI scan, rats were euthanized.
MicroCT acquisition and analysis
In-vivo microCT scans of rats were conducted on a Bruker Skyscan 1176 micro-CT (Bruker microCT, Kontich, Belgium). Rats were anesthetized as described above. Scans were performed utilizing a 1 mm aluminum filter, with the X-ray source biased at 90 kV and 278 uA, and projections taken over 197 degrees at 1 of 2 scan settings. Most scans were performed using a binning factor of 1, with an 8.74 μm image pixel size (reconstructed into a final isotropic voxel size of 8.74 μm), obtaining projections every 0.3o, with 3 averages, each exposed at 1500 ms. Additional scans were performed using a binning factor of 2, with a 17.49 μm pixel size (reconstructed to an isotropic voxel size of 17.49 μm), obtaining projections ever 0.5o, with 3 averages, each exposed for 325 ms. Acquired data was reconstructed using NRecon (Bruker microCT, Kontich, Belguim), applying a nominal ring artifact reduction and beam hardening correction, as well as a dynamic contrast range, all optimized per scan to ideally distinguish the boundary between bone and soft tissue. Reconstructed images were rotated in DataViewer (Bruker microCT, Kontich, Belguim) along all 3 planes to mimic their orientation in the stereotaxic apparatus that would be used for Mn2+ delivery. Slices were reviewed to identify the approach for Mn2+ delivery and coordinates from the bregma or lambda to the desired location were recorded.
Ex-vivo high-resolution scans of rat skulls were conducted with a Skyscan1172 micro-CT (Bruker microCT, Kontich, Belgium). Scans were performed utilizing a 0.5 mm aluminum filter, with X-ray source biased at 65 kV and 153 uA. The image pixel size was 6.87 μm (reconstructed to an isotropic voxel size of 6.87 μm), obtaining projections ever 0.4o, with 3 averages, each exposed for 295 ms. Acquired data was reconstructed using NRecon as described above. The quantification of volume ratio of channel (total of skull surface to brain and brain to skull) to bone and marrow to bone was carried out by using ImageJ (https://imagej.net/ij/). Regions of interest (ROIs) were drawn manually.
Ex-vivo high-resolution scans of human skull was conducted with a Skyscan1176 micro-CT (Bruker microCT, Kontich, Belgium). Scans were performed utilizing a 0.1 mm copper filter, with X-ray source biased at 90 kV and 270 uA. The image pixel size was 36.13 μm (reconstructed to an isotropic voxel size of 36.13 μm), obtaining projections ever 0.7o, with 4 averages, each exposed for 23 ms. Acquired data was reconstructed using NRecon as described above.
MRI acquisition
MRI experiments were performed on an 11.7 T animal MRI system (11.7 T/30 cm horizontal magnet, Magnex Scientific; MRI Electronics, Bruker Biospin) with a 12 cm integrated gradient shim system (Resonance Research Inc) using a 9 cm custom-built birdcage coil for signal transmission and a 2 cm custom-built surface coil placed on the rat head for signal reception. Rats were imaged 2 hr post MnCl2 application. Whole-brain T1-weighted spin echo pulse sequences were used for acquisitions. The following parameters were used: TR/TE = 500/7.6 ms, receiver bandwidth = 100 kHz, field of view (FOV) = 19.2 x 28.8 mm, matrix size = 192 x 288, number of slices = 30, slice thickness = 1mm, averages = 8. A subset of animals that received delivery of Mn2+ via the cerebellum and a thinned skull underwent partial-brain imaging. One animal in the cerebellum group was imaged with: TR/TE = 4000/8.9 ms, receiver bandwidth = 50 kHz, (FOV) = 30 x 30 mm, matrix size = 300 x 300, number of slices = 17, slice thickness = 0.6 mm, averages = 2. Two animals in the cerebellum group were imaged with: TR/TE = 800/6 ms, receiver bandwidth = 81.5 kHz, FOV = 30 x 30 mm, matrix size = 256 x 256, number of slices = 14, slice thickness = 0.6 mm, averages = 8. One animal in the thinned skull group was imaged with: TR/TE = 800/6.5 ms, receiver bandwidth = 75 kHz, field of view = 30 x 30 mm, matrix size = 300 x 300, number of slices = 14, slice thickness = 0.6 mm, RARE Factor = 2, averages = 2.
MRI quantification
Preprocessing
MRI images were skull stripped with hand drawn brain masks using ITK-SNAP [15] before undergoing N4 bias field correction using the SimpleITK toolbox [16] to compensate for intensity non-uniformity. The Sigma Ex-Vivo Rat Brain template [17] was registered to each individual subject's image with Advanced Normalization Tools (ANT) [18]. The template was aligned to the images with rigid-body, then affine, followed by non-linear SyN transformations using the ANTsRegistration function. To register the template to partial brain images, the template was cropped to match the anatomical coverage of the corresponding image using the tentorium cerebelli as a reference point. The Sigma Ex-Vivo Rat Brain Atlas was then warped into the individual subject space using the corresponding transformation parameters.
Analysis
To detect Mn2+-induced T1-shortening, we used a z-score threshold to detect high signal intensity voxels. Using the warped atlas, each subject's gray matter voxels were segmented. The z-score was calculated on a voxel-by-voxel basis by subtracting the mean signal intensity of the gray matter from each voxel, divided the standard deviation of the gray matter signal intensity. The calculation of z-score was restricted to gray matter voxels as signal intensity enhancements were not evident in the white matter. To identify high signal intensity voxels, a conservative z-score threshold of 2.58 was applied, corresponding to the top 0.5% of gray-matter signal intensities. Clustering was performed with the DBCAN algorithm to reduce the influence of noise and identify areas where Mn2+ penetrated. The DBSCAN algorithm assigns labels to a cluster based on a specified epsilon, which describes the maximum distance between points in a cluster and a minimum cluster size. Firstly, the distance of every suprathreshold voxel to its nearest neighbor was calculated. The optimal epsilon for the DBSCAN algorithm, was set as the 90th percentile of the nearest neighbor distances. The minimum number of points in a cluster was set as the nearest integer value to epsilon. To avoid the influence of outliers, the median z-score within each subject's Mn2+-enhanced voxels was calculated. The 90th percentile was calculated to capture the upper range of intensities, where Mn2+ delivery was most effective. The enhanced volume was calculated as the number of suprathreshold, Mn2+-enhanced, voxels multiplied by the individual voxel volume.
Skull and femur bone histology
After rats were perfused with 5% formalin in PBS, their skull and femur bones were isolated. Bones were decalcified in EDTA (0.5 M, pH 8.0) for 10 days and cut into 5 µm section. H and E staining was conducted by Histoserv Inc. Light microscopic images were captured using a Nikon Eclipse Ti microscope.
Statistical analysis
Statistical analysis was carried out with the one-way analysis of variance (ANOVA) with Tukey's multiple-comparisons test or unpaired t test. All statistical analyses were performed using GraphPad Prism 10.2.3.
Results
Animal number. A total of 48 rats were used in this study, and Table S1 provides a summary of the number of animals used in each experiment. Briefly, 6 rats were used in Figure 1 for microCT study of skull and to quantify the volume ratios of channel to bone and marrow to bone. 6 rats were used in Figure 2 for H and E staining of rat skull bone. 9 rats were used in Figure 4 for Mn2+ delivery through “short paths” (n = 5 for Mn2+ delivery, n = 4 for saline control). 10 rats were used in Figure 5 for Mn2+ delivery above cerebellum (n = 6 for Mn2+ delivery, n = 4 for saline control). 12 rats were used in Figure 6 for Mn2+ delivery through minimum thinning of the skull (n = 6 for Mn2+ delivery, n = 6 for saline control). 1 rat was used in Supplementary Video 1 for reconstructed 3D microCT image of skull. 3 rats were used in Figure S1 for microCT of bottom skull. 1 rat was used in Figure S2 for H and E staining of femur bone marrow.
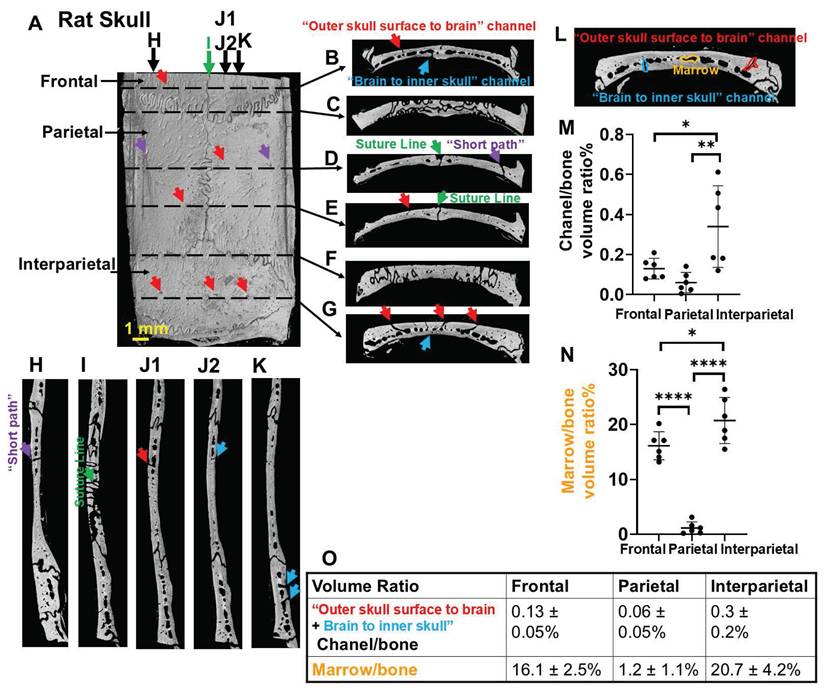
High-resolution microCT of a rat top skull showing an intricate geometry of vessel/marrow paths connecting the outer skull surface and meninges. (A) Outer skull surface. (B-G) Representative coronal views of the skull bone. (H-K) Representative sagittal views of the skull bone. (J1, J2) are two continuous images to show surface vessel/marrow reach the meninges. Red arrows, pores on the outer skull surface (A) indicating the “outer skull surface to brain” vessel/marrow pathways that get to the inner skull. Purple arrows, short paths that connect a vessel on the outer skull surface that connects to the mid skull vessel/marrow area with a vessel that connects to the meninges (D, H). Blue arrows, “brain to inner skull” vessel/marrow pathways. (L-O) Quantification of volume ratio of channel (total of skull surface to brain and brain to skull) to bone and marrow to bone. n = 6 rats. Results are expressed as mean ± SD. *, p < 0.05; **, p < 0.005; ****, p < 0.0001.
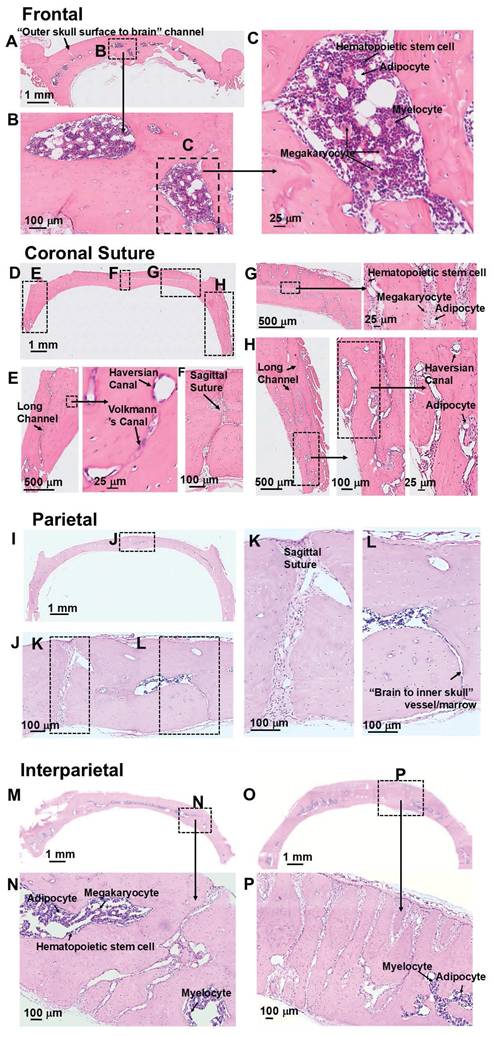
H and E staining of rat skull bone. (A-C) Frontal bone. (D-H) Coronal suture. (I-L) Parietal bone. (M-P) Interparietal bone.
Mn2+ can be delivered efficiently through “short paths”. (A) Representative coronal view of in-vivo microCT image of a short path: a surface vessel that goes directly through mid-skull and then a vessel that gets directly into the meninges. (B) T1-weighted MRI of this brain area 2-hr post Mn2+ application. (C) Saline control (n = 4 subjects). (D) The average median and 90th percentile of the z-score of the enhanced area was 4.12 ± 0.83 and 8.27 ± 3.62, respectively. Dashed lines connect values from the same subject. (E) T1 enhanced volume is 2.27 ± 1.47 mm3. Data are presented as mean ± SD, n = 5 subjects.

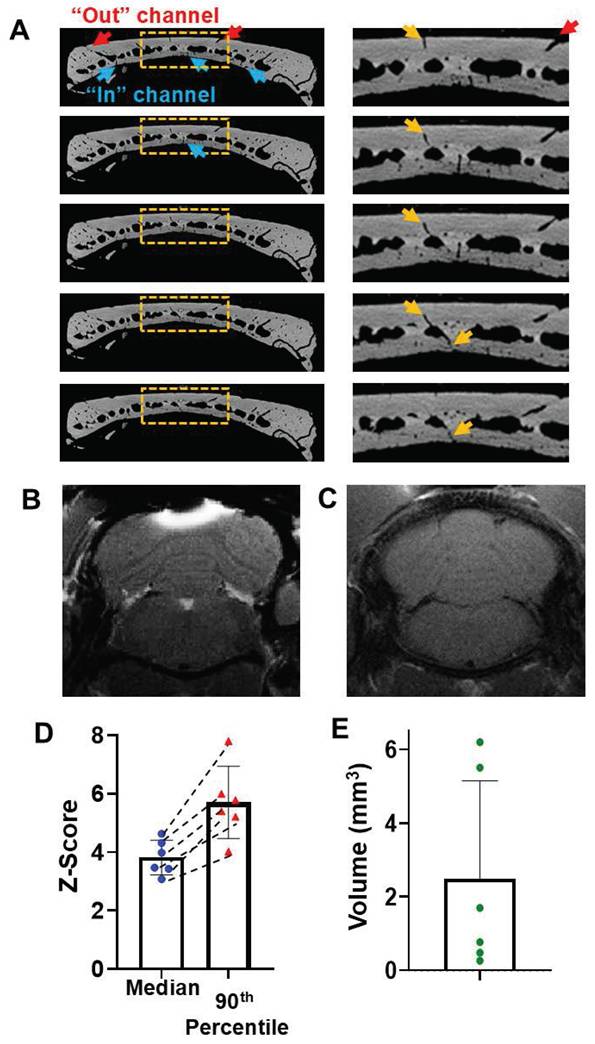
Mn2+ can be delivered efficiently through intact skull above the cerebellum. (A) Representative coronal views of 5 contiguous ex-vivo microCT slices, showing the vessel/marrow pathways connecting from the surface of outer skull to the mid-skull to meninges. (B) Representative views of T1-weighted MRI of cerebellum 2-hr post Mn2+ application. (C) Saline control (n = 4 subjects). (D) The average median and 90th percentile of z-score of the enhanced area was 3.82 ± 0.59 and 5.70 ± 1.24, respectively. Dashed lines connect values from the same subject. (E) T1 enhanced volume is 2.48 ± 2.66 mm3. Data are presented as mean ± SD, n = 6 subjects.
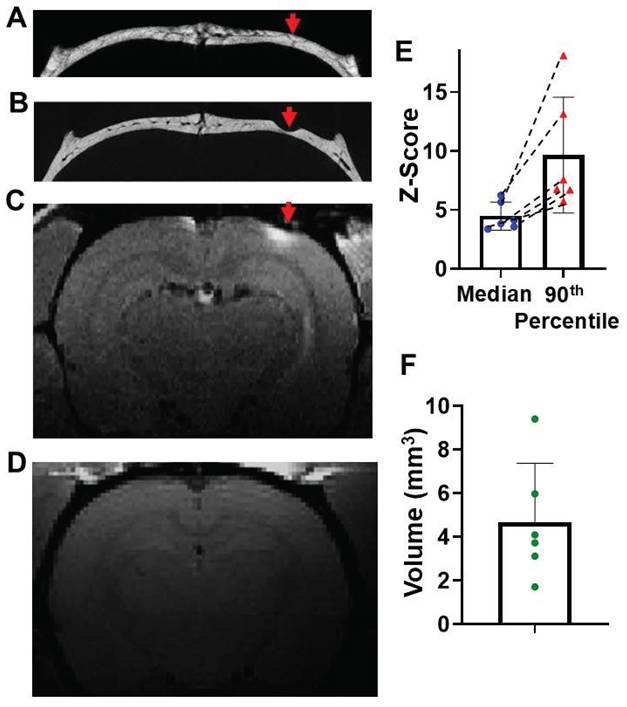
Minimum thinning skull on the top of “brain to skull” vessel/marrow pathways can increase the delivery efficiency. (A) Representative in-vivo microCT image to identify a “brain to inner skull” vessel/marrow path. (B) After thinning the skull at this vessel location, Mn2+ was applied. T1-weighted MRI of this brain area 2-hr post Mn2+ application. (C) Post MRI, rat was subject to another microCT scan to confirm the skull was thinned, but still intact. (D) Saline control (n = 6 subjects). (E) The average median and 90th percentile of z-score of the enhanced area was 4.8 ± 1.20 and 9.67 ± 4.91, respectively. Dashed lines connect values from the same subject. (F) T1 enhanced volume is 4.68 ± 2.70 mm3. Data are presented as mean ± SD, n = 6 subjects.
An intricate geometry of vessel/marrow paths connects the outer skull surface and meninges
We used a rat model instead of a mouse model because, compared to the thinner mouse skull (0.1-0.3 mm), the rat skull (1-2 mm) more closely resembles the human skull (2-6 mm) and poses greater challenges for transcranial delivery. The skull is bright in microCT due to bone's high X-ray attenuation/radio-density (Figure 1). Vessels and marrow have poor X-ray attenuation, appearing dark and indistinguishable. At the suture lines there is a large space that traverses the top of the skull to the meninges that harbors large vessels (Figure 1D,E,I, green arrows). The normal skull bone also has an intricate pattern of many vessel/marrow paths connecting between the outer skull surface and meninges, as shown by high-resolution CT. Many pores can be observed from the outer skull surface (Figure 1A, red and purple arrows). If a path leaves the skull for the skin or leaves the skull for the meninges it was assumed to be a blood vessel. Thus, these pores indicate the vessels that go from skull to skin as well as connect deeper into vessel/marrow paths in the inner skull as shown in the coronal views and sagittal views (Figure 1B-L, red and purple arrows). Interestingly, there are "short pathways" in the skull that contain vessels on its outer surface, which travel directly through the vessel/marrow and connect to the meninges on the opposite side (Figure 1D,H, purple arrows). There are also many vessels from the inner skull that traverse into the meninges (Figure 1B-L, blue arrows). Figure 1 J1-J2 are two continuous images to show a surface vessel that goes fairly directly through mid-skull and then a vessel that gets directly into the meninges. The reconstructed 3D image to show the intricate geometry of vessel/marrow paths was shown in Supplementary Video 1 or Figshare (https://figshare.com/s/e506d8567974069184a9). The microCT cannot distinguish vessels from marrow so whether these direct pathways represent a single vessel or another vessel that comes from the mid region of skull that contains both marrow and vessels is not certain.
The skull above the cerebellum (interparietal bone) shows a significantly higher density of channels and vessel/marrow paths, compared with frontal and parietal bone (Figure 1L-O). The interparietal bone had 0.3 ± 0.2% volume fraction of vessels that leave the skull either to skin or to meninges. The volume fraction of mid skull marrow/vessels was 20.7 ± 4.2%. The frontal bone had a high density of mid skull marrow/vessels (16.1 ± 2.5%), but relatively lower density of vessels that leave the skull (0.13 ± 0.05%). The parietal bone had the lowest density of vessels that leave the skull (0.06 ± 0.05%) and mid skull marrow/vessels (1.2 ± 1.1%). From the microCT scan, it was also observed that the bottom skull contained a high density of vessel/marrow (Figure S1). While not demonstrated in this study it is likely that the bottom skull below the olfactory bulb and forebrain might provide other locations for transcranial delivery through the nose and mouth to the brain due to the high density of vessel/marrow.
H and E staining also showed the intricate geometries of skull marrow/vessel pathways (Figures 2 and S2). Consistent with the microCT results, frontal bone showed high density of marrow, but low density of vessels that leave the skulls (Figure 2A-C). Coronal suture showed high density of vessels that leave the skull (Figure 2D-H). Parietal bone showed low density of marrow cells and vessels that leave the skull. (Figure 2I-L). A representative view of a “brain to inner skull” vessel/marrow is shown in Figure 2L. Interparietal bone showed the highest density of marrow cells and vessels, with many channels connecting skull surface and brain surface (Figure 2M-P). More views of “outer skull surface to brain” vessel/marrow and “brain to inner skull” vessel/merrow at different locations of skull bones are shown in Figure S2 A-H. H and E staining of a femur bone is shown in Figure S2 I-K. In the bone marrow cells, hematopoietic stem cells, megakaryocytes, myelocytes, and adipocytes were observed. In the bone, Haversian canal and Volkmann's canal were observed.
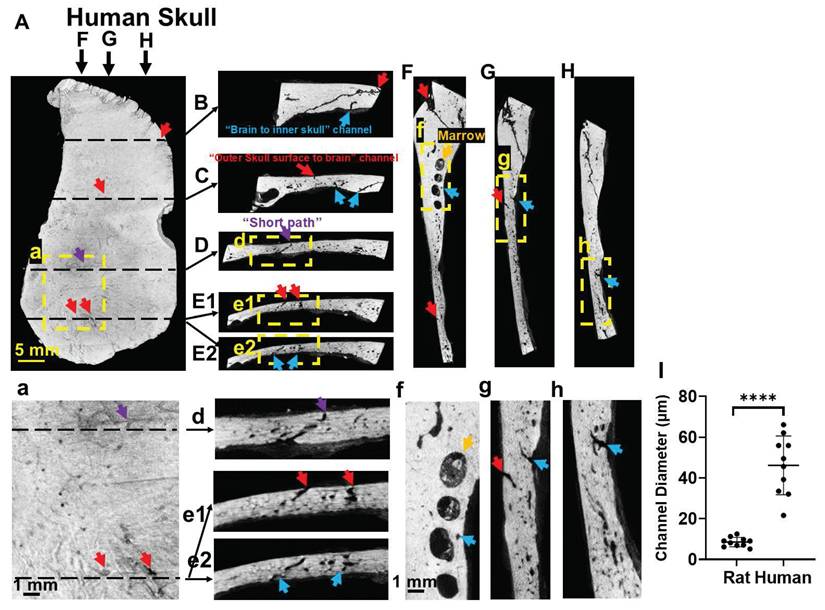
Human skull also shows many vessel/marrow paths connecting between the outer skull surface and meninges (Figure 3). as detected with microCT images of a piece of human skull. Figure 3E1-E2, e1-e2 are two continuous images to show two surface vessels that pass through mid-brain and connect to a vessel that gets into the meninges. There are also “short paths” in the human skull that directly connect outer skull surface with meninges (Figure 3D,d). The diameters of surface vessels (not including suture line areas) of human skull were 3-5 times larger than that of rat skull, measuring 46.15 ± 14.39 µm in human and 8.15 ± 2.84 µm in rat (Figure 3I).
Human skull also shows vessel/marrow pathways connecting outer skull surface and meninges, as reviewed by high-resolution CT. (A) Outer skull surface. (B-E) Representative coronal views of the skull bone. (F-H) Representative sagittal views of the skull bone. (a, d-h) are enlarged views from the framed locations in (A, D-H). (E1, E2) are two contiguous slices to show a surface vessel that goes directly through mid-skull and then a vessel that gets directly into the meninges. (I) Quantification of the diameters of skull channels (not including suture line areas) of human skull and rat skull. Red arrows, pores on the outer skull surface (A) indicating the “outer skull surface to brain” channels that get to the inner skull. Purple arrows, “short paths” from the skull surface that reach brain meninges (D). Blue arrows, “brain to inner skull” channels. Results are expressed as mean ± SD. ****, p < 0.0001.
Mn2+ can be directly delivered through “short paths”
MicroCT images show that there are skull “short paths” that connect a vessel on the outer skull surface, through the mid skull vessel/marrow area, and directly to a vessel that connects to the meninges (Figure 1D,H, 4A). MnCl2 solution was pipetted on the top of an opening of a short path of intact skull as identified by prior microCT scan. After 2 hr, Mn2+ can be detected in the brain tissue below the “short path” by MEMRI (Figure 4B). Saline control was shown in Figure 4C. The average median and 90th percentile of the z-score of the enhanced area was 4.12 ± 0.83 and 8.27 ± 3.62, respectively (Figure 4 D). T1 enhanced volume was quantified to be 2.27 ± 1.47 mm3 (Figure 4 E).
Mn2+ can efficiently pass through intact skull above the cerebellum
The efficiency of delivery of Mn2+ through the skull when solution was placed above the cerebellum was measured with MEMRI because microCT images showed that this bone areas contains the highest density of surface vessel/marrow paths (Figure 5A). Many surface pores go deeper into the skull and reach the meninges, as shown in the representative views of 5 contiguous slices in Figure 5A. 2-hr post MnCl2 solution application on the top of skull, Mn2+ can be delivered readily to levels that produce detectable tissue enhancement by MEMRI at cerebellum (Figure 5B). Saline control was shown in Figure 5C. The average median and 90th percentile of the z-score was 3.82 ± 0.59 and 5.70 ± 1.24, respectively (Figure 5D). T1 enhanced volume was quantified to be 2.48 ± 2.66 mm3 (Figure 5E). H and E staining to show the skull vessel/marrow pathways at the Figure 5B location was shown in Figure S3.
Minimum thinning of the skull, on the top of a vessel path to the meninges, enables delivery of Mn2+ to the brain
Finally, it was tested whether thinning the skull above where a vessel that enters the meninges in areas where there was no path on the upper part of the skull to the skin would enable getting Mn2+ into the brain. A vessel path to the meninges was identified from microCT images (Figure 6A) that did not have a vessel path from skull to skin. Skull was thinned to reach this vessel at about halfway through the skull making sure that the skull was still intact where it was thinned (Figure 6B). Through this minimally thinned skull, Mn2+ could be delivered efficiently and detected 2-hr post application (Figure 6C). Saline control was shown in Figure 6D. The average median and 90th percentile of z-score was 4.8 ± 1.20 and 9.67 ± 4.91, respectively (Figure 6E). T1 enhanced volume was quantified to be 4.68 ± 2.70 mm3 (Figure 6F). This thinning skull method was very effective and would be useful especially in areas where direct surface to meninges short paths through the skull are difficult to find.
Discussion
The brain remains a difficult organ for drug delivery due to the physiological and structural properties of the blood-brain barrier (BBB) and encasement in the skull. New administration routes, such as intranasal and intracranial administrations are gaining interest, but also face challenges [19-21]. Transcranial delivery through skull vessel/marrow pathways provides a much less invasive and more local administration route to deliver imaging probes and therapeutics to the brain. Transcranial delivery also bypasses the peripheral circulation and toxicity and increases the bioavailability for brain meninges. As an extension of earlier work [1, 2], this study focused on the brain delivery of Mn2+ via specific geometry of vessel/marrow pathways at various skull bone locations, without considering the overall vessel/marrow density in the bone.
There is an intricate geometry of vessel/marrow paths connecting the outer skull surface and meninges, as shown by microCT images (Figures 1 and 3). The meninges consist of epidural space, dura mater, subdural space, arachnoid mater, subarachnoid space [cerebrospinal fluid (CSF)-filled space], and pia mater [22]. The vessels in the meninges, especially at the dura mater, are fenestrated and contain less tight junctions compared with those in the brain parenchyma, making them a major point of entry into the meningeal space [23]. Acute lymphoblastic leukemia cells were found to migrate into the brain along vessels that pass directly between skull marrow and the subarachnoid space, but were unable to breach the BBB [8]. Immune cells were shown to go directly from the skull marrow via vessels into circulation in the brain [4-7]. Recently Kipnis et al have demonstrated that injected fluorescence agents can pass along vessels in perivascular spaces that traverse the arachnoid mater into the subarachnoid space [11]. Moreover, brain injuries and diseases can disrupt vascular integrity in the meninges, resulting in the leakage of materials, such as gadolinium-based MRI contrast agent, into the subarachnoid space. An MRI technique, known as hyperintense acute reperfusion marker (HARM), is a delayed enhancement of the subarachnoid space observed on post-contrast fluid-attenuated inversion recovery (FLAIR) images and is associated with permeability changes to the BBB caused by Stroke or TBI [24, 25]. MRI data also showed leak of contrast into the subarachnoid space in older, healthy people [11].
Here we show that these vessel/marrow pathways provide a pathway for MRI contrast agent into the meninges and then to the brain from outside the skull. After a simple application of MnCl2 on the outer skull surface, Mn2+ can be detected in the brain parenchyma by MEMRI, most efficiently at the high vessel/marrow density location, through “short paths”, or cerebellum (Figures 4 and 5). Many diseases are associated with cerebellum, such as medulloblastoma [26, 27] and cerebellar syndrome [28]. Transcranial delivery might be very useful for the delivery of imaging agents for disease mechanistic studies and therapeutics for managing the diseases associated with cerebellum, since the skull areas above the cerebellum showed the highest density of vessel/marrow pathways (Figure 1).
Direct “short paths” (Figure 1D,H) are also very efficient sites for transcranial delivery. MicroCT scan is required to identify these “short paths” for each rat, since the distributions of skull vessel/marrow pathways are unique for individual rat. “Short paths” might be seen on one microCT slice or continuous through several slices. In this study, MnCl2 solution was dripped on the surface pore of a “short path”. In future study, an injection catheter equipped with a pump and with ideal flexibility, going through this “short path”, shall improve the delivery efficiency significantly. The larger size of skull vessel/marrow pathways in humans (Figure 3) is expected to make this delivery pathway even more efficient and useful for human patients.
Mn2+ is an essential element and nutrient for the normal functioning of an organism [29, 30]. Mn2+shows paramagnetic properties and can enter excitable cells through voltage-gated calcium channels [31, 32] as well as through iron and zinc transporters. Recently dominant Mn2+ transporters have been described and shown to be expressed throughout brain and brain vessels [33]. Due to this rich biology of Mn2+, MEMRI has been used broadly in preclinical studies to image tissue structure, to study activity in brain, heart and pancreas and to perform neural tracing in the brain [34-39]. The application of MEMRI in preclinical animal models of CNS diseases has provided important information for the study of disease mechanisms [40, 41]. Thus, the full range of uses of MEMRI should be available with transcranial delivery. Indeed, an earlier study demonstrated that once in the brain parenchyma, Mn2+ introduced through transcranial delivery can be used for neuronal tract tracing [2].
It is not clear how Mn2+ got from the meninges into the brain parenchyma as clearly detected with MEMRI. It could be that Mn2+ (500 mM) are of high osmolarity which enabled Mn2+ to cross through the meninges into the brain. Alternatively, it could be that Mn2+ was able to cross through the dura mater and arachnoid mater through transport pathways into the subarachnoid space. It has been proposed that Mn2+ leaking through fenestrated surface vessels in the meninges can cross into the brain and this would imply transport through the dura and arachnoid cell layer [2]. Choroid plexus is known to transport Mn2+ from brain into CSF [42]. Finally, it could be that Mn2+ can follow vessels that have recently been shown to cross from the dura mater into the subarachnoid space and possibly into the brain [11].
Conclusion
Mn2+ can be delivered to the brain by simple application on the rat skull especially if care is taken to use the vessel/marrow structure in the brain to enhance deliver. Short vessel marrow pathways that go directly through the skull can be used to efficiently deliver Mn2+ but require CT to identify prior to application. We also demonstrated that another area with dense vessel marrow, the cerebellum, direct application to the skull is efficient for delivery in support of earlier studies. Finally with minimal skull thinning numerous vessels through the brain can be identified and used for delivery. Development of a thin flexible catheter capable of passing through the skull marrow/vessel paths would enable direct injection through the skull in almost any area without needing to thin the skull. Thus, there is much potential in using transcranial delivery of small molecules for therapeutic, basic biology, and delivery of imaging agents.
Abbreviations
ANT: Advanced Normalization Tools; BBB: the blood-brain barrier; CSF: cerebrospinal fluid; FLAIR: fluid-attenuated inversion recovery; FOV: field of view; HARM: hyperintense acute reperfusion marker; MEMRI: manganese-enhanced MRI; microCT: micro computed tomography; Mn2+: manganese ion.
Supplementary Material
Supplementary figures, table, and video legend.
Supplementary video.
Acknowledgements
This research was supported by the intramural program at the National Institute of Neurological Disorders and Stroke (NINDS), National Institutes of Health (NIH).
Author contributions
L.L. performed microCT and histology experiments, analyzed data, and wrote the manuscript with input from other authors. M.J.M. contributed imaging quantification. T.A. performed MRI and microCT experiments, and animal surgery. S.D. performed MRI experiments. N.B. performed animal surgery, MRI experiments, and microCT experiments. D.D. performed microCT experiments. H.R. analyzed microCT images and made 3D reconstruction. A.P.K. designed experiments, wrote the manuscript, and supervised the project.
Data availability statement
The data that support the findings of this study are openly available in figshare at https://figshare.com. The links of data of each Figure are:
Data of Figure 1: https://figshare.com/s/5fb97feeef60a24f36a0
Data of Figure 3: https://figshare.com/s/c8a42bf566d25bd3e719
Data of Figure 4: https://figshare.com/s/ed5759286245f9499ace
Data of Figure 5: https://figshare.com/s/8e8fa297fd8e93d59a9f
Data of Figure 6: https://figshare.com/s/b7076ed02275184a0f4c
Competing Interests
The authors have declared that no competing interest exists.
References
1. Roth TL, Nayak D, Atanasijevic T, Koretsky AP, Latour LL, McGavern DB. Transcranial amelioration of inflammation and cell death after brain injury. Nature. 2014;505:223-8
2. Atanasijevic T, Bouraoud N, McGavern DB, Koretsky AP. Transcranial manganese delivery for neuronal tract tracing using MEMRI. Neuroimage. 2017;156:146-54
3. Koretsky AP, Silva AC. Manganese-enhanced magnetic resonance imaging (MEMRI). NMR Biomed. 2004;17:527-31
4. Herisson F, Frodermann V, Courties G, Rohde D, Sun Y, Vandoorne K. et al. Direct vascular channels connect skull bone marrow and the brain surface enabling myeloid cell migration. Nat Neurosci. 2018;21:1209-17
5. Brioschi S, Wang WL, Peng V, Wang M, Shchukina I, Greenberg ZJ. et al. Heterogeneity of meningeal B cells reveals a lymphopoietic niche at the CNS borders. Science. 2021;373(6553):eabf9277
6. Mazzitelli JA, Pulous FE, Smyth LCD, Kaya Z, Rustenhoven J, Moskowitz MA. et al. Skull bone marrow channels as immune gateways to the central nervous system. Nat Neurosci. 2023;26:2052-62
7. Cugurra A, Mamuladze T, Rustenhoven J, Dykstra T, Beroshvili G, Greenberg ZJ. et al. Skull and vertebral bone marrow are myeloid cell reservoirs for the meninges and CNS parenchyma. Science. 2021;373(6553):eabf7844
8. Yao H, Price TT, Cantelli G, Ngo B, Warner MJ, Olivere L. et al. Leukaemia hijacks a neural mechanism to invade the central nervous system. Nature. 2018;560:55-60
9. Pulous FE, Cruz-Hernandez JC, Yang C, Kaya Z, Paccalet A, Wojtkiewicz G. et al. Cerebrospinal fluid can exit into the skull bone marrow and instruct cranial hematopoiesis in mice with bacterial meningitis. Nat Neurosci. 2022;25:567-76
10. Mazzitelli JA, Smyth LCD, Cross KA, Dykstra T, Sun J, Du SL. et al. Cerebrospinal fluid regulates skull bone marrow niches via direct access through dural channels. Nature Neuroscience. 2022;25:555-560
11. Smyth LCD, Xu D, Okar SV, Dykstra T, Rustenhoven J, Papadopoulos Z. et al. Identification of direct connections between the dura and the brain. Nature. 2024;627:165-73
12. Kang JH, Ko YT. Intraosseous administration into the skull: Potential blood-brain barrier bypassing route for brain drug delivery. Bioeng Transl Med. 2023;8(2):e10424
13. Liu W, Yang M, Wang N, Liu X, Wang C, Shi K. et al. Intracalvariosseous injection: an approach for central nervous system drug delivery through skull bone marrow with a preclinical research in stroke. EBioMedicine. 2025;112:105568
14. Kang JH, Yang JK, Cho KH, Lee OH, Kwon H, Kim SY. et al. Intracalvariosseous administration of donepezil microspheres protects against cognitive impairment by virtue of long-lasting brain exposure in mice. Theranostics. 2024;14:6708-25
15. Yushkevich PA, Piven J, Hazlett HC, Smith RG, Ho S, Gee JC. et al. User-guided 3D active contour segmentation of anatomical structures: significantly improved efficiency and reliability. Neuroimage. 2006;31:1116-28
16. Lowekamp BC, Chen DT, Ibanez L, Blezek D. The Design of SimpleITK. Front Neuroinform. 2013;7:45
17. Barriere DA, Magalhaes R, Novais A, Marques P, Selingue E, Geffroy F. et al. The SIGMA rat brain templates and atlases for multimodal MRI data analysis and visualization. Nat Commun. 2019;10:5699
18. Tustison NJ, Cook PA, Holbrook AJ, Johnson HJ, Muschelli J, Devenyi GA. et al. The ANTsX ecosystem for quantitative biological and medical imaging. Sci Rep. 2021;11:9068
19. Jeong SH, Jang JH, Lee YB. Drug delivery to the brain via the nasal route of administration: exploration of key targets and major consideration factors. J Pharm Investig. 2023;53(1):119-152
20. Pardridge WM. Blood-Brain Barrier and Delivery of Protein and Gene Therapeutics to Brain. Front Aging Neurosci. 2019;11:373
21. Gernert M, Feja M. Bypassing the Blood-Brain Barrier: Direct Intracranial Drug Delivery in Epilepsies. Pharmaceutics. 2020;12(12):1134
22. Ghannam JY, Al Kharazi KA. Neuroanatomy, Cranial Meninges. StatPearls. Treasure Island (FL). 2024
23. Mastorakos P, McGavern D. The anatomy and immunology of vasculature in the central nervous system. Sci Immunol. 2019;4(37):eaav0492
24. Warach S, Latour LL. Evidence of reperfusion injury, exacerbated by thrombolytic therapy, in human focal brain ischemia using a novel imaging marker of early blood-brain barrier disruption. Stroke. 2004;35:2659-61
25. Turtzo LC, Jikaria N, Cota MR, Williford JP, Uche V, Davis T. et al. Meningeal blood-brain barrier disruption in acute traumatic brain injury. Brain Commun. 2020;2:fcaa143
26. Hatten ME, Roussel MF. Development and cancer of the cerebellum. Trends Neurosci. 2011;34:134-42
27. Tan IL, Arifa RDN, Rallapalli H, Kana V, Lao Z, Sanghrajka RM. et al. CSF1R inhibition depletes tumor-associated macrophages and attenuates tumor progression in a mouse sonic Hedgehog-Medulloblastoma model. Oncogene. 2021;40:396-407
28. Bodranghien F, Bastian A, Casali C, Hallett M, Louis ED, Manto M. et al. Consensus Paper: Revisiting the Symptoms and Signs of Cerebellar Syndrome. Cerebellum. 2016;15:369-91
29. Aschner M, Lukey B, Tremblay A. The Manganese Health Research Program (MHRP): status report and future research needs and directions. Neurotoxicology. 2006;27:733-6
30. Avila DS, Puntel RL, Aschner M. Manganese in health and disease. Met Ions Life Sci. 2013;13:199-227
31. Narita K, Kawasaki F, Kita H. Mn and Mg influxes through Ca channels of motor nerve terminals are prevented by verapamil in frogs. Brain Res. 1990;510:289-95
32. Pautler RG. Biological applications of manganese-enhanced magnetic resonance imaging. Methods Mol Med. 2006;124:365-86
33. McCabe SM, Zhao N. Expression of Manganese Transporters ZIP8, ZIP14, and ZnT10 in Brain Barrier Tissues. Int J Mol Sci. 2024;25(19):10342
34. Pautler RG, Koretsky AP. Tracing odor-induced activation in the olfactory bulbs of mice using manganese-enhanced magnetic resonance imaging. Neuroimage. 2002;16:441-8
35. Aoki I, Wu YJ, Silva AC, Lynch RM, Koretsky AP. In vivo detection of neuroarchitecture in the rodent brain using manganese-enhanced MRI. Neuroimage. 2004;22:1046-59
36. Lin YJ, Koretsky AP. Manganese ion enhances T1-weighted MRI during brain activation: an approach to direct imaging of brain function. Magn Reson Med. 1997;38:378-88
37. Yu X, Zou J, Babb JS, Johnson G, Sanes DH, Turnbull DH. Statistical mapping of sound-evoked activity in the mouse auditory midbrain using Mn-enhanced MRI. Neuroimage. 2008;39:223-30
38. Deng W, Faiq MA, Liu C, Adi V, Chan KC. Applications of Manganese-Enhanced Magnetic Resonance Imaging in Ophthalmology and Visual Neuroscience. Front Neural Circuits. 2019;13:35
39. Van der Linden A, Verhoye M, Van Meir V, Tindemans I, Eens M, Absil P. et al. In vivo manganese-enhanced magnetic resonance imaging reveals connections and functional properties of the songbird vocal control system. Neuroscience. 2002;112:467-74
40. Rallapalli H, Tan IL, Volkova E, Wojcinski A, Darwin BC, Lerch JP. et al. MEMRI-based imaging pipeline for guiding preclinical studies in mouse models of sporadic medulloblastoma. Magn Reson Med. 2020;83:214-27
41. Rallapalli H, Darwin BC, Toro-Montoya E, Lerch JP, Turnbull DH. Longitudinal MEMRI analysis of brain phenotypes in a mouse model of Niemann-Pick Type C disease. Neuroimage. 2020;217:116894
42. McCabe SM, Zhao N. The Potential Roles of Blood-Brain Barrier and Blood-Cerebrospinal Fluid Barrier in Maintaining Brain Manganese Homeostasis. Nutrients. 2021;13(6):1833
Author contact
![]() Corresponding authors: li.liu3gov; koretskyanih.gov.
Corresponding authors: li.liu3gov; koretskyanih.gov.