Impact Factor
- Issue 14; 2026
- Issue 13; 2026
- Issue 12; 2026
- Issue 11; 2026
- Issue 10; 2026
- Volume 16; 2026
- Advance Articles
- Past Issues
- Cover Images
- Cover Suggestion
- Index & Coverage
- Special Issues
Introduction
Methods
Results
Discussion
Conclusion
Abbreviations
Supplementary Material
Acknowledgements
References
International Journal of Biological Sciences
International Journal of Medical Sciences
 Global reach, higher impact

Theranostics 2025; 15(18):9678-9694. doi:10.7150/thno.116483 This issue Cite
Research Paper
Single-shot multiparametric MRI for separating T2 effects from dynamic glucose-enhanced contrast
Junxian Jin1, Haizhen Ding2, Zhekai Chen1, Yuan Huang1, Hongmin Chen2, Zhong Chen1 ![]() , Lin Chen1
, Lin Chen1 ![]()
1. Department of Electronic Science, Fujian Provincial Key Laboratory of Plasma and Magnetic Resonance, School of Electronic Science and Engineering, National Model Microelectronics College, Xiamen University, Xiamen, China.
2. State Key Laboratory of Vaccines for Infectious Diseases, Xiang An Biomedicine Laboratory, National Innovation Platform for Industry-Education Integration in Vaccine Research, School of Public Health, Xiamen University, Xiamen, China.
Received 2025-4-26; Accepted 2025-8-14; Published 2025-8-30
Abstract

Background: Glucose is a central substrate in cellular metabolism and serves as a non-invasive biomarker for pathological processes. Dynamic glucose-enhanced (DGE) MRI based on chemical exchange saturation transfer (CEST) offers a promising tool for mapping glucose uptake, but its quantification is confounded by glucose-induced changes in T2 relaxation in addition to glucose concentration.
Methods: We developed a single-shot multiparametric CEST (MP-CEST) MRI sequence based on multi-echo spatiotemporal encoding (SPEN), enabling the simultaneous acquisition of T2 and saturation-weighted proton density (PD) maps within a single scan. To correct for T2-related confounding effects in glucoCEST quantification, a two-step correction strategy was employed. First, the saturation-weighted PD maps, which mitigate T2-dependent signal attenuation during image acquisition, were used to reconstruct the Z-spectrum, thereby providing a more accurate representation of the true saturation signal amplitude. Second, calibration curves derived from Bloch-McConnell simulations were applied in combination with the simultaneously acquired T2 maps to compensate for spillover effects in the Z-spectrum, thereby improving glucose-specific CEST contrast. The full framework was validated through phantom experiments and in vivo studies in rat brain and tumor xenograft models. Quantitative performance was evaluated by computing the Pearson correlation between DGE signals and T2 values before and after correction, as well as by comparing fitted T2 and PD values with reference maps.
Results: Phantom experiments demonstrated high accuracy in PD and T2 quantification (R2 > 0.99). In vivo studies in rat brain and tumor xenografts showed that the proposed correction method significantly reduced the correlation between DGE signals and T2 values, improving the specificity of glucose-related contrast. In addition, T2 maps provided complementary structural and physiological information relevant to tumor heterogeneity and tissue microstructure.
Conclusions: The proposed MP-CEST approach improves the robustness and accuracy of DGE quantification, offering a more comprehensive metabolic imaging framework applicable to both oncological and neurological research.
Keywords: glucose uptake, dynamic glucose enhanced, chemical exchange saturation transfer, multiparametric, single-shot
Introduction
Glucose is the primary source of energy in most organisms [1], and abnormal glucose metabolism is a hallmark of numerous diseases, such as cancer [2, 3], diabetes [4, 5], and Alzheimer's disease [6, 7]. Monitoring glucose dynamics is not only critical for maintaining metabolic homeostasis and understanding physiological processes but also serves as a key biomarker for disease diagnosis, progression tracking, and therapeutic response assessment [8, 9]. Given its clinical significance, developing sensitive and non-invasive glucose imaging techniques is valuable for improving the detection and management of glucose-related disorders [10].
For several decades, glucose uptake and metabolism have been assessed non-invasively using [18F]-fluorodeoxyglucose positron emission tomography (FDG-PET) [11]. Despite its great detection sensitivity, the high cost of FDG-PET limits its widespread clinical application. In addition, the use of a radioactive tracer is not ideal for repeated measurements, especially when combined with CT for anatomical referencing [12]. Alternative methods for assessing glucose uptake and utilization include 13C, 2H and 1H in vivo magnetic resonance spectroscopy (MRS) [13-15], along with a novel deuterium metabolic imaging approach [16]. Although MRS techniques have been successful in studying basic metabolic processes during glucose infusion, their limited detection sensitivity and spatial resolution pose challenges for clinical implementation.
Recently, glucose chemical exchange saturation transfer (glucoCEST) MRI has been well-established for detecting unlabeled glucose at physiologically relevant concentrations by exploiting the interaction between hydroxyl protons and water [1, 17, 18]. The time-resolved variant, known as Dynamic Glucose-Enhanced (DGE) MRI, measures dynamic changes in MR signals induced by variations in glucose concentration following administration. This approach was developed to study glucose dynamics with high temporal resolution by omitting the time-consuming acquisition of full spectra [19, 20]. As research progressed, it became evident that fluctuations in glucose concentration also modulate tissue T2, as reported in previous studies [21]. This newly recognized T2-dependent effect introduces a confounding influence on the interpretation of DGE signals via two primary mechanisms. First, the glucoCEST resonance lies in close spectral proximity to the bulk water signal (~1 ppm), making it highly vulnerable to spillover artifacts. The extent of this spillover is known to depend on tissue T2 relaxation, implying that variations in T2 can indirectly alter the observed glucoCEST contrast by modulating the degree of signal contamination [22, 23]. Second, T2 decay during image acquisition can influence the measured CEST signal [24]; thus, variations in T2 may induce glucoCEST signal changes that reflect glucose concentration in a confounded or more complex manner [21]. Despite the potential for these T2-related effects to bias both the sensitivity and specificity of DGE measurements, they have received limited systematic investigation. To date, few studies have quantitatively assessed the impact of T2 variability or developed correction strategies to mitigate its confounding influence, leaving a critical methodological gap in the accurate interpretation of glucose-enhanced MRI data.
In this study, we address the confounding impact of T2 variability on DGE signal quantification by proposing a novel single-shot multiparametric CEST (MP-CEST) technique based on multi-echo spatiotemporal encoding (SPEN). This approach enables the simultaneous acquisition of T2 and saturation-weighted proton density (PD) maps through numerical fitting of multiple T2-weighted images acquired at different echo times [25, 26]. By leveraging the saturation-weighted PD signal for DGE quantification, our method minimizes T2 decay-related modulation effects during image readout. In addition, we derived T2 calibration curves based on Bloch-McConnell simulations and T2 maps to retrospectively correct for T2-induced changes occurring during CEST saturation. The feasibility and efficacy of this correction strategy were validated through both phantom experiments and in vivo imaging in rat brain and subcutaneous tumor xenograft models. Statistical evaluation demonstrated the potential of the proposed MP-CEST approach to improve the reliability of DGE measurements under varying T2 conditions.
Methods
MP-CEST MRI sequence
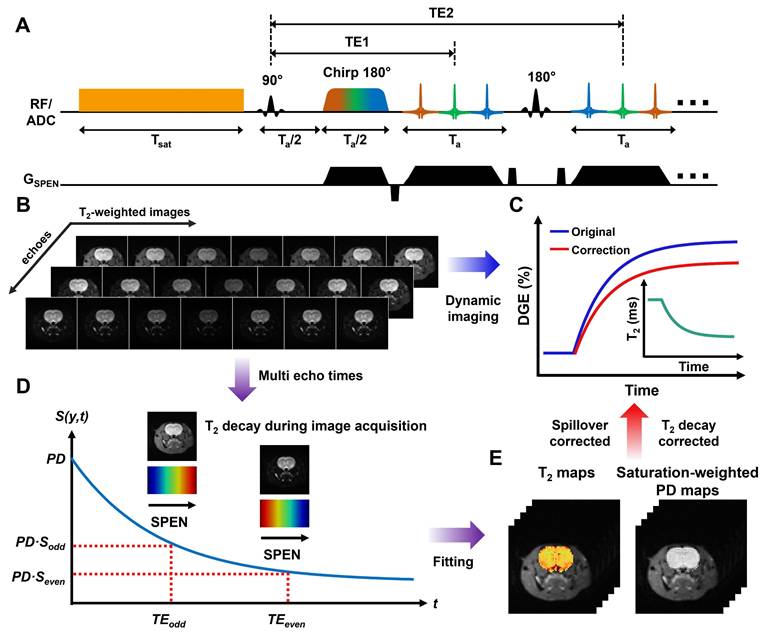
The MP-CEST MRI sequence proposed in this study is illustrated in Figure 1A. It involves a long rectangular pulse to induce saturation transfer effects, consisting of a presaturation period with duration tsat and an irradiation field with amplitude B1, tuned to a frequency offset ∆ω from the water proton resonance. The CEST image was acquired using SPEN imaging module with multi-echo train acquisitions. The encoding phase following the application of chirp pulses in SPEN MRI can be expressed as [25, 26]:
Schematic overview of single-shot multiparametric CEST (MP-CEST) MRI framework. (A) Timing diagram of the MP-CEST sequence. A long rectangular saturation pulse with duration tsat and amplitude B1, tuned to a frequency offset Δω from the water resonance, is applied prior to data acquisition using a hybrid SPEN readout followed by a multi-echo echo train. (B) Representative T2-weighted images acquired at multiple echo times and frequency offsets in an in vivo rat brain. (C) DGE signal curves before and after T2 correction, along with a conceptual diagram of dynamic T2 changes over time. (D) Illustration of signal decay over time across multiple echo times, showing T2-dependent signal attenuation. (E) Simultaneous T2 and saturation-weighted PD maps obtained using a model-based fitting approach applied to the multi-echo SPEN data.
(1)
where γ represents the gyromagnetic ratio, Gey and Tey are the amplitude and duration of the encoding gradient along the y dimension, respectively. Ly is FOV along the y dimension. The phase variation during the acquisition period t can be expressed as
(2)
where Gacq is the acquisition gradient, for simplicity, we assume Gacq to be constant.
A multi-echo train is generated by interleaving 180° sinc pulses with signal acquisition modules, and the phase modulation of the odd and even echo trains can be described as follows:
(3)
where Ta represents the acquisition period for each echo train, and tt is the evolution time during each decoding segment of the echo train. Representative multi-echo images acquired at different frequency offsets in an in vivo rat brain using this sequence are shown in Figure 1B. Based on the characteristics of the SPEN approach [27-29], the main contribution to the acquired signal energy comes from the spin density around the stationary point of the quadratic phase profile. Therefore, each sampled signal is modulated by both spatial encoding and T2 decay, as described below:
(4)
where TEeff refers to the nominal echo time. Based on Eq. 4 and TEeff, voxel-wise mono-exponential fitting of the multi-echo images was performed to estimate both T2 and saturated-weighted PD. The complete data processing workflow and a representative fitting result are illustrated in Supplementary Section 1 (Figures S1-2). The characteristic signal modulation behavior of SPEN MRI enables simultaneous quantification of saturation-weighted PD and T2 relaxation through numerical fitting of multiple T2-weighted images acquired at different echo times [25, 26], as illustrated in Figure 1D-E.
Theoretical Derivation
According to previous studies [30, 31], the normalized saturation signal S can be well described by the R1ρ relaxation theory, which is formulated as follows [32, 33]:
(5)
(6)
where Sss refers to the Z-spectral intensity at steady-state, R1 is the longitudinal relaxation rate of water, tsat is the saturation time, and θ = tan-1ω1/∆ is the tilt angle of the effective magnetization with respect to the Z-axis induced by a saturation pulse with nutation frequency ω1 at an offset ∆, R1ρ represents the water relaxation rate under a saturation pulse, incorporating both the effective water relaxation (Reff) and an apparent saturation transfer-related term (RST) reflecting all exchange processes in tissue [22]:
(7)
where Reff = cos2θ∙R1 + sin2θ∙R2 represents the effective longitudinal relaxation rate of water in the rotating frame in the absence of additional solute or exchange components. Based on the R1ρ theory, the contributions from multiple CEST effects can be linearly combined, as R1ρ exhibits an approximately additive response to different exchanging pools [33, 34]. In this study, we employed a two-pool model comprising a glucose pool and a background pool representing all other exchanging protons to analyze the CEST signal, as described below:
(8)
By combining Eqs. 6 and 7, the Sss can be derived as follows:
(9)
For in vivo glucoCEST experiments, the glucose pool resonates close to water, and the effect of R₂ cannot be neglected. When R2 is much greater than cos2θ∙R1 + RST, (where R2 > 14 s-1 within the physiological range and cos2θ∙R1 + RST is approximately 1 s⁻¹), the Sss in Eq. 6 can be approximated as follows:
(10)
The MTRasym, which isolates the glucoCEST effect by subtracting the background signal, is defined as:
(11)
For in vivo glucoCEST experiments at a B1 of 2 μT, the glucose-related relaxation rate (Rglucose) is much smaller than the background relaxation rate (Rbackground) due to strong MTC effects and spillover effect (i.e., Rglucose ≪ Rbackground). Under this condition, the MTRasym in Eq. 11 can be approximated as follows:
(12)
where dS/dR1ρ can be calculated from Eq. 5, and is given by:
(13)
By combining Eqs. 12 and 13, the MTRasym can be derived as follows:
(14)
Under steady-state saturation, the MTRasym can be simplified as follows [30]:
(15)
where Sbackground and Sglucose represent the normalized saturation signal at steady-state when only the background or glucose pool is present, respectively. This indicates that the MTRasym can be significantly attenuated by a factor of  in the presence of a strong background signal, a phenomenon referred to as the “scaled-down effect” in our previous studies [30, 31].
In this study, we propose a correction algorithm to remove the T2 effect, thereby improving the correlation between DGE signal changes and glucose concentration toward a more linear relationship. According to Eq. 10, the relationship between Sbackground and the change in T2 can be expressed as follows:
(16)
where  denotes the baseline transverse relaxation time, ∆T2 represents the change of transverse relaxation time during the DGE experiment, k characterizes the linear sensitivity of the background signal to T2 variations. Therefore, a linear correction model was applied to mitigate T2-induced variations in the background signal of the single-offset DGE measurement.
From Eq. 15, the background signal induces a scaled-down effect on the observed MTRasym. The contribution to the observed MTRasym due to background fluctuations can be formulated as:
(17)
By combining Eqs. 16 and 17, the  can be formulated as:
(18)
Eq. 18 represents the analytical expression for the background-induced variation in MTRasym as a function of ΔT2. To facilitate fitting and correction, this relationship was approximated by a second-order polynomial, as described below:
(19)
where a and b are the coefficients of a second-order polynomial that describe the relationship between ΔT2 and the background-induced contribution to observed MTRasym change, the constant term c is included to account for residual baseline shifts and other unmodeled systematic variations that may arise in experimental data. The corrected MTRasym signal was obtained by subtracting the fitted background contribution  from the original MTRasym signal.
Correction parameters (k, a, b, and c) were derived from Bloch-McConnell simulations based on experimental and literature-informed parameters for the phantom [21], in vivo mouse brain [35, 36], and tumor [37, 38], respectively. For the phantom experiment, the background consisted solely of water, whereas in the in vivo setting, an additional magnetization transfer contrast (MTC) component was included, as detailed in Table S1. Validation of the model's robustness and generalizability is presented in Supplementary Section 2 (Figures S3-6). All simulations and voxel-wise fittings were implemented using custom MATLAB scripts (R2019b, MathWorks), with corrections applied according to Eqs. 16 and 19. A schematic overview of the DGE signal dynamics before and after T2 correction, along with a conceptual illustration of temporal T2 changes, is presented in Figure 1C.
Numerical simulation validation
Numerical simulations were conducted to evaluate the effectiveness of spillover correction under varying T2 conditions. According to the previous study [21], changes in glucose concentration will alter the tissue T2 value, which can be described as follows:
(20)
where R2,water refers to the tissue R2 value without glucose change and R2,glc refers to the tissue R₂ value after a change in glucose concentration [Glc]. r2ex, glc represents the transverse relaxivity of glucose, which was set to 0.053 s-1 mM-1 under 7 T conditions, based on the previous study. Z-spectra were simulated to model glucose exchangeable protons at 1.2 ppm, with concentrations ranging from 0 to 500 mM in 10 mM increments. Frequency offsets were sampled from -5 to 5 ppm in 0.1 ppm steps. Saturation power and duration were set to 2 µT and 2 s, respectively. Additional simulation parameters are detailed in Supplementary Table S2.
Phantom experiments
D-glucose solutions (10-310 mM; 10, 50, 100, 150, 230, and 310 mM) were prepared in phosphate-buffered saline (PBS) containing 2 mM Gd-DTPA, with pH adjusted to 7.2, and experiments were conducted at 22 °C. Experiments were conducted on a 7 T Varian MRI system (Varian Associates, Palo Alto, CA) equipped with a horizontal-bore Magnex magnet and 10 cm-bore imaging gradient coils. The MP-CEST sequence was implemented in the VNMRJ 4.0 environment. Imaging parameters were: saturation power = 2 µT, saturation duration = 2000 ms, FOV = 50 × 50 mm2, slice thickness = 2 mm, chirp time-bandwidth product = 120, 5-echo train with 25 ms echo spacing, and TR = 5000 ms. Frequency offsets ranged from -5 to 5 ppm with 0.2 ppm steps. Reference T2 and PD maps were acquired using spin-echo imaging with multiple echo times (TE = 12, 20, 32, 50, 70, 100, 150 ms; TR = 2000 ms), and the total scan time was 22 min 24 s. Details of the optimization process for echo spacing and the number of echoes are provided in Supplementary Section 4 (Figure S7 and Table S3).
Animal preparations
All animal procedures were approved by the Animal Experimental Center of Xiamen University. In this study, six female Sprague-Dawley (SD) rats (aged 9-11 weeks, weighing 190-220 g) and three female BALB/c mice were used. All animals were purchased from Shanghai SLAC Laboratory Animal Co., Ltd. (Shanghai, China).
Tumor-bearing mice were established by subcutaneous injection of 5 × 10⁶ 4T1 cells into the right hind limb of 6-week-old BALB/c mice (∼20 g). MRI was performed when tumor volumes reached ~100 mm³. Prior to imaging, animals were anesthetized with 4% isoflurane (rats) or 2% isoflurane (mice) for induction, followed by maintenance at 2% and 1%, respectively, during scanning. A tail vein catheter was placed for intravenous glucose administration. Dynamic imaging was performed continuously, starting before and continuing through the 1-minute intravenous injection of filtered D-glucose solution (50% w/w, 0.5 g/mL, ~2.78 M; 1.5 mL for rats; 0.1 mL for mice). Several baseline images were acquired prior to injection and used as references for subsequent normalization of the DGE signal.
In vivo experiments
In vivo imaging was performed on a 7 T Varian MRI scanner (Varian Associates, Palo Alto, CA) equipped with a horizontal-bore Magnex magnet and 10 cm-bore gradient coils. B0 field homogeneity over the rat brain was optimized using field mapping and second-order shimming before DGE acquisition. The MP-CEST sequence was applied with the following parameters: saturation power = 2 µT, saturation duration = 2000 ms, FOV = 45 × 45 mm2, slice thickness = 2 mm, chirp time-bandwidth product = 120, 5-echo train with 25 ms echo spacing, and TR = 5000 ms. For dynamic DGE imaging, CEST data were acquired at ±2.0, ±1.5, ±1.2, ±0.9, and 0 ppm offsets relative to water. Signal intensity at 1.2 ppm was extracted for DGE quantification, yielding a temporal resolution of 45 s per image pair. A total of 2700 images were acquired over 46 minutes. Each dynamic repetition included five echoes across nine frequency offsets, resulting in 45 echo-offset combinations per time point. Sixty dynamic repetitions were acquired, yielding 60 time points for DGE analysis. Every set of five echoes was used to generate T2 and saturation-weighted PD maps. Dynamic scanning began with 10 baseline scans over 7 min 30 s, followed by a 1-minute intravenous injection of 50% D-glucose and continued acquisition for 37 min 30 s post-injection.
MRS
To verify glucose uptake, localized proton MRS was acquired twice: once immediately before glucose injection and once following the completion of the MP-CEST scan. This sequential protocol ensured that the MRS measurements reflected pre- and post-infusion metabolite levels without interrupting the dynamic glucoCEST imaging. All MRS scans were performed using a point-resolved spectroscopy (PRESS) sequence with outer volume suppression (OVS). Water suppression was achieved using the variable power RF pulses and optimized relaxation delays (VAPOR) technique [39]. Second-order localized shimming was performed using B0 field mapping prior to each acquisition. The MRS protocol used the following parameters: TR = 2000 ms, TE1 = 7.5 ms, TE2 = 6 ms, 4096 complex points, NEX = 128, and a total acquisition time of 4 min 16 s. For in vivo MRS acquisition, a single voxel (4 × 4 × 4 mm³) was placed in the posterior thalamic region of the rat brain and the dorsal region of the subcutaneous tumor, respectively. These locations were selected to ensure inclusion of relatively large and homogeneous tissue areas, minimizing partial volume effects and susceptibility-induced distortions.
Data analysis
A signal normalization process was applied to the Z spectrum using saturation-to-baseline ratio normalization, defined as the ratio of the water signal during saturation to the unsaturated baseline signal:
(21)
where S is the normalized image intensity, Z refers to the saturated signal obtained after applying the saturation pulse (e.g., saturation-weighted PD or T2-weighted images), while Z₀ is the baseline signal acquired without saturation and is used for normalization.
DGE MRI is defined as the dynamic changes in MR signals induced by variations in glucose concentration following administration. For single-offset DGE quantification, which measures the temporal change of the CEST signal at 1.2 ppm, normalization was applied using the pre-injection baseline signal S, as formulated below:
(22)
where Sbaseline denotes the average of all pre-injection T2-weighted CEST images or PD maps, and S(t) is the corresponding signal at time t.
For MTRasym DGE signal quantification, the signal was defined as the temporal difference at 1.2 ppm in the MTRasym spectrum relative to the pre-injection baseline:
(23)
To correct for motion between CEST images, image registration was performed using the Medical Imaging Registration Toolbox [40]. The unsaturated image was used as the reference target, and all other CEST images were aligned to it. The registration parameters were as follows: similarity measure set to residual complexity, three hierarchical resolution levels, mesh window size of 8, regularization weight of 0.005, maximum of 200 iterations, tolerance of 1 × 10⁻⁵, and annealing rate of 0.8. Regions of the rat brain were then automatically segmented [41] based on the registered standard rat brain atlas (http://atlas.brain-map.org/).
For LCModel analysis, the total creatine (tCr) concentration was used as an internal reference to quantify D-glucose uptake [42]. Specifically, the glucose concentration change (Δ[Glc]) following D-glucose administration was estimated using the area ratio between the difference spectrum of the D-glucose peaks (3.4-4.0 ppm) and the tCr methyl peak (3.0 ppm) in the pre-injection reference spectrum (RGlc/tCr), according to the following equation:
(24)
where 3/5 represents the proton ratio between the methyl peak of total creatine (tCr) at 3.0 ppm (three protons) and the combined D-glucose peaks between 3.4 and 4.0 ppm (five protons).
Statistical analysis
All statistical analyses were performed using MATLAB (R2019b, MathWorks). Quantitative data are reported as mean ± standard deviation (SD). Group comparisons were assessed using unpaired two-tailed Student's t-tests or one-way analysis of variance (ANOVA), as appropriate. A P-value < 0.05 was considered statistically significant. Pearson correlation coefficients (R) and corresponding P-values were calculated to assess the linear association between DGE signals and T2 values before and after correction.
Results
Validation of MP-CEST-derived PD and T2 mapping
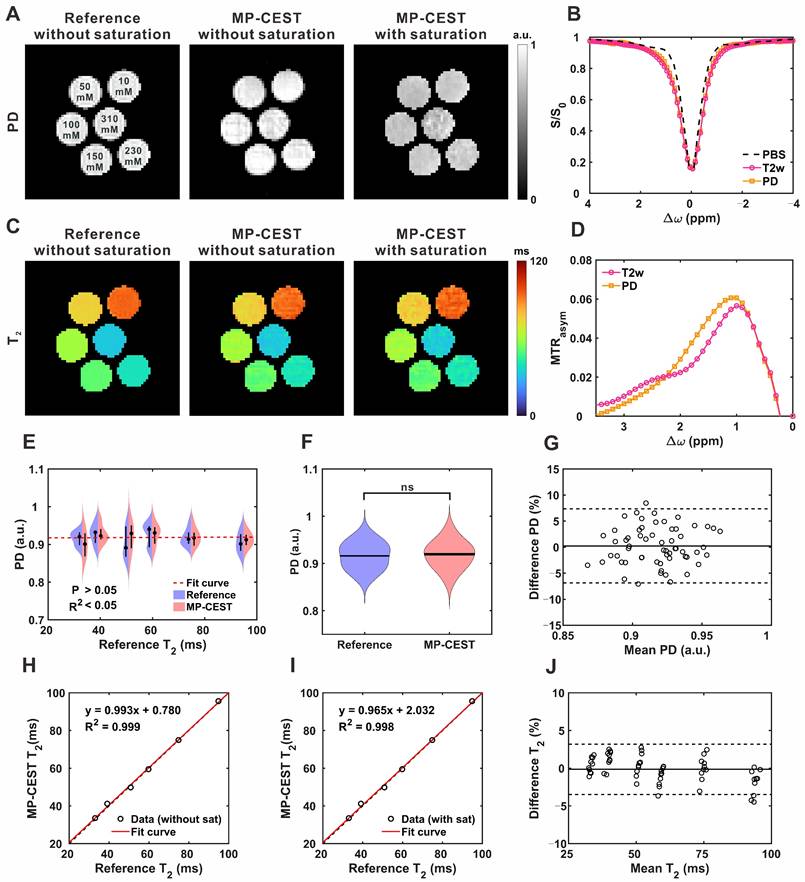
Figure 2 summarizes the validation of MP-CEST-derived PD and T2 mapping against reference measurements in phantom experiments. PD and T2 maps acquired using MP-CEST, with and without saturation, along with reference maps, are shown in Figure 2A and 2C; additional maps are provided in Figure S8. Violin plots (Figure 2E-F) show that, in the absence of saturation, there was no significant difference between MP-CEST-derived PD values and the reference PD measurements (P = 0.639). Additionally, no correlation was observed between PD and T2 values (R² < 0.001). In contrast, T2 values exhibited strong linear agreement with reference measurements (R2 = 0.999 without saturation; R2 = 0.998 with saturation; Figure 2H-I). Bland-Altman analysis (Figure 2G and 2H) further confirmed the agreement, with MP-CEST showing a mean bias of -0.24% for PD and +0.13% for T2 compared to the reference. These results indicate that saturation leads to a frequency-dependent reduction in PD values. For example, the reduction was 2.61% ± 1.15% at 3.0 ppm (P = 0.028, effect size = 0.408) and 20.81% ± 4.36% at 1.2 ppm (P < 0.001, effect size = 3.117). In contrast, T2 measurements were minimally affected, suggesting that the observed changes primarily reflect alterations in proton density. GlucoCEST signals originating from hydroxyl protons were observed as asymmetry in the 0-2 ppm range in the tube containing 50 mM glucose (Figure 2B), and became more pronounced in the corresponding MTRasym plot (Figure 2D). The Z-spectrum derived from saturation-weighted PD images exhibited a significantly narrower spectral peak compared to that from T2-weighted images, with a full width at half maximum (FWHM) of 0.947 ± 0.074 ppm versus 0.973 ± 0.075 ppm (P = 0.028). Similar results were observed for the tube containing 10 mM glucose (Figure S9). This narrowing enhances the specificity for glucose-related exchangeable protons and indicates effective mitigation of T2-dependent signal broadening during acquisition.
GlucoCEST imaging of glucose phantoms at 7 T using the proposed MP-CEST method. (A) PD maps obtained from the reference and proposed methods, both with and without saturation. (B) Z-spectra derived from T2-weighted images and saturation-weighted PD images at a glucose concentration of 50 mM. (C) T2 maps corresponding to the conditions in (A). (D) Corresponding MTRasym plots calculated from the respective Z-spectra. (E) Violin plots comparing PD values versus T2 values between the reference and proposed methods. (F) Violin plots showing direct PD value comparisons between the two methods. (G) Bland-Altman plot assessing agreement in PD values between the proposed and reference methods. (H, I) Scatter plots of quantitative T2 values from the six glucose tubes, without (H) and with (I) saturation. (J) Bland-Altman plot comparing T2 values from the proposed and reference methods.
Evaluation of T2 effects on CEST metrics and correction performance
Figure 3A-D presents the simulation results obtained under varying glucose concentrations with a fixed T2 value. As glucose concentration increased, the normalized signal (S/S0) decreased near the 1.2 ppm offset, while MTRasym increased (Figure 3A and 3C). These effects were quantified by fitting S/S0 and MTRasym to glucose concentration (Figure 3B and 3D), revealing a linear negative correlation for S/S0 and a linear positive correlation for MTRasym. To evaluate the effect of T2 relaxation on CEST metrics, simulations were conducted with varying T2 values while keeping glucose concentration constant.
Simulation of glucoCEST signal under varying glucose concentrations and T2 relaxation times. (A) Simulated Z-spectra at different glucose concentrations. (B) Correlation between glucose concentration and normalized saturation signal (S/S0). (C) MTRasym curves corresponding to (A). (D) Correlation between glucose concentration and MTRasym. (E) Simulated Z-spectra at varying T2 relaxation times. (F) Correlation between T2 and S/S0. (G) MTRasym curves corresponding to (E). (H) Correlation between T2 and MTRasym. (I) Z-spectra under combined variations of T2 and glucose concentration. (J) Correlation between combined T2-glucose variations and S/S0. (K) MTRasym under the same combined conditions. (L) Correlation between combined T2-glucose variations and MTRasym.
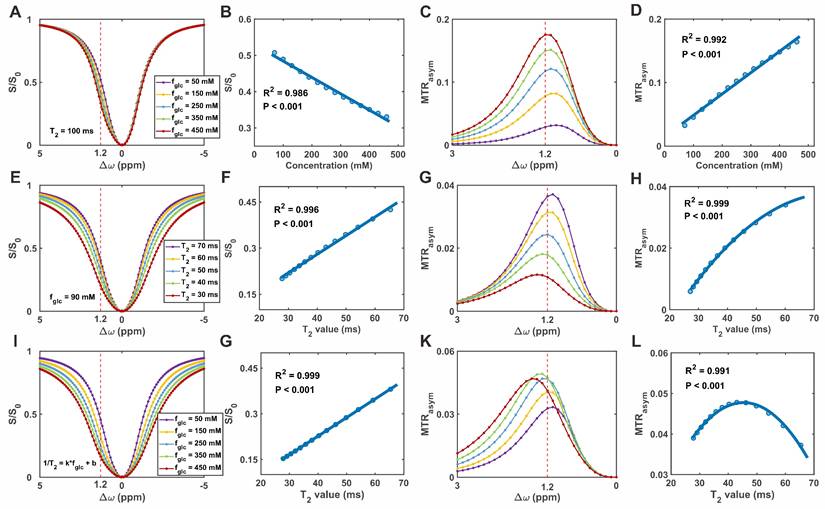
As T2 increased, Z-spectrum intensities rose across the entire frequency offset range (-5 to +5 ppm), accompanied by an increase in MTRasym (Figure 3E and 3G). Quantitative analysis demonstrated a linear positive relationship between T2 and S/S0, while MTRasym exhibited a second-order (quadratic) dependence on T2 (Figure 3F and 3H). Under physiological conditions, increases in glucose concentration are typically associated with reductions in T2 relaxation times. To account for this coupling, simulations were performed in which glucose concentration and the corresponding T2 values were varied simultaneously. As shown in the Z-spectrum (Figure 3I), increasing glucose concentration, along with the associated decrease in T2, resulted in a cumulative effect that led to a further reduction in S/S0. In contrast, the effect on MTRasym at 1.2 ppm was more complex, exhibiting a biphasic response characterized by an initial increase followed by a subsequent decrease (Figure 3K). To better characterize these trends, the relationships between T2 and CEST metrics were further analyzed. As shown in Figure 3G and 3L, S/S0 increased linearly with T2, while MTRasym exhibited a second-order (quadratic) dependence. These findings support the correction model, in which T2 and glucose linearly affect S/S0, while their combined effect on MTRasym follows a quadratic, scale-down behavior. Additional evaluations of which form of transverse relaxation is more suitable for correction are shown in Figure S10.
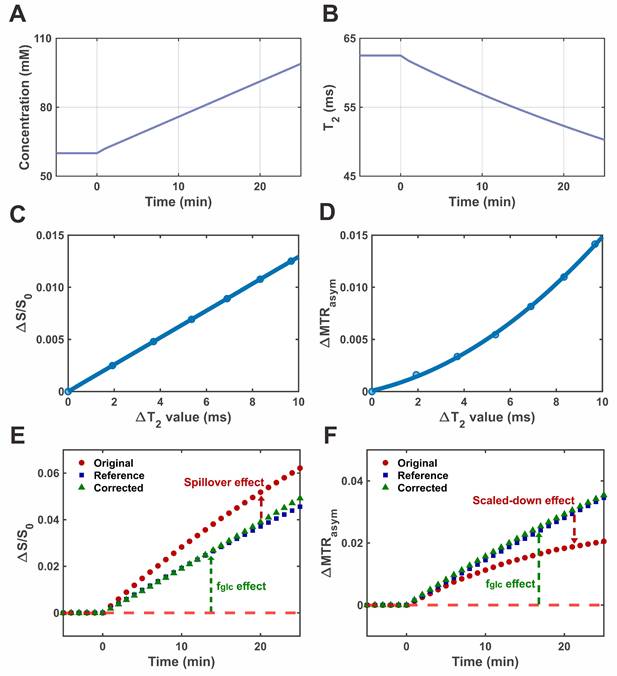
To evaluate the performance of the proposed correction strategy under dynamic conditions, a simulated DGE experiment was conducted incorporating time-dependent changes in both glucose concentration and T2 relaxation. Figure 4 summarizes the simulation framework and correction outcomes. The temporal evolution of glucose concentration and corresponding T2 values, mimicking physiological uptake dynamics, is shown in Figure 4A-B, respectively. As glucose concentration increased over time, T2 decreased accordingly, consistent with previously reported in vivo observations. Based on the modeled relationships between ΔT2 and both S/S0 and MTRasym (Eqs. 16 and 19), correction curves were generated to describe their respective T2 dependencies (Figure 4C-D). The single-offset DGE signal displayed a linear dependence on T2, whereas MTRasym-based DGE followed a second-order (quadratic) trend. These T2-related effects introduced systematic bias in the uncorrected signals: decreasing T2 led to an overestimation of the single-offset DGE signal and an underestimation of the MTRasym DGE signal (Figure 4E-F). The application of the correction curves effectively compensated for these distortions. The corrected signals showed improved temporal alignment with the reference dynamics and exhibited enhanced correlation with glucose concentration.
Simulation of DGE CEST imaging and T2 correction. (A) Simulated time-resolved curve of glucose concentration during glucose infusion. (B) Corresponding dynamic T2 relaxation curve derived from the glucose concentration profile. (C) Calibration curve showing the dependence of ΔS/S0 on T2 variation. (D) Calibration curve showing the dependence of ΔMTRasym on T2 variation. (E) Time-resolved single-shot DGE signal (ΔS/S0) from original, corrected, and reference data. (F) Time-resolved MTRasym-based DGE signal from original, corrected, and reference data.
In vivo validation of T2 correction in brain and tumor imaging
The single-offset DGE and MTRasym DGE images of the rat brain parenchyma before and after correction are shown in Figure 5A, 5B, 5D, and 5E. MRS spectra acquired before (blue) and after (red) D-glucose injection demonstrated clear spectral differences (green) within the resonance range of glucose H2-H6 protons (3.0-4.0 ppm; Figure 5C). Quantitative analysis revealed that glucose concentration increased from 1.16 ± 0.29 mM pre-injection to 2.33 ± 0.64 mM post-injection, corresponding to an increase of 1.17 ± 0.52 mM (P = 0.005, effect size = 2.357; Figure S11), confirming glucose accumulation in the brain parenchyma. In all four experimental groups, both DGE metrics exhibited a gradual increase over time, reaching an approximate steady state around 20 minutes post-injection (Figure 5G-H). Concurrently, dynamic T2 mapping (Figure 5I) revealed a slow decrease in T2 values within the ROI shown in Figure 5F, from 44.3 ± 0.6 ms to 43.0 ± 0.6 ms, consistent with expected physiological changes. Application of the T2 correction led to notable changes in the signal profiles. The peak single-offset DGE signal was significantly reduced from 1.62 ± 0.19% to 1.11 ± 0.16% (P = 0.009), corresponding to an overestimation of glucose concentration by 0.54 ± 0.34 mM (~46%) based on LCModel analysis. Conversely, the MTRasym DGE signal increased from 1.29 ± 0.20% to 1.84 ± 0.18% (P = 0.005), indicating an initial underestimation of 0.35 ± 0.22 mM (~30%) prior to T2 correction. Additional comparisons of fitted uptake parameters are presented in Figure S12, and regional comparisons of parenchymal DGE signals, quantified by area under the curve (AUC), are presented in Figure S13. To further evaluate the influence of T2 on CEST signal quantification, correlation analyses were performed in the brain parenchyma. For single-offset DGE, the uncorrected signal showed a moderate negative correlation with T2 (R = -0.476, P < 0.001; Figure 5J), which was abolished after correction (R = -0.007, P = 0.948; Figure 5K). Similarly, MTRasym DGE exhibited a weak negative correlation before correction (R = -0.292, P = 0.0085; Figure 5L), which was also eliminated following correction (R = -0.049, P = 0.664; Figure 5M). These results confirm that the correction method effectively reduces T2 dependence, thereby improving the robustness of glucose uptake measurements.
MP-CEST MRI results of brain parenchyma following D-glucose infusion. (A, D) Single-offset DGE images before and after glucose infusion, shown for original (A) and T2-corrected (D) data. (B, E) MTRasym-based DGE images for original (B) and corrected (E) datasets. (C) MRS spectrum showing glucose-enhanced signals between 3 and 4 ppm after infusion. (F) Dynamic T2 maps before and after glucose infusion, illustrating T2 relaxation changes. (G, H) Time-resolved curves of single-offset DGE (G) and MTRasym DGE (H) signals, comparing original and corrected data. (I) Time-resolved T2 value curves derived from dynamic T2 mapping. (J-M) Correlation analysis between T2 values and DGE signals: single-offset DGE vs. T2 for original (J) and corrected (K) data; MTRasym DGE vs. T2 for original (L) and corrected (M) data. Significance levels: 0.001 < **p < 0.01.
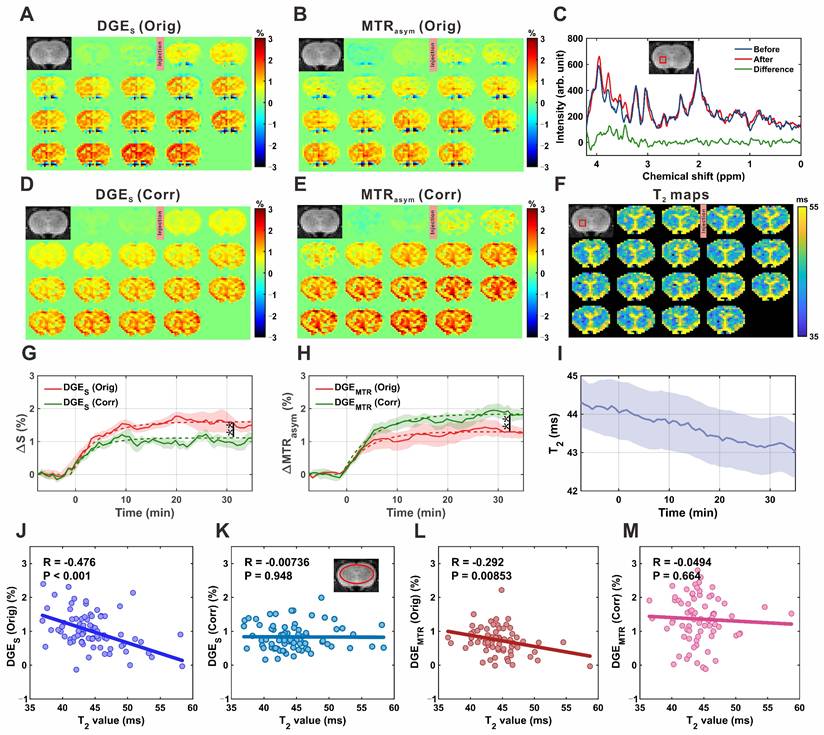
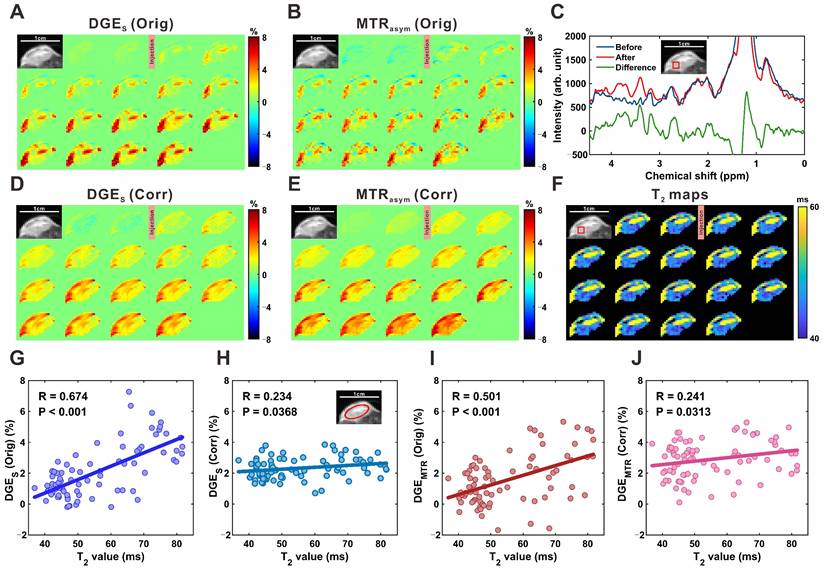
Figure 6A, 6B, 6D, and 6E show single-offset DGE and MTRasym DGE images of subcutaneous tumors before and after T2 correction. Localized MRS confirmed glucose uptake, with a marked increase in glucose resonance peaks within the 3.0-4.0 ppm range following infusion (Figure 6C), consistent with elevated intratumoral glucose levels. Compared to brain parenchyma, tumor DGE signals exhibited a sustained increase over time (Figure S14) and significantly higher signal intensities, reflecting enhanced uptake. T2 values concurrently decreased in tumor regions, from 47.5 ± 0.6 ms to 44.0 ± 0.8 ms in the region outlined in Figure 6F, and from 77.1 ± 3.3 ms to 62.3 ± 2.6 ms in another region shown in the supplementary material (Figure S15). Notably, greater T2 reductions coincided with more pronounced DGE signal increases, suggesting a relationship between T2 shortening and elevated glucose accumulation. To quantify this relationship, pixel-wise correlation analyses were performed. For single-offset DGE, the uncorrected signal showed a strong positive correlation with T2 (R = 0.674, P < 0.001; Figure 6G), which was significantly reduced following correction (R = 0.234, P = 0.037; Figure 6H). Similarly, MTRasym DGE exhibited a moderate pre-correction correlation (R = 0.501, P < 0.001; Figure 6I) that was attenuated post-correction (R = 0.241, P = 0.031; Figure 6J). These findings demonstrate that the proposed correction strategy accounts for T2-related contributions in tumor CEST imaging, improving the linearity between DGE signal changes and glucose concentration.
MP-CEST MRI results of subcutaneous tumor xenograft following D-glucose infusion. (A, D) Single-offset DGE images before and after glucose infusion, shown for original (A) and T2-corrected (D) data. (B, E) MTRasym-based DGE images for original (B) and corrected (E) datasets. (C) MRS spectrum indicating glucose-enhanced peaks between 3 and 4 ppm following infusion. (F) Dynamic T2 maps before and after glucose infusion, reflecting relaxation changes within the tumor. (G, H) Scatter plots showing correlations between single-offset DGE signals and T2 values for original (G) and corrected (H) data. (I, J) Correlation plots between MTRasym DGE signals and T2 values for original (I) and corrected (J) data.
Discussion
In this study, we present a single-shot multiparametric CEST MRI approach that enables simultaneous acquisition of saturation-weighted PD and T2 maps, along with correction of T2 variation-induced signal changes in DGE imaging arising from both T2 decay and spillover effects. Validation in phantom experiments demonstrated high agreement between the estimated PD and T2 maps and reference spin-echo measurements. Importantly, we found that dynamic T2 changes during glucose uptake can bias both single-offset DGE and MTRasym signals, leading to potential overestimation or underestimation of glucose-related contrast. By incorporating T2 calibration into the DGE processing pipeline, these confounding effects were substantially mitigated. The effectiveness of the proposed correction strategy was further confirmed through in vivo experiments in both the rat brain and subcutaneous tumor models.
Changes in tissue glucose concentration can alter T2 relaxation through chemical exchange between glucose hydroxyl protons and water protons [21, 43], thereby introducing confounding factors in glucoCEST signal quantification. A key contributing factor is the modulation of spillover in the Z-spectrum, which is mediated by changes in T2 relaxation [44]. Specifically, a decrease in T2 broadens the water resonance peak, thereby reducing the frequency selectivity of the saturation pulse and increasing spectral overlap with glucose hydroxyl protons [45, 46]. In addition to its effect on spillover, T2 also influences glucoCEST contrast during signal acquisition. Following saturation, the transverse magnetization decays as a function of T2, and shorter T2 values result in greater signal loss prior to readout [47]. This decay can alter the observed CEST contrast, potentially leading to biased estimates of glucose uptake, particularly in regions with short T2 values. A schematic is presented in Figure S16 to facilitate understanding of how T2 variations affect both spillover during saturation and signal attenuation during acquisition.
Different CEST acquisition schemes and quantification approaches exhibit varying sensitivity to glucose-induced T2 variations. Previous studies have shown that even when using the same pulse sequence, sequence parameters need to be carefully optimized to minimize the confounding effects of T2 variation [48]. Some advanced CEST techniques, such as on-resonance variable delay multi-pulse (onVDMP), rely on multiple binomial pulses to generate CEST contrast. While this approach enhances sensitivity to exchangeable protons, its signal formation is inherently more susceptible to T2 effects, as the cumulative magnetization buildup and decay are strongly influenced by transverse relaxation throughout the pulse train. Given this heightened T2 sensitivity, glucose-induced T2 variations may, at least in part, account for the unexpectedly elevated signal intensities reported in previous studies using onVDMP-based acquisitions [49-51]. In addition to acquisition schemes, the choice of quantification approach also plays a critical role in determining the sensitivity of glucoCEST measurements to T2 variations. Among the most commonly used methods are the single-offset DGE approach and MTRasym-based quantification, both of which differ in their susceptibility to T2-related confounds. The single-offset DGE method estimates CEST contrast based on signal changes at a single frequency offset, typically near the glucose resonance (e.g., +1.2 ppm). Owing to its single-point sampling, this approach lacks internal mechanisms to separate glucose-specific effects from non-specific background contributions [52]. Consequently, the measured DGE signal reflects a combination of true CEST contrast and T2-dependent spillover, making it particularly vulnerable to T2 variations. In contrast, MTRasym applies an asymmetry analysis by subtracting the signal acquired at the symmetric frequency offset, which substantially eliminates the symmetric spillover contribution [53]. However, the resulting CEST contrast remains modulated by T2-induced changes in background signal intensity. Specifically, variations in T2 alter the amplitude of the background signal, introducing a second-order dependence of MTRasym, a phenomenon referred to as the scaled-down effect [30, 31]. Therefore, despite its ability to suppress symmetric artifacts, MTRasym-based DGE quantification remains sensitive to T2 fluctuations through background-driven modulation.
Glucose-induced T2 variations can affect the sensitivity and specificity of DGE measurements, yet their impact has been largely overlooked in previous studies. To address this issue, we developed two complementary strategies. First, we proposed the use of saturation-weighted PD signals to mitigate the influence of T2 decay during image acquisition. The saturation-weighted PD signal more accurately reflects the saturated magnetization state immediately following the saturation pulse, and is, in theory, more directly related to the intended CEST contrast [22]. The feasibility of using saturation-weighted PD signals to generate Z-spectra and quantify glucoCEST effects is demonstrated in Figure 2. Second, we introduced a T2 mapping-based correction framework for glucoCEST, in which dynamic T2 maps were used to derive correction models for both single-offset DGE and MTRasym-based quantification. As shown in Figures 5 and 6, the proposed correction strategy substantially reduced the correlation between the CEST signal and T2, effectively minimizing T2-related confounds in both single-offset and MTRasym-based DGE quantification. This decoupling allows for a more accurate assessment of glucose uptake independent of relaxation effects.
The single-shot MP-CEST sequence, based on SPEN MRI, allows simultaneous acquisition of CEST contrast, T2, and PD maps within a single scan without extending scan time or increasing protocol complexity. SPEN MRI is an ultrafast imaging technique with acquisition speed comparable to EPI, but offers superior resistance to B0 inhomogeneities [28, 54]. Previous studies have combined SPEN with CEST to improve robustness against B0 inhomogeneities in fast imaging settings [55]. Recent studies, along with our previous work, have demonstrated that the quadratic phase encoding and spatially selective decoding intrinsic to SPEN MRI can be leveraged for ultrafast quantification of both T2 and T2* [26]. Here, SPEN MRI is incorporated into the CEST framework to enable ultrafast, multiparametric imaging within a single acquisition, offering several practical advantages. First, conventional CEST protocols typically require additional T1 and T2 mapping sequences for quantification or correction purposes, which increases total scan time and reduces temporal resolution [56]. This limitation is particularly problematic in DGE imaging, where separate acquisitions may introduce temporal misalignment, potentially leading to bias due to interleaved or non-synchronized parameter estimation. Second, inconsistencies in acquisition sequences and imaging parameters between conventional CEST and T1/T2 mapping can lead to spatial misregistration, which may compromise the accuracy of voxel-wise quantification and reduce the reliability of longitudinal assessments. In contrast, the MP-CEST approach provides inherently co-registered T2, PD, and CEST maps from a single acquisition, ensuring spatial consistency across parameters [57].
Beyond T2 correction, T2 mapping itself provides complementary physiological and anatomical information that enhances the value of glucoCEST imaging. Specifically, dynamic T2 changes can serve as an independent marker of tissue response to glucose administration, reflecting alterations in the relaxation time of water as well as microenvironmental factors such as edema, cellularity, and water content shifts [21]. These T2 variations may indirectly localize glucose uptake, particularly in regions where CEST contrast is weak or ambiguous. In addition, baseline T2 maps offer structural context that aids image interpretation, facilitating the differentiation of tissue types, lesion characterization, and discrimination between necrotic and viable tumor regions [22, 58]. By combining T2 mapping with glucoCEST, the resulting multiparametric framework improves both quantitative robustness and physiological interpretability, enabling a more comprehensive assessment of tissue status.
Beyond its technical advancements, the proposed MP-CEST approach shows great potential for molecular therapy monitoring. By using D-glucose, a clinically approved and metabolically active probe, MP-CEST enables noninvasive assessment of tissue metabolism with improved specificity through correction of T2-related confounding effects. Altered glucose uptake is a key feature of many diseases, including gliomas, neurodegenerative disorders, and immune-responsive tumors [59-61]. In this context, changes in corrected DGE signals may provide early biomarkers of therapeutic response, capturing alterations in glycolytic activity or perfusion before anatomical changes become apparent. Compared to radioactive PET, MP-CEST is more suitable for longitudinal studies, as it avoids ionizing radiation and permits repeated imaging sessions over time [62]. Moreover, the simultaneous acquisition of quantitative T2 maps offers complementary information related to tissue water content, cellularity, and microstructural integrity [63], all of which are relevant to treatment efficacy. These features support the utility of MP-CEST as a valuable imaging technique for tracking molecular-targeted therapies, evaluating metabolic interventions, and assessing drug responses across preclinical studies and potential clinical applications.
While the proposed approach demonstrates significant advantages in glucoCEST quantification, several methodological considerations should be noted. First, although the proposed MP-CEST method enables the simultaneous acquisition of multiple parametric maps within a single shot, the optimization of imaging parameters, particularly the number and timing of echo trains, requires careful consideration. Short echo trains may compromise spatial resolution, introducing partial volume effects that can degrade quantification accuracy. Conversely, longer echo trains improve T2 sensitivity but suffer from lower SNR, especially at extended echo times. Parameter selection should therefore be tailored to the expected T2 range of the target tissue. In future work, spatial resolution may be enhanced using deep learning-based super-resolution techniques [64-66], while the intrinsic redundancy across multi-echo images may be leveraged by advanced denoising strategies to further improve image quality and glucoCEST accuracy [67, 68]. Second, the T2 correction implemented in this study relies on a calibration curve derived from numerical simulations that model the relationship between CEST signal, glucose concentration, and T2 relaxation time under defined experimental assumptions. As the calibration is inherently dependent on parameters such as magnetic field strength, saturation scheme, and tissue properties, its applicability must be adjusted for different acquisition settings. In this work, simulation parameters were selected based on physiologically relevant literature values [69]. However, future implementations may require recalibration to accommodate changes in field strength or tissue type, such as when translating from preclinical to clinical MRI. Careful adaptation of these parameters is essential to maintain the accuracy, robustness, and transferability of the T2 correction strategy across diverse imaging contexts.
Future extensions of this approach may involve integrating glucoCEST with additional imaging contrasts, such as diffusion-weighted imaging, which provides complementary information on perfusion, cellularity, and tissue microstructure [25]. Multiparametric integration has the potential to improve physiological specificity and enable a more comprehensive characterization of metabolic alterations across a range of healthy and pathological conditions. Beyond glucose imaging, the proposed acquisition and correction framework may also be adapted to other CEST techniques, such as CrCEST [66, 70], to monitor phosphocreatine-to-creatine conversion during muscle activity. As exercise-induced metabolic shifts are often accompanied by changes in T2, incorporating dynamic T2 mapping could further enhance the accuracy of CEST signal interpretation in both neurological and neuromuscular applications.
Conclusion
In this study, we introduced a single-shot multiparametric CEST MRI sequence based on SPEN, enabling the concurrent acquisition of CEST contrast, T2, and proton density maps within a single scan. This framework incorporates two complementary correction strategies designed to mitigate T2-related confounds affecting both the saturation and acquisition phases. Validation in phantom and in vivo models demonstrated improved DGE quantification and enhanced correspondence between corrected signals and glucose concentration dynamics. These findings establish a robust and generalizable framework for glucoCEST imaging, supporting a more specific assessment of in vivo glucose uptake by separating T2 effects from DGE contrast.
Abbreviations
CEST: chemical exchange saturation transfer; DGE: dynamic glucose-enhanced; SPEN: spatiotemporal encoding; PD: proton density; FDG-PET: [18F]-fluorodeoxyglucose positron emission tomography; MRS: magnetic resonance spectroscopy; glucoCEST: glucose CEST; MP-CEST: multiparametric CEST; PBS: phosphate-buffered saline; PRESS: point-resolved spectroscopy; OVS: outer volume suppression; VAPOR: variable power RF pulses and optimized relaxation delays; ROI: region of interest.
Supplementary Material
Supplementary methods and figures.
Acknowledgements
This work is supported by the National Natural Science Foundation of China, Grant/Award Number: 82302151; Shenzhen Science and Technology Program, Grant/Award Number: JCYJ20220818101213029; Fujian Province Science and Technology Project, Grant/Award Number: 2022J05013; Xiamen University Nanqiang Outstanding Talents Program.
Competing Interests
The authors have declared that no competing interest exists.
References
1. Walker-Samuel S, Ramasawmy R, Torrealdea F, Rega M, Rajkumar V, Johnson SP. et al. In vivo imaging of glucose uptake and metabolism in tumors. Nat Med. 2013;19:1067-72
2. Hay N. Reprogramming glucose metabolism in cancer: can it be exploited for cancer therapy? Nat Rev Cancer. 2016;16:635-49
3. Fu LH, Qi C, Hu YR, Lin J, Huang P. Glucose Oxidase-Instructed Multimodal Synergistic Cancer Therapy. Adv Mater. 2019;31:e1808325
4. Geijselaers SLC, Sep SJS, Stehouwer CDA, Biessels GJ. Glucose regulation, cognition, and brain MRI in type 2 diabetes: a systematic review. Lancet Diabetes Endo. 2015;3:75-89
5. Saha T, Del Caño R, Mahato K, De la Paz E, Chen CR, Ding SC. et al. Wearable Electrochemical Glucose Sensors in Diabetes Management: A Comprehensive Review. Chem Rev. 2023;123:7854-89
6. Dubois B, Feldman HH, Jacova C, Hampel H, Molinuevo JL, Blennow K. et al. Advancing research diagnostic criteria for Alzheimer's disease: the IWG-2 criteria. Lancet Neurol. 2014;13:614-29
7. Huang J, van Zijl PCM, Han X, Dong CM, Cheng GWY, Tse K-H. et al. Altered d-glucose in brain parenchyma and cerebrospinal fluid of early Alzheimer's disease detected by dynamic glucose-enhanced MRI. Sci Adv. 2020;6:eaba3884-eaba
8. de la Paz E, Maganti NH, Trifonov A, Jeerapan I, Mahato K, Yin L. et al. A self-powered ingestible wireless biosensing system for real-time in situ monitoring of gastrointestinal tract metabolites. Nat Commun. 2022;13:7405
9. Shen XT, Kellogg R, Panyard DJ, Bararpour N, Castillo KE, Lee-McMullen B. et al. Multi-omics microsampling for the profiling of lifestyle-associated changes in health. Nat Biomed Eng. 2024;8:11-29
10. Galant AL, Kaufman RC, Wilson JD. Glucose: Detection and analysis. Food Chem. 2015;188:149-60
11. Nordberg A, Rinne JO, Kadir A, Långström B. The use of PET in Alzheimer disease. Nat Rev Neurol. 2010;6:78-87
12. Phelps ME, Mazziotta JC, Huang SC. Study of cerebral function with positron computed tomography. J Cereb Blood Flow Metab. 1982;2:113-62
13. Vanzijl PCM, Chesnick AS, Despres D, Moonen CTW, Ruizcabello J, Vangelderen P. In vivo proton spectroscopy and spectroscopic imaging of [1-13C]-glucose and its metabolic products. Magn Reson Med. 1993;30:544-51
14. de Graaf RA, Mason GF, Patel AB, Behar KL, Rothman DL. In vivo 1H-[13C]-NMR spectroscopy of cerebral metabolism. NMR Biomed. 2003;16:339-57
15. Rich LJ, Bagga P, Wilson NE, Schnall MD, Detre JA, Haris M. et al. 1H magnetic resonance spectroscopy of 2H-to-1H exchange quantifies the dynamics of cellular metabolism in vivo. Nat Biomed Eng. 2020;4:335-42
16. De Feyter HM, Behar KL, Corbin ZA, Fulbright RK, Brown PB, McIntyre S. et al. Deuterium metabolic imaging (DMI) for MRI-based 3D mapping of metabolism in vivo. Sci Adv. 2018;4:eaat7314
17. Chan KWY, McMahon MT, Kato Y, Liu G, Bulte JWM, Bhujwalla ZM. et al. Natural D-glucose as a biodegradable MRI contrast agent for detecting cancer. Magn Reson Med. 2012;68:1764-73
18. Chen L, van Zijl PCM, Wei ZL, Lu HZ, Duan WZ, Wong PC. et al. Early detection of Alzheimer's disease using creatine chemical exchange saturation transfer magnetic resonance imaging. Neuroimage. 2021;236:118071
19. Xu X, Chan KWY, Knutsson L, Artemov D, Xu J, Liu G. et al. Dynamic Glucose Enhanced (DGE) MRI for Combined Imaging of Blood-Brain Barrier Break Down and Increased Blood Volume in Brain Cancer. Magn Reson Med. 2015;74:1556-63
20. Eleftheriou A, Ravotto L, Wyss MT, Warnock G, Siebert A, Zaiss M. et al. Simultaneous dynamic glucose-enhanced (DGE) MRI and fiber photometry measurements of glucose in the healthy mouse brain. Neuroimage. 2023;265:119762
21. Yadav NN, Xu JD, Bar-Shir A, Qin Q, Chan KWY, Grgac K. et al. Natural D-glucose as a biodegradable MRI relaxation agent. Magn Reson Med. 2014;72:823-8
22. Zaiss M, Bachert P. Chemical exchange saturation transfer (CEST) and MR Z-spectroscopy in vivo: a review of theoretical approaches and methods. Phys Med Biol. 2013;58:R221-R69
23. Sun PZ, van Zijl PCM, Zhou JY. Optimization of the irradiation power in chemical exchange dependent saturation transfer experiments. J Magn Reson. 2005;175:193-200
24. Zaiss M, Ehses P, Scheffler K. Snapshot-CEST: Optimizing spiral-centric-reordered gradient echo acquisition for fast and robust 3D CEST MRI at 9.4T. NMR Biomed. 2018;31:e3879
25. Bao QJ, Ma LC, Liberman G, Solomon E, Martinho RP, Frydman L. Dynamic T2 mapping by multi-spin-echo spatiotemporal encoding. Magn Reson Med. 2020;84:895-907
26. Jin JX, Zhou Y, Chen L, Chen Z. Ultrafast T2 and T2* mapping using single-shot spatiotemporally encoded MRI with reduced field of view and spiral out-in-out-in trajectory. Med Phys. 2024;51:7308-19
27. Chen L, Bao LJ, Li J, Cai SH, Cai CB, Chen Z. An aliasing artifacts reducing approach with random undersampling for spatiotemporally encoded single-shot MRI. J Magn Reson. 2013;237:115-24
28. Chen L, Li J, Zhang M, Cai SH, Zhang T, Cai CB. et al. Super-resolved enhancing and edge deghosting (SEED) for spatiotemporally encoded single-shot MRI. Med Image Anal. 2015;23:1-14
29. Chen L, Huang JP, Zhang T, Li J, Cai CB, Cai SH. Variable density sampling and non-Cartesian super-resolved reconstruction for spatiotemporally encoded single-shot MRI. J Magn Reson. 2016;272:1-9
30. Chen L, Wei Z, Cai S, Li Y, Liu G, Lu H. et al. High-resolution creatine mapping of mouse brain at 11.7 T using non-steady-state chemical exchange saturation transfer. NMR Biomed. 2019;32:e4168
31. Chen L, Zeng HF, Xu X, Yadav NN, Cai SH, Puts NA. et al. Investigation of the contribution of total creatine to the CEST Z-spectrum of brain using a knockout mouse model. NMR Biomed. 2017;30:e3834
32. Jin T, Autio J, Obata T, Kim SG. Spin-locking versus chemical exchange saturation transfer MRI for investigating chemical exchange process between water and labile metabolite protons. Magn Reson Med. 2011;65:1448-60
33. Zaiss M, Bachert P. Exchange-dependent relaxation in the rotating frame for slow and intermediate exchange - modeling off-resonant spin-lock and chemical exchange saturation transfer. NMR Biomed. 2013;26:507-18
34. Zaiss M, Zu Z, Xu J, Schuenke P, Gochberg DF, Gore JC. et al. A combined analytical solution for chemical exchange saturation transfer and semi-solid magnetization transfer. NMR Biomed. 2015;28:217-30
35. Faller TL, Trotier AJ, Rousseau AF, Franconi JM, Miraux S, Ribot EJ. 2D multislice MP2RAGE sequence for fast T1 mapping at 7 T: Application to mouse imaging and MR thermometry. Magn Reson Med. 2020;84:1430-40
36. Zaiss M, Anemone A, Goerke S, Longo DL, Herz K, Pohmann R. et al. Quantification of hydroxyl exchange of D-Glucose at physiological conditions for optimization of glucoCEST MRI at 3, 7 and 9.4 Tesla. NMR Biomed. 2019;32:e4113
37. Thorsen F, Fite B, Mahakian LM, Seo JW, Qin SP, Harrison V. et al. Multimodal imaging enables early detection and characterization of changes in tumor permeability of brain metastases. J Control Release. 2013;172:812-22
38. Stanisz GJ, Odrobina EE, Pun J, Escaravage M, Graham SJ, Bronskill MJ. et al. T1, T2 relaxation and magnetization transfer in tissue at 3T. Magn Reson Med. 2005;54:507-12
39. Tkác I, Starcuk Z, Choi IY, Gruetter R. In vivo 1H NMR spectroscopy of rat brain at 1 ms echo time. Magn Reson Med. 1999;41:649-56
40. Myronenko A, Song XB. Intensity-based image registration by minimizing residual complexity. IEEE Trans Med Imaging. 2010;29:1882-91
41. Ma D, Cardoso MJ, Modat M, Powell N, Wells J, Holmes H. et al. Automatic structural parcellation of mouse brain MRI using multi-atlas label fusion. PLoS One. 2014;9:e86576
42. Provencher SW. Automatic quantitation of localized in vivo 1H spectra with LCModel. NMR Biomed. 2001;14:260-4
43. Gore JC, Brown MS, Mizumoto CT, Armitage IM. Influence of glycogen on water proton relaxation times. Magn Reson Med. 1986;3:463-6
44. Kim J, Wu Y, Guo Y, Zheng H, Sun PZ. A review of optimization and quantification techniques for chemical exchange saturation transfer MRI toward sensitive in vivo imaging. Contrast Media Mol Imaging. 2015;10:163-78
45. Sun PZ. Simplified quantification of labile proton concentration-weighted chemical exchange rate (k(ws) ) with RF saturation time dependent ratiometric analysis (QUESTRA): normalization of relaxation and RF irradiation spillover effects for improved quantitative chemical exchange saturation transfer (CEST) MRI. Magn Reson Med. 2012;67:936-42
46. Knutsson L, Yadav NN, Ali SM, Kamson DO, Demetriou E, Seidemo A. et al. Dynamic glucose enhanced imaging using direct water saturation. Magn Reson Med. 2025;94:15-27
47. Sun PZ, Wang Y, Lu J. Sensitivity-enhanced chemical exchange saturation transfer (CEST) MRI with least squares optimization of Carr Purcell Meiboom Gill multi-echo echo planar imaging. Contrast Media Mol Imaging. 2014;9:177-81
48. Zaiss M, Ehses P, Scheffler K. Snapshot-CEST: Optimizing spiral-centric-reordered gradient echo acquisition for fast and robust 3D CEST MRI at 9.4 T. NMR Biomed. 2018;31:e3879
49. Chen L, Wei Z, Chan KWY, Li Y, Suchal K, Bi S. et al. D-Glucose uptake and clearance in the tauopathy Alzheimer's disease mouse brain detected by on-resonance variable delay multiple pulse MRI. J Cereb Blood Flow Metab. 2021;41:1013-25
50. Xu X, Xu J, Chan KWY, Liu J, Liu H, Li Y. et al. GlucoCEST imaging with on-resonance variable delay multiple pulse (onVDMP) MRI. Magn Reson Med. 2019;81:47-56
51. Chen L, Xu X, Zeng H, Chan KWY, Yadav N, Cai S. et al. Separating fast and slow exchange transfer and magnetization transfer using off-resonance variable-delay multiple-pulse (VDMP) MRI. Magn Reson Med. 2018;80:1568-76
52. Knutsson L, Xu X, van Zijl PCM, Chan KWY. Imaging of sugar-based contrast agents using their hydroxyl proton exchange properties. NMR Biomed. 2023;36:e4784
53. Zhou J, van Zijl PCM. Chemical exchange saturation transfer imaging and spectroscopy. Prog Nucl Mag Res Sp. 2006;48:109-36
54. Chen XR, Wang W, Huang JP, Wu J, Chen L, Cai CB. et al. Ultrafast water-fat separation using deep learning-based single-shot MRI. Magn Reson Med. 2022;87:2811-25
55. Huang J, Zhang M, Lu J, Cai C, Chen L, Cai S. A fast chemical exchange saturation transfer imaging scheme based on single-shot spatiotemporal encoding. Magn Reson Med. 2017;77:1786-96
56. van Zijl PCM, Yadav NN. Chemical Exchange Saturation Transfer (CEST): What is in a Name and What Isn't? Magn Reson Med. 2011;65:927-48
57. Grashei M, Wodtke P, Skinner JG, Sühnel S, Setzer N, Metzler T. et al. Simultaneous magnetic resonance imaging of pH, perfusion and renal filtration using hyperpolarized 13C-labelled Z-OMPD. Nat Commun. 2023;14:5060
58. Khodanovich MY, Kisel AA, Akulov AE, Atochin DN, Kudabaeva MS, Glazacheva VY. et al. Quantitative assessment of demyelination in ischemic stroke in vivo using macromolecular proton fraction mapping. J Cereb Blood Flow Metab. 2018;38:919-31
59. Venneti S, Dunphy MP, Zhang HW, Pitter KL, Zanzonico P, Campos C. et al. Glutamine-based PET imaging facilitates enhanced metabolic evaluation of gliomas in vivo. Sci Transl Med. 2015;7:274ra17
60. Butterfield DA, Halliwell B. Oxidative stress, dysfunctional glucose metabolism and Alzheimer disease. Nat Rev Neurosci. 2019;20:148-60
61. Lu Y, Li YY, Liu Q, Tian N, Du P, Zhu FM. et al. MondoA-Thioredoxin-Interacting Protein Axis Maintains Regulatory T-Cell Identity and Function in Colorectal Cancer Microenvironment. Gastroenterology. 2021;161:575-91
62. Liu G, Banerjee SR, Yang X, Yadav N, Lisok A, Jablonska A. et al. A dextran-based probe for the targeted magnetic resonance imaging of tumours expressing prostate-specific membrane antigen. Nat Biomed Eng. 2017;1:977-82
63. Hattingen E, Jurcoane A, Daneshvar K, Pilatus U, Mittelbronn M, Steinbach JP. et al. Quantitative T2 mapping of recurrent glioblastoma under bevacizumab improves monitoring for non-enhancing tumor progression and predicts overall survival. Neuro Oncol. 2013;15:1395-404
64. Yang Z, Shen D, Chan KWY, Huang J. Attention-Based MultiOffset Deep Learning Reconstruction of Chemical Exchange Saturation Transfer (AMO-CEST) MRI. IEEE J Biomed Health Inform. 2024;28:4636-47
65. Chen L, Xu HP, Gong T, Jin JX, Lin LJ, Zhou Y. et al. Accelerating multipool CEST MRI of Parkinson's disease using deep learning-based Z-spectral compressed sensing. Magn Reson Med. 2024;92:2616-30
66. Chen L, Schar M, Chan KWY, Huang J, Wei Z, Lu H. et al. In vivo imaging of phosphocreatine with artificial neural networks. Nat Commun. 2020;11:1072
67. Chen XR, Wu J, Yang Y, Chen H, Zhou Y, Lin LJ. et al. Boosting quantification accuracy of chemical exchange saturation transfer MRI with a spatial-spectral redundancy-based denoising method. NMR Biomed. 2023;37:e5027
68. Chen H, Chen X, Lin L, Cai S, Cai C, Chen Z. et al. Learned spatiotemporal correlation priors for CEST image denoising using incorporated global-spectral convolution neural network. Magn Reson Med. 2023;90:2071-88
69. Harris RJ, Cloughesy TF, Liau LM, Nghiemphu PL, Lai A, Pope WB. et al. Simulation, phantom validation, and clinical evaluation of fast pH-weighted molecular imaging using amine chemical exchange saturation transfer echo planar imaging (CEST-EPI) in glioma at 3T. NMR Biomed. 2016;29:1563-76
70. Chen L, Cao S, Koehler RC, van Zijl PCM, Xu J. High-sensitivity CEST mapping using a spatiotemporal correlation-enhanced method. Magn Reson Med. 2020;84:3342-50
Author contact
![]() Corresponding authors: Lin Chen, Xiamen University, Xiamen, China, E-mail: chenlin21edu.cn. Zhong Chen, Xiamen University, Xiamen, China, E-mail: chenzedu.cn.
Corresponding authors: Lin Chen, Xiamen University, Xiamen, China, E-mail: chenlin21edu.cn. Zhong Chen, Xiamen University, Xiamen, China, E-mail: chenzedu.cn.