Impact Factor




Theranostics 2027; 17(1):83-98. doi:10.7150/thno.139927 This issue Cite
Research Paper
A conserved glycolytic malignant subcluster drives invasive progression through a PPIA-BSG metabolic-immune interaction in early lung adenocarcinoma
Liuqing Yang1†, Fang Yang2†, Chenghao Mei1, Wenwen Li1, Lin Liu1, Jinhua Fan1, Xiang Li2, Runxiang Yang2, Lianhua Ye3  , Yupeng Cun1
1. Pediatric Research Institute, Chongqing Key Laboratory of Child Neurodevelopment and Cognitive Disorders, Ministry of Education Key Laboratory of Child Development and Disorders, National Clinical Research Center for Children and Adolescents' Health and Diseases, Children’s Hospital of Chongqing Medical University, Chongqing, 400014, China.
2. Department of the Second Medical Oncology, The Third Affiliated Hospital of Kunming Medical University, Kunming, Yunnan 650118, China.
3. Department of Thoracic Surgery I, Third Affiliated Hospital of Kunming Medical University, Yunnan Cancer Hospital, Kunming 650106, China.
† Liuqing Yang and Fang Yang contributed equally to this work.
Received 2026-6-26; Accepted 2026-9-29; Published 2027-1-1
Abstract
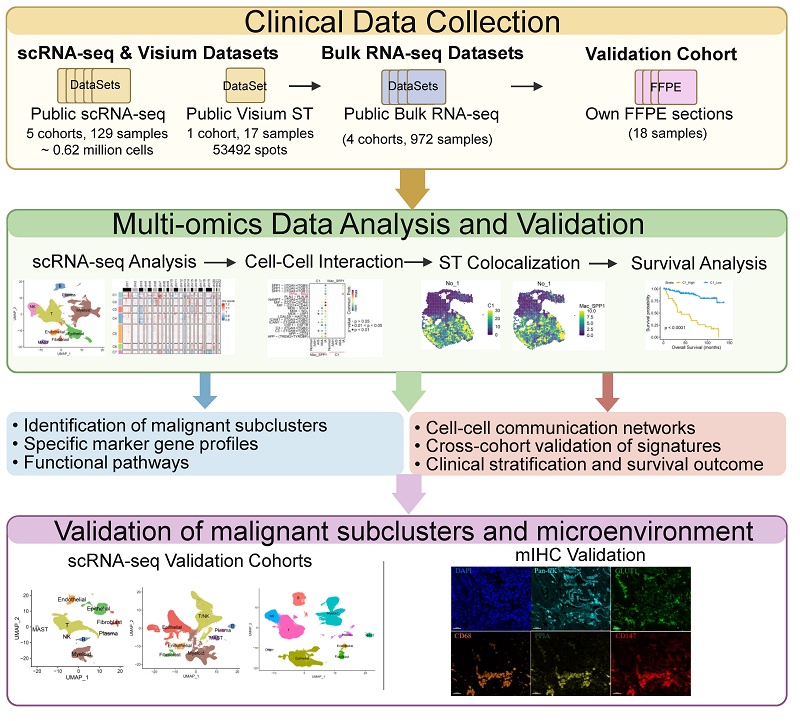
Background: Ground-glass nodules (GGNs) frequently represent early-stage lung adenocarcinoma (LUAD), but current histopathological and radiological modalities cannot reliably distinguish indolent precursor lesions from those likely to progress to invasive tumors. Robust cell-subcluster-specific biomarkers are therefore needed to improve risk stratification at this early stage of disease.
Methods: To define the malignant epithelial subcluster associated with invasive progression, four single-cell RNA sequencing (scRNA-seq) datasets and one spatial transcriptomic dataset were integrated, yielding 621,778 cells and 53,492 spatial spots from precursor lesions, invasive tumors, metastatic lung cancers, and multiple primary LUADs.
Results: Across independent datasets, C1 emerged as a conserved malignant epithelial subcluster marked by pronounced proliferative activity and enhanced glycolytic metabolism. Its representation increased sharply with tumor progression, from relative scarcity in preinvasive lesions to prominent enrichment in invasive adenocarcinoma and further expansion in metastatic LUAD. C1 also exhibited subcluster-dependent crosstalk with immunosuppressive SPP1+ macrophages through the PPIA-BSG axis. This interaction was selectively enriched in invasive tumors and was independently confirmed by spatial transcriptomics and multiplex immunohistochemistry. Notably, spatial proximity between C1 cells and SPP1+ macrophages was likewise concentrated in invasive adenocarcinoma, suggesting that this metabolic-immune interaction may be associated with progression toward invasive disease.
Conclusions: These findings define a conserved glycolytic malignant epithelial subcluster whose abundance may improve recurrence risk stratification in early-stage disease. PPIA-BSG-mediated communication between C1 cells and SPP1+ macrophages further identifies a metabolic-immune interaction associated with invasive progression at the GGN stage.
Keywords: lung adenocarcinoma, malignant progression, tumor microenvironment, glycolytic metabolism, PPIA-BSG interaction
Introduction
Lung cancer remains a leading cause of cancer-related mortality worldwide. Ground-glass nodules (GGNs) are a common radiological presentation of early lung adenocarcinoma histological subtype of lung cancer [1,2]. Despite their similar imaging appearance, GGNs encompass lesions with markedly different biological behavior, ranging from atypical adenomatous hyperplasia (AAH) and adenocarcinoma in situ (AIS) to minimally invasive adenocarcinoma (MIA) and invasive adenocarcinoma (IA) [3]. Preinvasive lesions are associated with excellent outcomes after surgical resection, whereas prognosis declines substantially after invasion develops [4,5]. A central challenge in early LUAD is therefore to distinguish indolent GGNs from lesions already acquiring features associated with invasive progression. Molecular markers that capture this transition could improve risk stratification and support more appropriate selection between surveillance or early intervention [3,4].
Single-cell RNA sequencing (scRNA-seq) has substantially advanced understanding of the cellular architecture and immune landscape of LUAD across disease stages and has implicated distal alveolar epithelial lineages in malignant transformation [4-12]. Studies of GGNs have further revealed prominent immune alterations, including accumulation of regulatory T cells and immunosuppressive SPP1+ macrophages [10,13]. However, malignant epithelial compartments have often been considered collectively, potentially obscuring discrete cell subclusters associated with invasive behavior [10]. This limitation is particularly important in the context of metabolic reprogramming. Aerobic glycolysis and related metabolic adaptations emerge early during carcinogenesis, but their distribution among individual malignant epithelial subclusters and their relationship to invasive progression remain poorly resolved [9,14-16]. Consequently, the epithelial subclusters associated with basement-membrane invasion, and the interactions between metabolically distinct malignant cells and the surrounding tumor microenvironment, remain incompletely defined. Resolving this heterogeneity at single-cell and spatial resolution is therefore important for identifying biological features that distinguish low-risk precursor lesions from GGNs associated with invasive progression.
To resolve the malignant epithelial subclusters associated with early LUAD progression, scRNA-seq and spatial transcriptomic datasets encompassing precursor lesions, invasive tumors, metastatic lung cancer, and multiple primary LUADs were analyzed jointly. Multi-stage comparisons were used to define epithelial subclusters associated with invasion, their metabolic programs, and their cell-cell communication with macrophage populations during the transition from precursor lesions to IA. This approach identified a distinct malignant epithelial subcluster that became progressively enriched with invasive progression and showed preferential PPIA-BSG-mediated communication with immunosuppressive SPP1+ macrophages, identifying a candidate metabolic-immune interaction associated with invasive progression in LUAD.
Results
Single-cell transcriptomics identifies a malignant epithelial subcluster enriched in IA
Five independent datasets were assembled to define cellular heterogeneity across LUAD and precursor lesions, comprising four scRNA-seq datasets and one spatial transcriptomic dataset. Together, these datasets encompassed 621,778 cells from 129 samples and 53,492 spots from 17 samples (Figure 1A and Table S1). To avoid conflating biological variation with differences in experimental design, the two GGN datasets were analyzed independently of the remaining three datasets. Following quality control and data processing, 267,885 high-quality cells from the GGN datasets were retained and assigned to nine major cell types (Figure 1B, S1A–B, and Table S2). The cellular landscape of GGNs was dominated by epithelial, T-cell, and myeloid cells (Figure S1C). Although cellular composition varied markedly among samples, progression to invasive tumor was consistently accompanied by lower T-cell representation and higher proportions of myeloid and epithelial cells, suggesting progressive remodeling of the tumor microenvironment toward an immunosuppressive subcluster.
Single-cell transcriptomic characterization of ground-glass nodules and identification of invasive disease-associated malignant epithelial subclusters. A, Summary of sample characteristics across the five datasets. B, UMAP representation of single cells from dataset 4. C, Copy number variation profiles of malignant epithelial cells with hierarchical clustering. D, Bar plot showing relative proportions of identified malignant epithelial subclusters across pathological groups. E, Forest plot showing multivariable Cox regression results for the discovery cohort from Zhang et al [19]. Statistical significance: *P < 0.05; **P < 0.01; ***P < 0.001. F, Kaplan-Meier curves for overall survival (OS) and recurrence-free survival (RFS). Left (OS) and middle (RFS) panels show data derived from the Zhang et al [19] cohort, while the right panel (OS) shows data obtained from the TCGA-LUAD cohort.
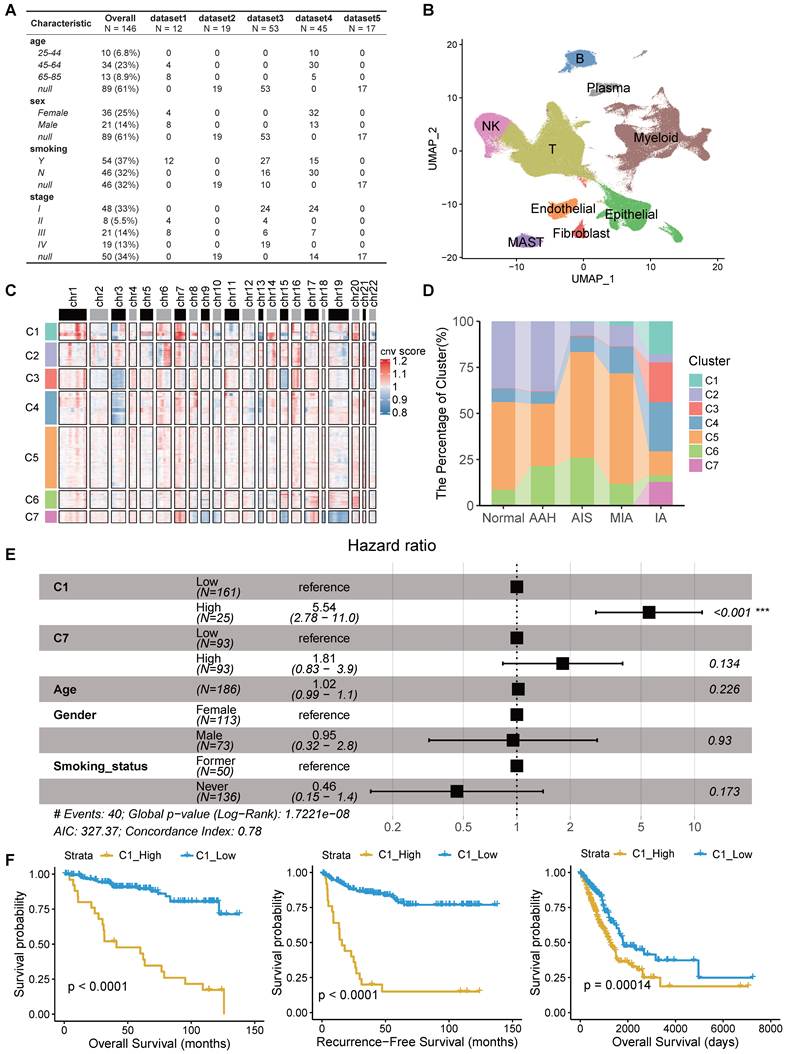
Malignant epithelial cells were identified by inferCNV analysis [17] and subsequently resolved into seven transcriptionally distinct subclusters (Figure 1C, S1D–E). Among these populations, C1, C3, and C7 were strongly enriched in the IA stage (Figure 1D). To determine whether these IA-associated subclusters carried prognostic information, the relative abundances of C1, C3, and C7 were inferred in two bulk RNA-seq cohorts [18,19] using CIBERSORT deconvolution [20]. After adjustment for age, sex, and smoking status, multivariate Cox regression analysis identified high C1 abundance as an independent adverse prognostic factor (Figure 1E). This association was reproduced in the TCGA-LUAD cohort (Figure S1F, S2A). Consistent with these findings, patients with high C1 abundance had shorter overall survival (OS) and recurrence-free survival (RFS), with comparable hazard ratios observed across the bulk transcriptomic cohorts (Figure 1F and Table S3).
Additional analyses were performed to exclude technical or biological confounding factors as an explanation for the C1 phenotype. C1 cells were represented across all cell-cycle phases, showed mitochondrial transcript proportions comparable to those of other malignant epithelial subclusters, and were consistently detected across individual samples (Figure S2B–D). These analyses indicate that the C1 subcluster is unlikely to have resulted from cell-cycle variation, dissociation-related bias, or sample-specific batch effects.
Together, these results identify C1 as a reproducible malignant epithelial subcluster preferentially associated with tumor invasion and adverse clinical outcomes, supporting its potential utility for stratifying biologically aggressive early-stage LUAD.
Malignant epithelial subcluster C1 exhibits a highly proliferative and glycolysis-enriched phenotype
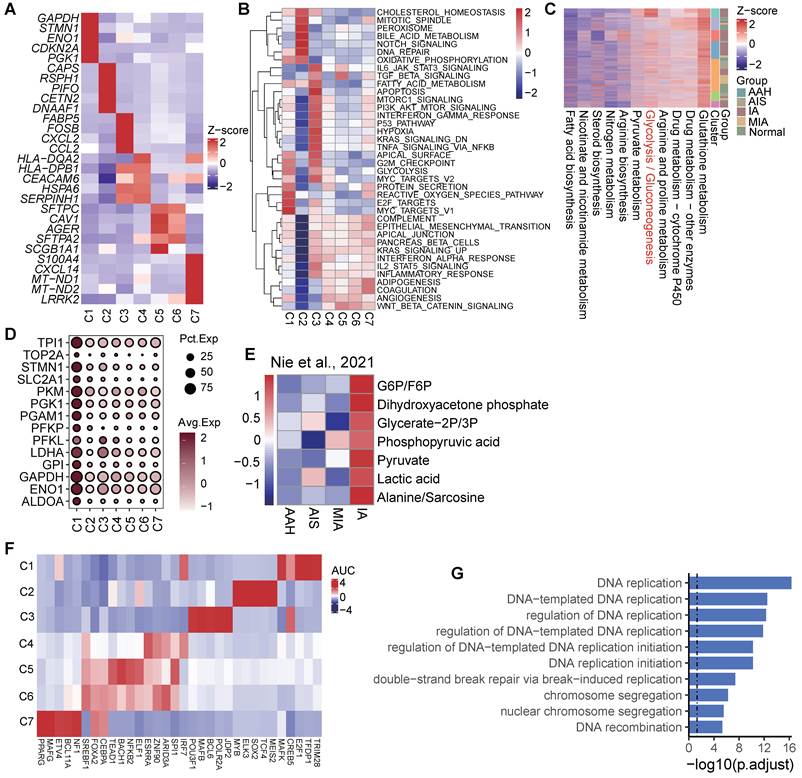
Transcriptomic profiling distinguished C1 from other malignant epithelial subclusters by coordinated expression of genes associated with proliferation and metabolic reprogramming, including GAPDH, STMN1, CDKN2A, PGK1, TMSB10, TXN, IFI27, MARCKSL1, CLDN3, and ENO1 (Figure 2A and Table S4). Consistent with this expression pattern, Gene Ontology (GO) and Kyoto Encyclopedia of Genes and Genomes (KEGG) enrichment analyses showed prominent enrichment of pathways involved in mitosis and cellular metabolism (Figure S2E–F and Table S5). Metabolic pathway activity was further examined using HALLMARK gene-set scoring and scMetabolism [21], both of which identified glycolytic activity as a defining metabolic feature of this subcluster (Figure 2B–C and Table S6), accompanied by increased expression of key glycolytic enzymes, including PFKL, GPI, and PGK1 (Figure 2D). These findings are consistent with recent metabolic evidence showing significant accumulation of glycolysis-related metabolites during progression from early-stage lesions to IA [15] (Figure 2E).
Malignant epithelial subcluster C1 exhibits coordinated proliferative and glycolytic programs associated with LUAD progression. A, Heatmap showing the five most highly expressed subcluster-specific genes for each malignant epithelial subcluster. B, Heatmap of Hallmark gene-set scores across malignant epithelial subclusters. C, Dot plot showing expression of glycolysis- and proliferation-related genes across subclusters. D, Heatmap of metabolic gene-set scores across subclusters. E, Dot plot showing glycolysis-related metabolites across pathological groups in the metabolomics dataset. F, Heatmap showing the five transcription factors with the highest inferred activity in each subcluster. G, Bar plot showing significantly enriched GO terms for target genes associated with transcription factors identified in C1. Black dashed line indicates an adjusted P value of 0.05.
Copy-number profiles inferred by inferCNV were then used to examine evolutionary relationships among malignant epithelial subclusters from multiple lesions within individual patients. Phylogenetic reconstruction revealed branched evolutionary trajectories, with C1 occupying relatively late positions along the inferred lineages (Figure S3), consistent with emergence during tumor progression and an association with more advanced malignant subclusters and greater invasive potential.
Transcription factor enrichment analysis was performed to identify regulatory programs associated with the C1 phenotype. E2F1, a key regulator of the G1/S-phase transition, showed the strongest predicted regulatory association with C1 (Figure 2F), while the broader set of enriched transcription factors mapped predominantly to cell-cycle checkpoint control and DNA replication (Figure 2G). Multiplex immunohistochemistry (mIHC) provided orthogonal validation of the C1 subcluster in tissue, demonstrating spatial colocalization of representative C1 markers at the protein level (Figure 3A–C, S4A–B, and Table S7). Quantitative image analysis further revealed a marked increase in C1 abundance in IA relative to AIS, providing histological support for expansion of this malignant epithelial subcluster during invasive progression.
Multiplex immunohistochemical validation of the C1 phenotype in lung adenocarcinoma. A, Representative multiplex immunohistochemistry images of lung tumor tissue showing the indicated markers, including nuclear staining (DAPI), epithelial markers (PanCK and EPCAM), proliferation marker Ki67, and glycolysis-related protein GLUT1. B, Representative images highlighting epithelial cells co-expressing Ki67 and GLUT1, together with merged fluorescence channels. C, Quantitative analysis of the C1-associated phenotype. Box plots show proportion of Ki67⁺GLUT1⁺ epithelial cells in AIS and IA samples. Scatter plots show relationship between GLUT1 and Ki67 expression (z-scores) in IA (left) and AIS (right) samples. Spearman correlation coefficients are shown in each panel. Data are presented as box-and-whisker plots, with statistical significance indicated.
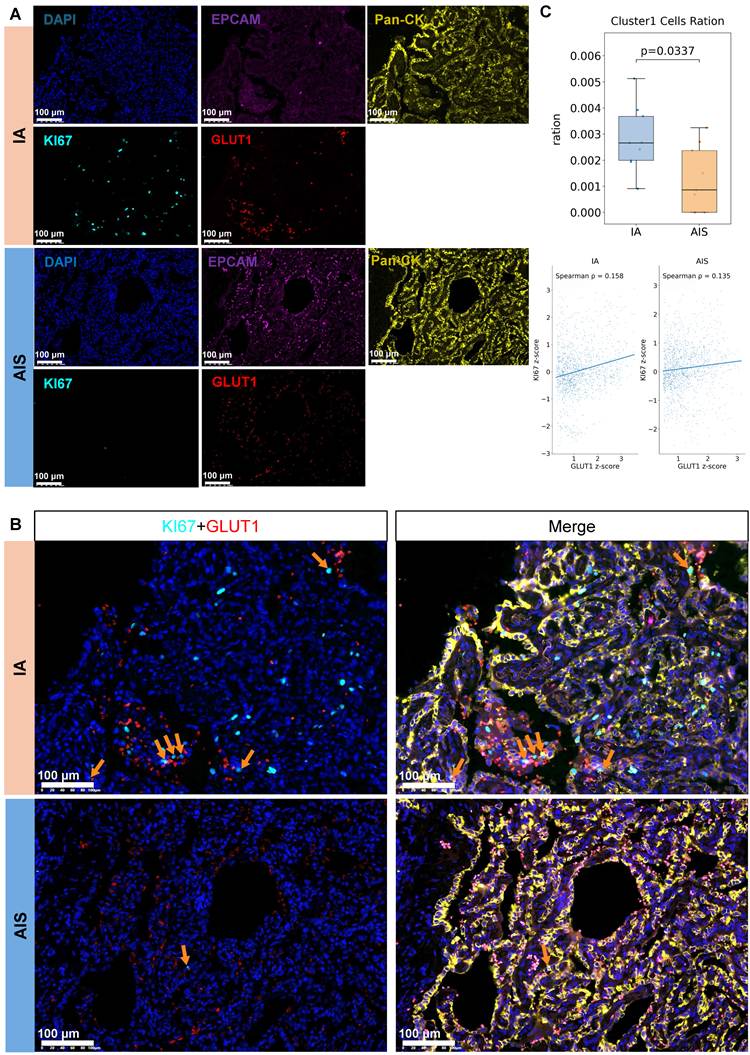
Collectively, these analyses define C1 as a proliferative, glycolysis-enriched malignant epithelial subcluster that becomes increasingly prominent during LUAD progression and is associated with adverse clinical outcomes.
Cell-cell communication analysis implicates PPIA-BSG signaling between C1 cells and SPP1+ macrophages
Cell-cell communication analysis revealed extensive remodeling of interactions between C1 and immune populations during progression to IA, with the strongest changes involving myeloid and T-cell compartments (Figure S5A). Re-clustering of these populations showed divergent shifts in immune composition. Although total macrophage abundance declined with disease progression, the SPP1+ macrophage population increased progressively (Figure 4A, S5B–F). In parallel, cytotoxic CD8 T cells became progressively less abundant, consistent with increasing immunosuppression in the tumor microenvironment. SPP1+ macrophages have previously been associated with immunosuppressive tumor subclusters and unfavorable outcomes in lung cancer [22,23]. In the present datasets, communication between C1 and SPP1+ macrophages was particularly prominent in the IA stage (Figure 4B, S6A). Signaling through several ligand-receptor pairs implicated in tumor progression, including MIF-CD74 and APP-CD74 [24-26], increased along the pathological progression axis (Figure 4C and Table S8). Notably, PPIA-BSG signaling was detected specifically at the IA stage and showed comparatively strong predicted interaction strength.
Cell-cell communication between malignant epithelial subclusters and myeloid populations. A, UMAP representation of myeloid cell subtypes. B, Circos plot showing cell-cell communication between malignant epithelial and myeloid subtypes, with line thickness indicating interaction strength. C, Dot plot showing ligand-receptor interactions between C1 and Mac_SPP1, with either population designated as the signaling source. Dot color indicates interaction strength, and dot size represents the P value. D, Bar plot showing the proportions of PPIA⁺BSG⁺ and PPIA⁻BSG⁻ cells across malignant epithelial subtypes and pathological groups. E, Heatmap of gene-set scores. F, Heatmap showing correlations between BSG expression in Mac_SPP1 and M2 macrophage markers. Correlations were assessed using Spearman analysis, and asterisks indicate statistical significance. G, Spatial transcriptomic maps from two representative IA samples showing the distribution of the C1 score, PPIA expression, Mac_SPP1 score, and BSG expression. Color scales indicate the corresponding module score or expression level.
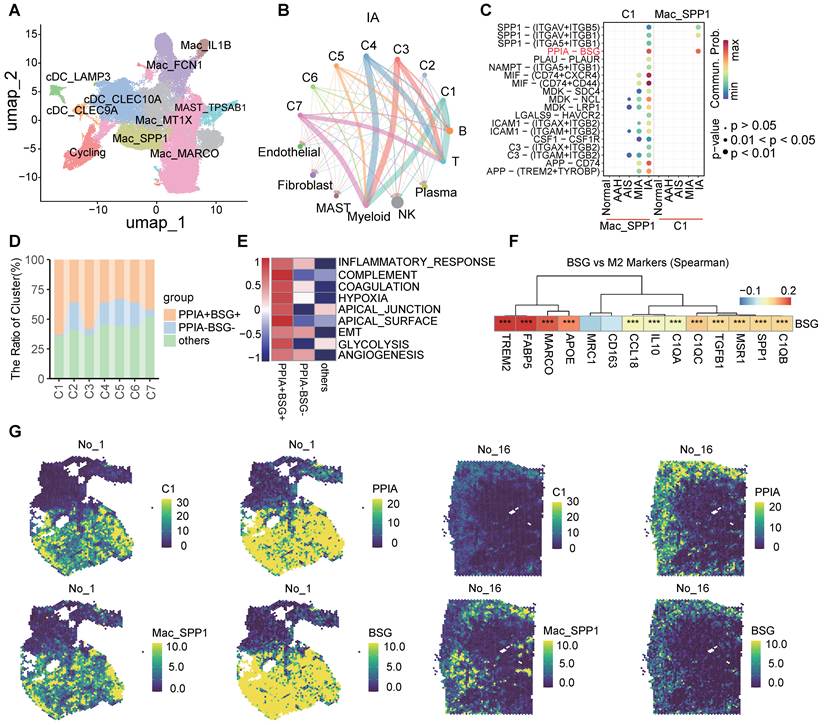
BSG (CD147) is a transmembrane glycoprotein involved in immune regulation and tumor progression, and elevated expression has been associated with tumor invasion and poor prognosis [27,28]. Clinically, BSG positivity has also been linked to higher pathological grade and lymph node metastasis [29]. Within C1, PPIA was highly expressed, while BSG was also detected, with a substantial fraction of cells co-expressing both genes (Figure 4D, S6B). PPIA+BSG+ cells were also characterized by stronger hypoxia and glycolytic signatures, together with a higher epithelial-mesenchymal transition (EMT) score, although the difference in EMT did not reach statistical significance (Figure 4E, S6C).
The relationship between BSG expression and the immunoregulatory phenotype of SPP1+ macrophages was further assessed by correlation analysis. BSG expression was positively correlated with most M2-associated immunosuppressive markers (Figure 4F), supporting an association between BSG and an M2-like transcriptional program within this macrophage population. The regulatory role of PPIA in C1 was additionally explored using scTenifoldKnk [30], which models virtual gene knockout within single-cell gene regulatory networks. Predicted downstream targets most strongly affected by PPIA deletion included multiple members of the MCM family (Figure S6D), with functional enrichment centered on cell-cycle regulation and DNA replication (Figure S6E).
Together, these analyses identify PPIA-BSG signaling as a candidate communication axis between the proliferative, glycolysis-enriched C1 subcluster and immunosuppressive SPP1⁺ macrophages. Its selective detection in IA, together with the associated metabolic and immunoregulatory features, supports further functional evaluation of this interaction in invasive progression.
Spatial transcriptomics and mIHC support spatial association between C1 and macrophages in invasive tumors
Spatial transcriptomic data were used to assess whether the C1-associated transcriptional signature and SPP1+ macrophage signature localized to overlapping tissue regions. Spatial mapping of subcluster-specific module scores (Table S9) revealed minimal C1-associated signal in AIS and MIA but marked enrichment in IA (Figure 4G, S7A–D, S8). Across spatial spots, C1 and SPP1+ macrophage module scores were positively correlated, indicating preferential localization of these transcriptional programs within the same tissue regions. Spot-level cellular composition was further estimated with spacexr [31] using the scRNA-seq dataset as a reference (Table S10). However, the spatial resolution of the 10× Visium platform, together with the limited number of confidently assigned spots in several samples, precluded robust neighborhood analysis and therefore did not permit reliable inference of direct cell-cell adjacency.
Spatial mapping further revealed overlapping PPIA and BSG expression in regions enriched for the C1-associated malignant epithelial signature and myeloid cells, consistent with the PPIA-BSG interaction inferred from cell-cell communication analysis (Figure 4B–C). This association was evaluated independently at the protein level by mIHC staining, with PPIA assessed in tumor epithelial cells and CD147 in CD68⁺ macrophages. PPIA expression in tumor cells was significantly higher in IA than in AIS (Figure 5A–B, S9A–B, and Table S11), while Spearman correlation analysis showed a positive association between tumor-cell PPIA and macrophage CD147 expression (Figure 5C, S9C).
Multiplex immunohistochemical characterization of PPIA and CD147 in tumor epithelial cells and macrophages. A, Representative multiplex immunohistochemistry images of IA tissues showing nuclear staining (DAPI), epithelial marker PanCK, glycolysis marker GLUT1, macrophage marker CD68, and interaction-related proteins PPIA and CD147. B, Representative multiplex immunohistochemistry images of AIS tissue stained with the same antibody panel as in A. C, Quantitative analysis of marker expression. Box plots show (i) PPIA expression in tumor epithelial cells (PanCK⁺), (ii) GLUT1 expression in tumor epithelial cells, and (iii) CD147 expression in macrophages (CD68⁺) in IA and AIS samples. Scatter plot shows the relationship between PPIA expression in tumor cells and CD147 expression in macrophages across samples. Spearman correlation coefficients and P values are indicated (ρ = 0.6, P < 0.01).
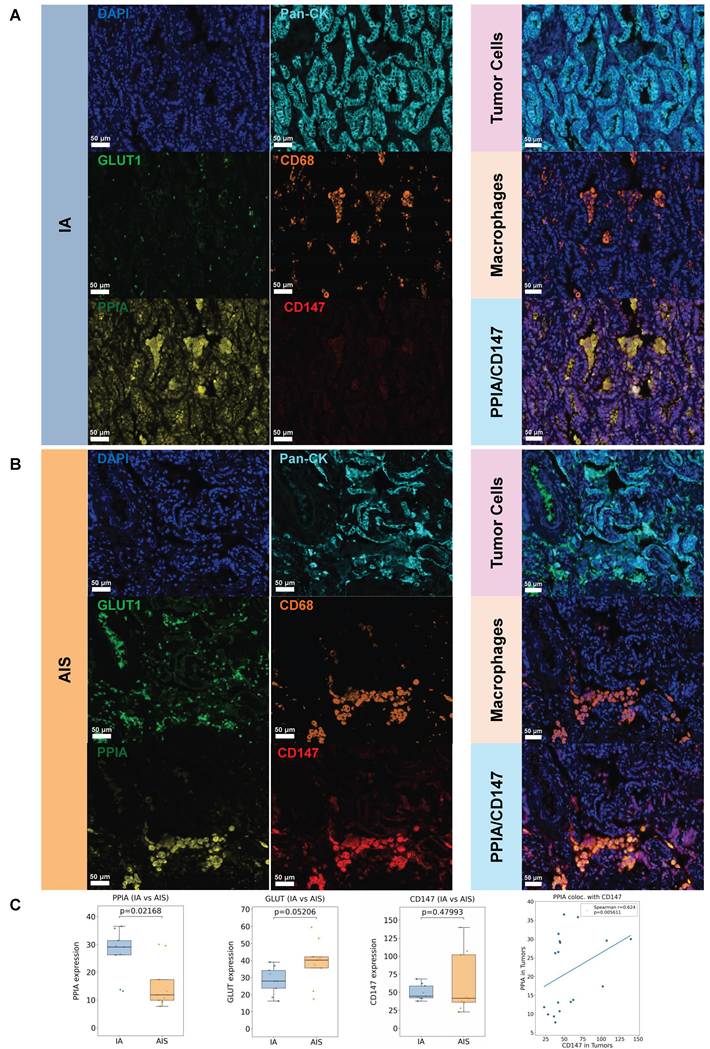
Overall, the spatial transcriptomic data demonstrated tissue-level overlap between the C1-associated transcriptional signature and SPP1⁺ macrophages in invasive tumors, while mIHC independently showed a corresponding association between epithelial PPIA and macrophage CD147 at the protein level. These complementary findings provide spatial and histological support for the inferred PPIA-BSG interaction between C1 cells and the macrophage compartment.
Cell-cell communication analysis predicts an association between SPP1⁺ macrophages and emerging CD8⁺ T-cells dysfunction in invasive LUAD
Transcription factor analysis was used to examine regulatory features associated with the SPP1+ macrophage phenotype. Computational inference of transcription factor activity identified predicted target genes enriched in pathways related to myeloid and T-cell differentiation (Figure S10A–B), suggesting a possible association between SPP1+ macrophages and T cells. Cell-cell communication analysis revealed extensive signaling between myeloid cells and T-cell subclusters, with particularly strong interactions between SPP1+ macrophages and cytotoxic CD8+ T cells (CD8_CTLs). In IA, predicted signaling through SPP1-CD44 and MIF-(CD74/CXCR4) ligand-receptor pairs was markedly increased (Figure S10C–D). Previous studies have shown that MIF can actively recruit cytotoxic CD8+ T cells into the tumor lesion through the CD74/CXCR4 axis [32,33], whereas SPP1 engagement of CD44 can induce exhaustion-associated markers, including PDCD1, LAG3, and HAVCR2, suppress IFN-γ production, and directly impair cytotoxic function in a dose-dependent manner [34]. Functional scoring further showed that CD8_CTLs retained appreciable cytotoxic activity but simultaneously exhibited features of exhaustion, with the clearest shift observed in IA (Figure S10E).
Thus, enhanced SPP1-CD44 and MIF-(CD74/CXCR4) signaling between SPP1+ macrophages and CD8_CTLs coincided with emerging CD8+ T-cell dysfunction in IA, consistent with an immunosuppressive microenvironment that may favor malignant progression.
C1-SPP1⁺ macrophage interaction via the PPIA-BSG axis is reproduced across independent cohorts
The reproducibility of the C1 subcluster was further evaluated in three independent scRNA-seq datasets representing distinct clinical settings, including multiregional tumors, multiple primary lung cancers, and metastatic lesions (Figure 6A, S11–S13). The C1 subcluster was consistently recovered in all three cohorts together with enrichment of SPP1⁺ macrophages in the tumor microenvironment. In matched samples, metastatic lesions contained a substantially higher proportion of C1 cells than primary tumors, suggesting an association between this cell subcluster and disease progression (Figure 6B). Within the multiregional cohort, C1 cells were detected in the tumor center, invasive edge, and distant lung tissue, indicating persistence across spatially separated compartments. C1 was also independently identified in distinct primary lesions from the same patients with multiple primary lung cancers. Detection across spatial gradients, metastatic sites, and independent primary tumors therefore supports C1 as a reproducible malignant epithelial subcluster rather than a transient, cohort-specific transcriptional artifact.
Cross-cohort distribution of C1 and preservation of C1-SPP1+ macrophage communication across distinct LUAD contexts. A, UMAP representation showing transfer of the previously defined malignant epithelial subcluster annotations to three independent single-cell datasets. B, Bar plot showing the relative proportions of malignant epithelial subclusters across multiregional tumors, metastatic lesions, and multiple primary lung cancers. C, Dot plot showing predicted ligand-receptor interactions between C1 and Mac_SPP1 across the three independent datasets.
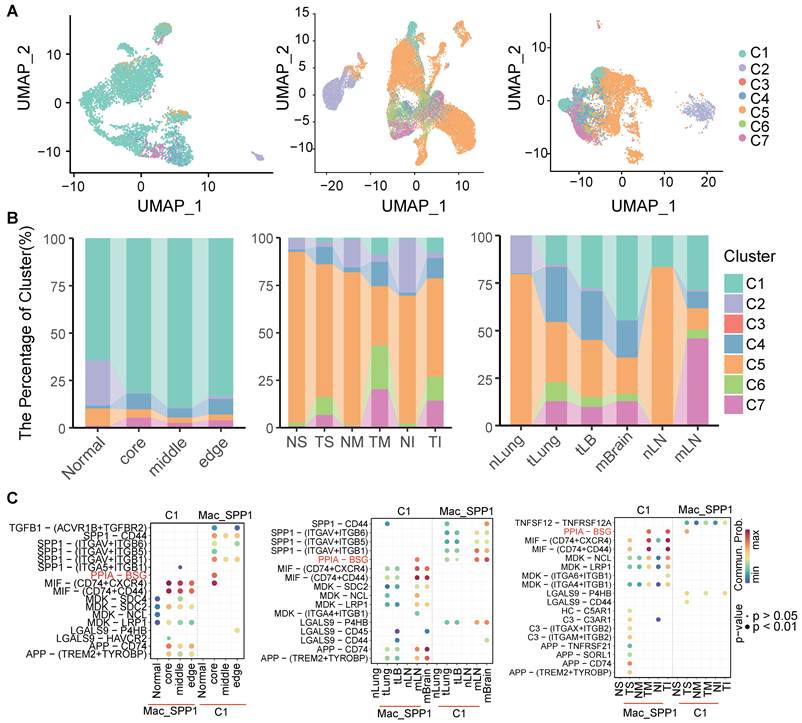
Cell-cell communication analysis across the three validation scRNA-seq datasets further showed that PPIA-BSG signaling remained one of the strongest predicted interactions between C1 cells and SPP1⁺ macrophages (Figure 6C, S14–S16). The reproducibility of this interaction across clinically and spatially distinct datasets supports the possibility that C1-SPP1⁺ macrophage communication is maintained during LUAD progression and recurrence. The clinical relevance of C1 abundance was further examined in an independent bulk RNA-seq cohort [35]. Results showed that higher inferred C1 abundance was significantly associated with shorter RFS (Figure S17A–B). After adjustment for age and sex, multivariate Cox regression retained C1 as an independent predictor of tumor recurrence (Figure S17C), whereas conventional clinical variables were not significantly associated with RFS.
Collectively, these findings demonstrate that both the C1 malignant subcluster and the PPIA-BSG interaction with SPP1+ macrophages are reproducible across independent cohorts and that increased C1 abundance is associated with metastatic lesion and unfavorable clinical outcome.
Discussion
Integration of scRNA-seq and spatial transcriptomic datasets spanning precursor lesions, invasive adenocarcinoma, metastatic tumors, and multiple primary LUADs identified C1 as a recurrent malignant epithelial subcluster with pronounced proliferative and glycolytic activity. C1 became progressively more abundant with advancing disease, from early GGN lesions to invasive and metastatic tumors, and higher inferred abundance was consistently associated with unfavorable outcomes in independent bulk RNA-seq cohorts. These findings identify C1 as a reproducible epithelial subcluster associated with invasive progression and adverse prognosis across distinct clinical settings.
Previous single-cell studies of GGNs have largely emphasized changes in the tumor microenvironment. Lee & Lee identified multicellular ecotypes associated with progression from ground-glass opacity to advanced LUAD [36], whereas Ren et al. characterized interactions between CXCL9+ and TREM2+ tumor-associated macrophages during GGN invasion and metastasis [37]. However, far less is known about heterogeneity within the malignant epithelial compartment itself, particularly before overt invasion. The present study revealed that this compartment is already transcriptionally diverse at the precursor stage and identified C1 as a distinct population in which proliferative and glycolytic programs are coordinately activated during invasive progression. The progressive enrichment of C1 in invasive and metastatic lesions suggests that epithelial subclusters associated with aggressive behavior may be established before histological evidence of invasion becomes apparent. The metabolic phenotype of C1 provides additional insight into this early epithelial divergence. Increased expression of key glycolytic enzymes, including PFKL, PGK1, and GPI, together with predicted E2F1 regulatory activity, is consistent with previous metabolomic evidence of early Warburg-like metabolic reprogramming in GGNs. This epithelial-subcluster-specific glycolytic phenotype also accords with spatial multi-omics studies showing regional lactate accumulation in LUAD, where elevated lactate has been linked to histone lactylation and mitochondrial sirtuin signaling that can stabilize pro-metastatic transcriptional subclusters and facilitate metabolic adaptation [38-40]. Unlike bulk-level metabolomic approaches, which capture these metabolic changes at the tissue level, the present analysis resolves the underlying glycolytic program at single-cell resolution and maps it to a defined malignant epithelial subpopulation.
Cell-cell communication was next analyzed to investigate the interaction between C1 and the tumor microenvironment. Analysis revealed extensive interactions between C1 and immune cell populations, with particularly strong signaling involving SPP1⁺ macrophages. Among the predicted ligand-receptor pairs, PPIA-BSG emerged as a prominent interaction enriched in invasive tumors and reproducibly detected across primary tumors, metastatic lesions, and multiple primary lung cancers. Extracellular PPIA can engage BSG to activate inflammatory signaling, extracellular-matrix remodeling, and macrophage polarization, but the contribution of this pathway to the transition from early LUAD lesions to invasive disease remains poorly defined. The present data therefore raise the possibility that PPIA-BSG signaling contributes to communication between the C1 malignant epithelial subcluster and SPP1+ macrophages during progression to invasive LUAD.
However, several limitations constrain mechanistic interpretation of this interaction. SPP1 was not included in the mIHC panel, preventing direct assignment of CD68+CD147+ macrophages to the transcriptionally defined SPP1+ macrophage subset. Protein-level confirmation will therefore require multiplex panels incorporating SPP1 together with additional macrophage-subset markers. In addition, the functional relevance of the predicted PPIA-BSG interaction remains to be evaluated in appropriately validated C1-like tumor cell-macrophage co-culture and in vivo models. Genetic knockdown, pharmacological inhibition, or antibody-mediated blockade of PPIA or BSG/CD147, followed by assessment of macrophage polarization, tumor-cell invasion, and glycolytic activity, will be necessary to determine whether this interaction has a direct mechanistic role in LUAD progression.
A hyper-glycolytic niche can further reshape the local microenvironment through extracellular lactate accumulation and histone lactylation, processes that have been linked to tumor-supportive macrophage polarization and epithelial-mesenchymal transition [38,39]. The present findings are compatible with such a metabolic–immune relationship, but the evidence remains inferential because the PPIA–BSG interaction was identified through computational and spatial analyses rather than direct perturbation. Whether this interaction constitutes a functional signaling mechanism between the glycolytic C1 state and macrophages remains to be established experimentally. Spatial analyses further linked the C1 subcluster to an immunoregulatory macrophage compartment in invasive tumors. Spatial transcriptomics showed tissue-level overlap between the C1-associated signature and SPP1⁺ macrophages, while mIHC independently demonstrated an association between epithelial PPIA and CD147+CD68+ macrophages. Within C1, PPIA⁺BSG⁺ cells showed stronger glycolytic and hypoxic signatures and a trend toward higher epithelial-mesenchymal transition scores. SPP1⁺ macrophages, in turn, exhibited an M2-like immunoregulatory transcriptional phenotype and showed prominent predicted communication with cytotoxic CD8+ T cells, coinciding with features of T-cell dysfunction that were most evident in invasive tumors. The PPIA-BSG interaction between C1 cells and SPP1+ macrophages was reproducibly detected across independent cohorts encompassing invasive primary tumors, metastatic lesions, and multiple primary lung cancers despite substantial inter-patient heterogeneity. Collectively, these observations support a recurrent microenvironmental pattern in which metabolically active malignant epithelial cells are spatially associated with immunosuppressive SPP1⁺ macrophages, potentially contributing to the establishment of a tumor-promoting niche during LUAD progression.
The reproducibility and prognostic association of C1 also suggest potential clinical relevance in early-stage LUAD. Across three independent bulk RNA-seq cohorts, greater inferred C1 abundance was associated with shorter overall and recurrence-free survival, indicating potential value for recurrence-risk stratification. Because C1 is characterized by a defined set of proliferation- and glycolysis-associated markers, translation into FFPE-compatible mIHC approaches may ultimately provide a clinically accessible means of detecting this high-risk epithelial subcluster, although assay optimization and prospective validation will be required. Beyond risk stratification, the recurrent spatial association between C1 cells and SPP1⁺ macrophages, together with the inferred PPIA-BSG interaction, also suggests that this metabolic-immune interaction may represent a candidate therapeutic target. Whether disruption of PPIA-BSG signaling can alter tumor metabolism, macrophage phenotype, or invasive behavior remains unknown, particularly in early-stage LUAD with high-risk molecular features but limited histological invasion. Given that the current evidence is derived primarily from computational inference and correlative spatial analyses, therapeutic interpretation should remain provisional until causal effects are established through targeted functional validation, especially in C1-high early-stage lesions.
Several limitations should be considered. First, the integrated analysis was based on cross-sectional datasets from independent cohorts and therefore could not determine whether precursor subclusters to invasive identified in early lesions evolved into malignant subclusters present in invasive or metastatic lesions within the same patients. Second, the proposed PPIA-BSG interaction was primarily inferred from computational and spatial association analyses, and targeted experimental validation will be required to determine whether this interaction has a causal role in LUAD progression. Third, the metabolic characterization of C1 also centered on glycolysis, and potential dependencies on other pathways, including methionine metabolism, remain unresolved [41]. Finally, prognostic associations were derived from CIBERSORT-based deconvolution of bulk RNA-seq datasets rather than direct quantification of C1 cells. Prospective studies with longitudinal pulmonary nodule follow-up will therefore be necessary to establish the prognostic performance of C1 and determine whether it provides information beyond established clinical staging systems.
Materials and Methods
Data acquisition
Four scRNA-seq datasets and one spatial transcriptomic dataset [42] were assembled from publicly available repositories, including samples from ground-glass nodules (GGNs) [9,10], metastatic lesions [43], multiple primary lung cancers (MPLCs) [44], and multi-regional tumor tissues [45]. Bulk RNA-seq data were obtained from the Gene Expression Omnibus (GEO) datasets GSE8894 [35] and GSE102511 [18], the Cancer Genome Atlas Lung Adenocarcinoma (TCGA-LUAD) cohort [46], and an additional expression matrix provided in the supplementary materials of a previously published study [19].
Single-cell RNA-seq data processing
Gene expression matrices generated with Cell Ranger (v8.0.1) [47] were imported into Seurat (v4.3.0) using the Read10X function [48]. Cells with fewer than 200 unique molecular identifiers (UMIs), more than 5 000 detected genes, or mitochondrial transcripts accounting for more than 20% of UMI counts were excluded. Potential doublets were identified independently within each sample using DoubletFinder (v2.0.3) [49] with default parameters and removed before downstream analysis. Cell-cycle phase scores were calculated using the CellCycleScoring function in Seurat. S-phase and G2/M-phase scores were subsequently regressed out during data scaling with ScaleData to minimize cell-cycle-associated effects on dimensionality reduction and clustering.
Identification of malignant epithelial cells
Copy number variation (CNV) profiles of epithelial cells were inferred using inferCNV (v1.18.1) [17], with mast cells and plasma cells serving as nonmalignant reference populations. Analyses were conducted using default settings, including hidden Markov model (HMM)-based assignment of CNV subclusters and noise filtering to reduce background expression variability. Phylogenetic clone trees were subsequently reconstructed from the inferred CNV profiles according to previously described methods [50].
Differential expression and functional enrichment analyses
Cell subset-enriched genes were identified using the FindAllMarkers function in Seurat. Signature differentially expressed genes (DEGs) were defined using thresholds of log2 fold change > 0.2 and adjusted P < 0.05. To increase the robustness of cell-specific marker selection, random forest-based feature importance analysis was performed independently for each cell subset. Genes prioritized by random forest analysis were intersected with markers identified by FindAllMarkers, and the overlapping genes were designated as characteristic markers for the corresponding cell subset. Functional annotation was performed using Gene Ontology (GO) and Kyoto Encyclopedia of Genes and Genomes (KEGG) enrichment analyses implemented in clusterProfiler (v3.18.1) [51].
Hallmark pathway activity
Hallmark pathway activity was assessed using the 50 Hallmark gene sets obtained from msigdbr (v7.5.1) [52]. Single-cell pathway scores were estimated using the AddModuleScore function in Seurat with default parameters. Relative pathway activity across cell populations was visualized using pheatmap (v1.0.12) [53].
Cell-cell communication analysis
Potential intercellular signaling networks were inferred using CellChat (v2.1.2) [54] on the basis of known ligand-receptor interactions among the defined cell subsets. Analyses were performed within each tissue-origin group to characterize differences in predicted communication patterns across clinical contexts. Built-in CellChat visualization functions, including circle plots, heatmaps, and hierarchy plots, were used to display interaction direction, inferred signaling strength, and the relative contribution of individual cell populations to the overall communication network.
Simulated PPIA knockout in scRNA-seq data
The regulatory consequences of PPIA loss in C1 cells were modeled using scTenifoldKnk (v1.0.3) [30], a machine-learning framework for virtual gene knockout in single-cell gene regulatory networks. The raw count matrix from C1 cells was used to construct the regulatory network, followed by PPIA knockout simulation and identification of genes predicted to be most strongly affected. All analyses were performed using default scTenifoldKnk parameters.
Visium spatial transcriptomic data analysis
Spatial transcriptomic data generated with the 10× Genomics Visium platform were imported into Seurat for downstream analysis. Spatial distributions of the C1 and SPP1+ macrophage signatures were evaluated using the marker sets defined from the corresponding scRNA-seq subclusters. Signature scores were calculated for each spatial spot using the AddModuleScore function in Seurat, and spatial concordance between C1 and SPP1⁺ macrophage scores was assessed by Spearman correlation across spots.
Spot deconvolution of the 10× Visium spatial transcriptomic data was performed using the RCTD algorithm implemented in spacexr (v2.2.1) with default parameters, with the annotated scRNA-seq dataset generated in this study serving as the reference. For sample-level summaries, each spot was assigned to the cell type with the highest inferred weight (dominant cell type), and the numbers of spots classified as C1 or SPP1+ macrophages were calculated for each sample.
Bulk RNA-seq data processing
CIBERSORT [20] was used to estimate the relative abundance of malignant epithelial subpopulations in bulk RNA-seq cohorts. A reference signature matrix was constructed from the scRNA-seq dataset by identifying subcluster-specific markers with the FindAllMarkers function in Seurat and retaining the top 500 DEGs for each malignant epithelial subcluster. The signature matrix was used as input for CIBERSORT deconvolution to infer the relative proportion of each signature-defined malignant epithelial subcluster, including C1, in each bulk transcriptomic sample. Within each cohort, patients were stratified into C1-high and C1-low groups based on whether their inferred C1 abundance was above or below the cohort-specific median.
Survival analyses were performed using survminer (v0.4.9) [55]. Kaplan-Meier curves were generated for the C1-high and C1-low groups, and survival differences were evaluated using the log-rank test. Multivariable Cox proportional hazards regression was used to estimate hazard ratios (HRs) and 95% confidence intervals (CIs). Covariates were selected according to the clinical information available for each dataset and included age, sex, smoking status, and tumor stage, where applicable.
Cross-cohort validation of C1
C1 cells were identified in independent scRNA-seq cohorts by reference-based label transfer in Seurat. The original scRNA-seq dataset served as the reference, and subtype annotations were transferred to each query dataset using the FindTransferAnchors and MapQuery functions. The top 20 DEGs identified for C1 by FindAllMarkers were additionally retained as the C1 signature gene set.
Gene set enrichment analysis (GSEA)
GSEA was conducted with the clusterProfiler using the 50 hallmark pathways from the Molecular Signatures Database (MSigDB). Enrichment results were visualized using GseaVis [56].
Multiplex immunohistochemistry (mIHC)
Formalin-fixed, paraffin-embedded (FFPE) tissue sections (5 μm) from 18 samples obtained from six patients with GGNs at Yunnan Cancer Hospital (China) were analyzed by mIHC. Written informed consent was obtained from all participants, and the study protocol was approved by the Ethics Committee of Yunnan Cancer Hospital (ID: KYLX2025-154). Sections were incubated overnight at 4 °C with antibodies against pan-cytokeratin, GLUT1, cyclophilin A, CD68, CD147, and Ki67, followed by signal amplification using a tyramide signal amplification kit (RecordBio, RC0086Plus-67RM).
Images were analyzed in Fiji/ImageJ [57] using a previously described workflow with minor modifications. Briefly, three non-overlapping regions of interest (ROIs) were selected from each sample, with each ROI corresponding to a complete field of view acquired at 200× total magnification. After binary conversion, DAPI-positive nuclei were segmented using Analyze Particles with an area threshold of 50–300 μm2 and a circularity range of 0.20–1.00. Positivity thresholds for individual fluorescence channels were determined automatically using Color Threshold, and fluorescence intensity was quantified as the mean gray value. Dual-positive cells were defined by positive signals for both markers within a 20 μm region centered on the nucleus and were counted manually. Pixel gray values were Z-standardized within each ROI prior to Spearman rank correlation analysis. Identical imaging and image-analysis parameters were applied across all samples.
Abbreviations
LUAD: lung adenocarcinoma; GGN: Ground-glass nodules; AAH: atypical adenomatous hyperplasia; AIS: adenocarcinoma in situ; MIA: minimally invasive adenocarcinoma; IA: invasive adenocarcinoma; TME: tumor microenvironment; OS: overall survival; RFS: recurrence-free survival; TF: transcription factor; scRNA-seq: single-cell RNA sequencing; mIHC: multiplex immunohistochemistry; ROI: region of interest.
Supplementary Material
Supplementary figures.

Supplementary table 1.
Supplementary table 2.
Supplementary table 3.
Supplementary table 4.
Supplementary table 5.
Supplementary table 6.
Supplementary table 7.
Supplementary table 8.
Supplementary table 9.
Supplementary table 10.
Supplementary table 11.
Acknowledgements
We would like to thank Mr. Jiangyang Li and Dr. Mengxia Li for assistance with the multiplex immunohistochemistry experiments. Special thanks to Dr. Weiwei Zhai and Dr. Yong Tao for valuable suggestions on data analysis and comments on an earlier version of the manuscript. All scientific content, data analysis, interpretation, and conclusions were independently developed and verified by the authors, who take full responsibility for the accuracy and integrity of the manuscript.
Funding
This work was supported by the National Natural Science Foundation of China (32070683 to Y.C., U24A20688 to L.Q.Y.), First-Class Discipline Team of Kunming Medical University (2024XKTDYS08 and 2024XKTDYS07 to L.Y.), and Yunnan Basic Research Program (202401AY070001-330 to F.Y.).
Data and code availability
All datasets analyzed in this study were obtained from publicly available repositories. Single-cell RNA sequencing and spatial transcriptomics datasets were retrieved from the Gene Expression Omnibus (GEO) under accession numbers GSE123904, GSE127465, GSE131907, and GSE189357, and from ArrayExpress under accession number E-MTAB-6149. Additional data were obtained from the Genome Sequence Archive (GSA) in the BIG Data Center, Beijing Institute of Genomics (BIG), Chinese Academy of Sciences, under accession number HRA001130, which requires an application for access through the GSA data access process. Bulk transcriptomic datasets were obtained from GEO under accession numbers GSE8894 and GSE102511 and from The Cancer Genome Atlas Lung Adenocarcinoma Cohort (TCGA-LUAD). An additional bulk expression matrix was obtained from the supplementary materials of a previously published study [19]. All code used for data analysis is available at GitHub (https://github.com/ccbio/luadEpiSubEvol).
Author contributions
Conceptualization: Y.C.; Methodology: Y.C. and L.Q.Y.; Bioinformatics and data analysis: L.Q.Y., J.F., W.L., L.L., and Y.C.; Clinical data collection: F.Y., L.Y., X.L., W.L., and R.Y.; Investigation: Y.C. and Y.L.; mIHC: C.M. and F.Y; Writing-original draft preparation: L.Q.Y. and Y.C.; Writing-review and editing: all authors.
Competing Interests
The authors have declared that no competing interest exists.
References
1. Siegel RL, Kratzer TB, Wagle NS, Sung H, Jemal A. Cancer statistics, 2026. CA Cancer J Clin. 2026;76:e70043
2. Thai AA, Solomon BJ, Sequist LV, Gainor JF, Heist RS. Lung cancer. Lancet. 2021;398:535-54
3. Mazzilli SA, Rahal Z, Rouhani MJ, Janes SM, Kadara H, Dubinett SM. et al. Translating premalignant biology to accelerate non-small-cell lung cancer interception. Nat Rev Cancer. 2025;25:379-92
4. Fu F, Shang J, Yan Y, Jiang H, Han H, Yuan H. et al. Genomic and transcriptomic dynamics in the stepwise progression of lung adenocarcinoma. Cell Res. 2025;35:1037-55
5. Chen Y-C, Hsu C-L, Wang H-M, Wu S-G, Chang Y-L, Chen J-S. et al. Multiomics Analysis Reveals Molecular Changes during Early Progression of Precancerous Lesions to Lung Adenocarcinoma in Never-Smokers. Cancer Res. 2025;85:602-17
6. Xu X, Rock JR, Lu Y, Futtner C, Schwab B, Guinney J. et al. Evidence for type ii cells as cells of origin of K-Ras-induced distal lung adenocarcinoma. Proc Natl Acad Sci. 2012;109:4910-5
7. Gentles AJ, Hui AB-Y, Feng W, Azizi A, Nair RV, Bouchard G. et al. A human lung tumor microenvironment interactome identifies clinically relevant cell-type cross-talk. Genome Biol. 2020;21:107
8. Peng F, Sinjab A, Dai Y, Treekitkarnmongkol W, Yang S, Gomez Bolanos LI. et al. Multimodal spatial-omics reveal co-evolution of alveolar progenitors and proinflammatory niches in progression of lung precursor lesions. Cancer Cell. 2025 S1535-6108(25)00445-3
9. Wang Z, Li Z, Zhou K, Wang C, Jiang L, Zhang L. et al. Deciphering cell lineage specification of human lung adenocarcinoma with single-cell RNA sequencing. Nat Commun. 2021;12:6500
10. Zhu J, Fan Y, Xiong Y, Wang W, Chen J, Xia Y. et al. Delineating the dynamic evolution from preneoplasia to invasive lung adenocarcinoma by integrating single-cell RNA sequencing and spatial transcriptomics. Exp Mol Med. 2022;54:2060-76
11. Zhu B, Chen P, Aminu M, Li J-R, Fujimoto J, Tian Y. et al. Spatial and multiomics analysis of human and mouse lung adenocarcinoma precursors reveals TIM-3 as a putative target for precancer interception. Cancer Cell. 2025;43:1125-1140.e10
12. He Y, Liu X, Wang H, Wu L, Jiang M, Guo H. et al. Mechanisms of Progression and Heterogeneity in Multiple Nodules of Lung Adenocarcinoma. Small Methods. 2021;5:2100082
13. Zheng H, Li Y-Q, Lu X, Zhang J, Yu S-S, Deng X-F. et al. Senescent SPP1+ macrophages remodel the tumor microenvironment and promote the progression of early-stage lung adenocarcinoma featured with mixed ground glass nodule. Mol Cancer. 2025;24:298
14. Zhang F, Zhou Z, Zhang P, Li S. Multi-Omics Meets Premalignancy: Paving the Way for Early Prevention of Cancer. Research. 2025;8:0930
15. Nie M, Yao K, Zhu X, Chen N, Xiao N, Wang Y. et al. Evolutionary metabolic landscape from preneoplasia to invasive lung adenocarcinoma. Nat Commun. 2021;12:6479
16. Chen X, Yi C, Yang M-J, Sun X, Liu X, Ma H. et al. Metabolomics study reveals the potential evidence of metabolic reprogramming towards the Warburg effect in precancerous lesions. J Cancer. 2021;12:1563-74
17. Patel AP, Tirosh I, Trombetta JJ, Shalek AK, Gillespie SM, Wakimoto H. et al. Single-cell RNA-seq highlights intratumoral heterogeneity in primary glioblastoma. Science. 2014;344:1396-401
18. Sivakumar S, Lucas FAS, McDowell TL, Lang W, Xu L, Fujimoto J. et al. Genomic Landscape of Atypical Adenomatous Hyperplasia Reveals Divergent Modes to Lung Adenocarcinoma. Cancer Res. 2017;77:6119-30
19. Zhang Y, Fu F, Zhang Q, Li L, Liu H, Deng C. et al. Evolutionary proteogenomic landscape from pre-invasive to invasive lung adenocarcinoma. Cell Rep Med. 2024;5:101358
20. Newman AM, Liu CL, Green MR, Gentles AJ, Feng W, Xu Y. et al. Robust enumeration of cell subsets from tissue expression profiles. Nat Methods. 2015;12:453-7
21. Wu Y, Yang S, Ma J, Chen Z, Song G, Rao D. et al. Spatiotemporal Immune Landscape of Colorectal Cancer Liver Metastasis at Single-Cell Level. Cancer Discov. 2022;12:134-53
22. Yang X, Liu Z, Zhou J, Guo J, Han T, Liu Y. et al. SPP1 promotes the polarization of M2 macrophages through the Jak2/Stat3 signaling pathway and accelerates the progression of idiopathic pulmonary fibrosis. Int J Mol Med. 2024;54:89
23. Matsubara E, Komohara Y, Esumi S, Shinchi Y, Ishizuka S, Mito R. et al. SPP1 Derived from Macrophages Is Associated with a Worse Clinical Course and Chemo-Resistance in Lung Adenocarcinoma. Cancers. 2022;14:4374
24. Chen O, Liu T, Fu L, Li J, Wang Y, Wang W. et al. Modulating tumor-associated macrophages through APP-CD74 blockade with IL4R-exosomes synergizes with PD-1 inhibition in gastric cancer. NPJ Precis Oncol. 2026;10:272
25. McClelland M, Zhao L, Carskadon S, Arenberg D. Expression of CD74, the receptor for macrophage migration inhibitory factor, in non-small cell lung cancer. Am J Pathol. 2009;174:638-46
26. Fukuda H, Arai K, Hashimoto E, Sekine K, Arai Y, Hiraoka N. et al. MIF-CD74 axis facilitates MDSC infiltration in the tumor microenvironment of pancreatic ductal adenocarcinoma. Cancer Lett. 2026;645:218348
27. Zhang X, Tian T, Zhang X, Liu C, Fang X. Elevated CD147 expression is associated with shorter overall survival in non-small cell lung cancer. Oncotarget. 2017;8:37673-80
28. Xu XY, Lin N, Li YM, Zhi C, Shen H. Expression of HAb18G/CD147 and its localization correlate with the progression and poor prognosis of non-small cell lung cancer. Pathol Res Pract. 2013;209(6):345-52
29. Huang W-T, Yang X, He R-Q, Ma J, Hu X-H, Mo W-J. et al. Overexpressed BSG related to the progression of lung adenocarcinoma with high-throughput data-mining, immunohistochemistry, in vitro validation and in silico investigation. Am J Transl Res. 2019;11:4835-50
30. Osorio D, Zhong Y, Li G, Xu Q, Yang Y, Tian Y. et al. ScTenifoldKnk: An efficient virtual knockout tool for gene function predictions via single-cell gene regulatory network perturbation. Patterns. 2022;3:100434
31. Cable DM, Murray E, Zou LS, Goeva A, Macosko EZ, Chen F. et al. Robust decomposition of cell type mixtures in spatial transcriptomics. Nat Biotechnol. 2022;40:517-26
32. Schwartz V, Lue H, Kraemer S, Korbiel J, Krohn R, Ohl K. et al. A functional heteromeric MIF receptor formed by CD74 and CXCR4. FEBS Lett. 2009;583:2749-57
33. Wang D, Li S, Yang Z, Yu C, Wu P, Yang Y. et al. Single-cell transcriptome analysis deciphers the CD74-mediated immune evasion and tumour growth in lung squamous cell carcinoma with chronic obstructive pulmonary disease. Clin Transl Med. 2024;14:e1786
34. Ding D, Li W, Ren J, Li Y, Jiang G, Liang R. et al. SPP1high macrophage-induced T-cell stress promotes colon cancer liver metastasis through SPP1/CD44/PI3K/AKT signaling. J Immunother Cancer. 2025;13:e012330
35. Lee E-S, Son D-S, Kim S-H, Lee J, Jo J, Han J. et al. Prediction of recurrence-free survival in postoperative non-small cell lung cancer patients by using an integrated model of clinical information and gene expression. Clin Cancer Res Off J Am Assoc Cancer Res. 2008;14:7397-404
36. Lee S-Y, Lee Y. Fibroblast TGF-β signaling defines spatial tumor ecosystems linked to immune checkpoint blockade resistance. Commun Biol. 2025;8:1730
37. Ren Y-F, Ma Q, Zeng X, Huang C-X, Ren J-L, Li F. et al. Single-cell RNA sequencing reveals immune microenvironment niche transitions during the invasive and metastatic processes of ground-glass nodules and part-solid nodules in lung adenocarcinoma. Mol Cancer. 2024;23:263
38. Yu X, Song S, Ke Y, Wei Q, Jiao X, Yang L. et al. Regulatory role of protein lactylation in tumor metastasis: mechanisms and emerging therapeutic strategies. J Adv Res. 2026 S2090-1232(26)00523-0
39. Tan Y, Tan W, Liang Y, Long Y, Chen S, Hu Q. et al. Machine learning-enabled spatial multi-omics uncovers lactate-driven targets and tumor microenvironmental reprogramming in cancer. NPJ Digit Med. 2025;9:109
40. Lee H, Yoon H. Mitochondrial sirtuins: Energy dynamics and cancer metabolism. Mol Cells. 2024;47:100029
41. Yang P-W, Xu X-Y, Jiao J-Y, Wang F-J, Chen Z. Role of methionine metabolism in cancer: recent advances in molecular mechanisms and therapeutic implications. Exp Hematol Oncol. 2026
42. Takano Y, Suzuki J, Nomura K, Fujii G, Zenkoh J, Kawai H. et al. Spatially resolved gene expression profiling of tumor microenvironment reveals key steps of lung adenocarcinoma development. Nat Commun. 2024;15:10637
43. Kim N, Kim HK, Lee K, Hong Y, Cho JH, Choi JW. et al. Single-cell RNA sequencing demonstrates the molecular and cellular reprogramming of metastatic lung adenocarcinoma. Nat Commun. 2020;11:2285
44. Wang Y, Chen D, Liu Y, Shi D, Duan C, Li J. et al. Multidirectional characterization of cellular composition and spatial architecture in human multiple primary lung cancers. Cell Death Dis. 2023;14:462
45. Lambrechts D, Wauters E, Boeckx B, Aibar S, Nittner D, Burton O. et al. Phenotype molding of stromal cells in the lung tumor microenvironment. Nat Med. 2018;24:1277-89
46. Cancer Genome Atlas Research Network. Comprehensive molecular profiling of lung adenocarcinoma. Nature. 2014;511:543-50
47. Zheng GXY, Terry JM, Belgrader P, Ryvkin P, Bent ZW, Wilson R. et al. Massively parallel digital transcriptional profiling of single cells. Nat Commun. 2017;8:14049
48. Stuart T, Butler A, Hoffman P, Hafemeister C, Papalexi E, Mauck WM. et al. Comprehensive integration of Single-Cell Data. Cell. 2019;177:1888-1902.e21
49. McGinnis CS, Murrow LM, Gartner ZJ. DoubletFinder: Doublet Detection in Single-Cell RNA Sequencing Data Using Artificial Nearest Neighbors. Cell Syst. 2019;8:329-337.e4
50. Pei G, Min J, Rajapakshe KI, Branchi V, Liu Y, Selvanesan BC. et al. Spatial mapping of transcriptomic plasticity in metastatic pancreatic cancer. Nature. 2025;642:212-21
51. Yu G, Wang L-G, Han Y, He Q-Y. clusterProfiler: an R package for comparing biological themes among gene clusters. Omics J Integr Biol. 2012;16:284-7
52. Liberzon A, Birger C, Thorvaldsdóttir H, Ghandi M, Mesirov JP, Tamayo P. The Molecular Signatures Database (MSigDB) hallmark gene set collection. Cell Syst. 2015;1:417-25
53. Kolde R. pheatmap: R package [Internet]. 2015. https://github.com/raivokolde/pheatmap.
54. Jin S, Plikus MV, Nie Q. CellChat for systematic analysis of cell-cell communication from single-cell transcriptomics. Nat Protoc. 2025;20:180-219
55. Kassambara A, Kosinski M, Biecek P. survminer: Drawing survival curves using ‘ggplot2’ [Internet]. 2016. https://rpkgs.datanovia.com/survminer/index.html.
56. Zhang J, Li H, Tao W, Zhou J. GseaVis: An R Package for Enhanced Visualization of Gene Set Enrichment Analysis in Biomedicine. Med Res. 2025;1:131-5
57. Schindelin J, Arganda-Carreras I, Frise E, Kaynig V, Longair M, Pietzsch T. et al. Fiji: an open-source platform for biological-image analysis. Nat Methods. 2012;9:676-82
Author contact
Corresponding authors: Prof. Dr. Yupeng Cun (Email: cunypedu.cn), Prof. Dr. Lianhua Ye (Email: Lhye1204com).