Impact Factor




Theranostics 2027; 17(1):430-444. doi:10.7150/thno.134228 This issue Cite
Research Paper
Gas diffusion governs the intracellular dissolution of lipid-shelled microbubbles
Yann Ferry1, Andrei Hancu1, Andrew Kristof2, Pavlos Anastasiadis3,4,5,6, John Blazeck2,7,8,9,10, Costas Arvanitis1,11 
1. Coulter Department of Biomedical Engineering, Georgia Institute of Technology and Emory University, Atlanta, Georgia, USA.
2. School of Chemical and Biomolecular Engineering, Georgia Institute of Technology, Atlanta, GA, USA.
3. Department of Neurosurgery, University of Maryland School of Medicine, Baltimore, MD, USA.
4. Department of Diagnostic Radiology and Nuclear Medicine, University of Maryland School of Medicine, Baltimore, MD, USA.
5. Fischell Department of Bioengineering, University of Maryland, College Park, MD, USA.
6. Brain Tumor Program, University of Maryland Marlene and Stewart Greenebaum Comprehensive Cancer Center, Baltimore, MD, USA.
7. Parker H. Petit Institute of Bioengineering and Bioscience, Georgia Institute of Technology, Atlanta, GA, USA, USA.
8. Integrated Cancer Research Center, Georgia Institute of Technology, Atlanta, GA, USA.
9. Georgia Immunoengineering Consortium, Emory University and Georgia Institute of Technology, Atlanta, GA, USA.
10. Winship Cancer Institute, Emory University, Atlanta, GA, USA.
11. Woodruff School of Mechanical Engineering, Georgia Institute of Technology, Atlanta, Georgia, USA.
Received 2026-3-11; Accepted 2026-10-6; Published 2027-1-1
Abstract
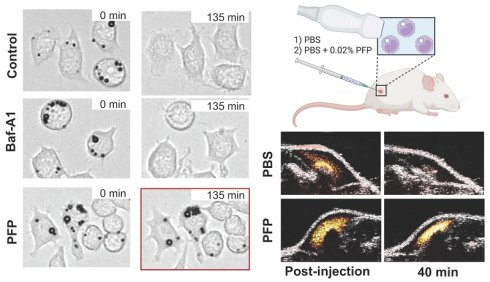
Labeling cells with lipid-shelled microbubbles (MBs) has recently been proposed as a method for imaging immune cell trafficking in the human body. However, attaining long MB half-life, which is key to their function as effective cellular acoustic reporters, is challenging due to MB radius decay (i.e., dissolution). In this paper, we investigate the mechanisms that drive the dissolution of intracellular MBs and explore potential strategies to extend the intracellular MB half-life.
Methods: For our investigations, we used the RAW 264.7 macrophage cell line and bone marrow- derived macrophages, multigas diffusion modeling, live-cell microscopy and linear and non-linear ultrasound imaging to study MB radius changes as a function of time, from uptake to retention and ultimately dissolution. To gain mechanistic insight into MB dissolution, we designed an experimental framework to distinguish the contributions of gas diffusion and intracellular degradation. We limited gas diffusion in vitro by saturating the surrounding media with perfluoro-n-pentane (PFP; 0.002%) and diminished intracellular degradation by inhibiting lysosomal activity with Bafilomycin A1. We encapsulated macrophages containing internalized MBs in agarose with or without PFP saturation, and we evaluated their prolonged echogenicity over time using ultrasound imaging. Lastly, we injected microbubble-labeled macrophages subcutaneously and intratumorally (4T1) in mice with or without 0.01% (v/v) PFP saturation and imaged continuously using amplitude-modulated pulse inversion (AMPI) and B-Mode ultrasound for up to 2 hours.
Results: The modeling that was fitted to experimentally measured radius–time dynamics under quasi-static conditions indicated that the relatively low (<60 min) intracellular MB half-life, under in vitro conditions, is dominated by gas efflux from the MB gas core. Consistent with the model predictions, saturating the surrounding medium with soluble PFP to compensate gas efflux significantly prolonged intracellular MB persistence (p = 0.003) without compromising macrophage viability (>90%) or proliferation. Blocking MB enzymatic degradation did not appear to influence MB half-life. Importantly, the observed improved MB stability persisted under dynamic US (ultrasound) imaging conditions and led to a two-fold increase in acoustic half-life relative to controls (p < 0.0001). In vivo PFP-saturation appeared to prevent signal decay for at least 75 min when injected subcutaneously and at least 105 min when injected intratumorally, which was the final observation time point in our study, whereas control groups showed significant decay after 15 (p = 0.012) and 25 minutes (p = 0.035).
Conclusion: Together, these data suggest that gas diffusion is the main driver of internalized MB dissolution at the studied timescale (2 hours), and that reducing gas diffusivity is therefore critical for achieving prolonged intracellular MB stability and retention. Overall, this work establishes a mechanistic and experimental framework for studying and prolonging the lifetime of acoustic reporters required for longitudinal ultrasound-based cell tracking.
Keywords: ultrasound contrast agents, cell tracking, ultrasound imaging, intracellular acoustic reporter, intracellular microbubble degradation
Introduction
Lipid-shelled microbubbles (MBs), due to their high compressibility, which results in a high scattering cross-section and image contrast [1,2], are widely used as acoustic contrast agents in clinical ultrasound imaging [3,4]. MBs are primarily employed as intravascular contrast agents for imaging tissue perfusion and, more recently, for imaging the microvasculature using super-localization techniques [5-7]. Due to their ability to improve the US image contrast, recent studies have investigated the application of MBs for tracking of MB-labeled cells in adoptive cell transfer settings [8,9]. Apart from monitoring the accumulation and spatial distribution of therapeutic cells to disease sites, which is essential for evaluating efficacy, optimizing dosing, and forecasting treatment outcomes [10], such approaches can enable extravascular imaging [9], as some of the carrier cells, such as macrophages, have the capacity to extravasate, a property that MBs alone lack. While these early investigations have highlighted the potential of US to image MB-labeled cells with high sensitivity and specificity, they also revealed that effective MB-based cell tracking requires an extended half-life of the internalized MBs. This is because the majority of biological processes of interest, such as immune cell homing to inflammatory sites, typically occur over several hours [11], requiring the MB lifetime to be at least on the same order of magnitude to capture substantial cell counts.
While for vascular mapping, MB lifetime limitations can be mitigated by reinjecting (bolus) or continuously (infusion) injecting contrast agents [12], cell tracking relies on the retention of internalized MBs, which cannot be replenished in vivo; once the MBs' radius decreases below a certain level, the acoustic signal and image contrast are irreversibly lost. Hence, understanding the principles that govern intracellular MB stability is critical for optimizing their retention and supporting longitudinal macrophage imaging.
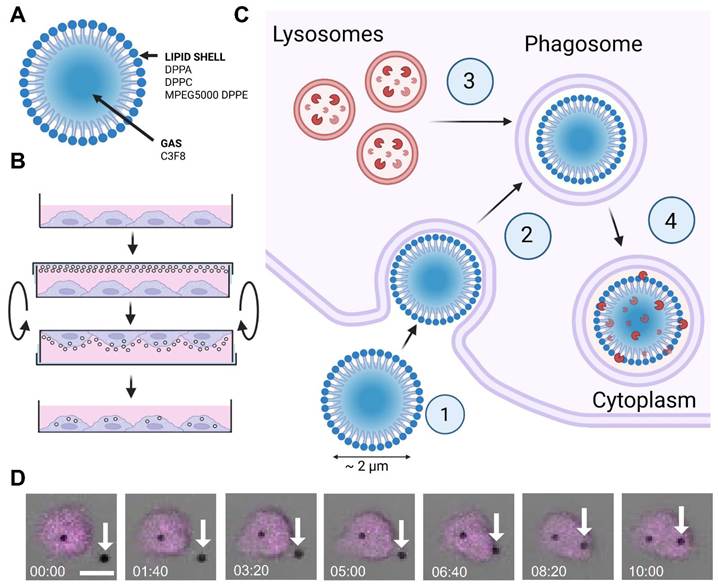
The stability and lifetime of MBs in free media have been thoroughly studied and modeled, with a particular emphasis on the role of gas composition, shell properties, and interfacial mass transport [13-15]. These studies have established that gas leaking out of the MBs, driven by gas diffusion and Laplace pressure, is the primary mechanism driving MB dissolution [13,16]. However, despite growing interest in cell labeling with MBs and previous studies on the acoustic properties of internalized MBs [17,18], MB retention and, in particular, radius evolution following cellular internalization remain unexplored. Moreover, strategies to extend the lifetime of internalized MBs have received limited attention. MB uptake and cell internalization introduce additional physicochemical variables, such as enzymatic degradation of the lipid shell, which may influence MB stability (i.e., gas diffusion and Laplace pressure; Fig. 1B-D). Clarifying the relative contributions of gas transport and shell degradation is therefore essential for understanding the mechanisms governing intracellular MB stability and identifying effective strategies to prolong their retention.
Schematic and microscopy representation of the MB uptake by RAW 264.7 Macrophages. (A) Composition of homemade Definity-like MBs. (B) Illustration of the MB uptake protocol for RAW 264.7 macrophages. (C) Illustration of the general steps believed to take place following MB internalization by macrophages: (1) phagocytosis, (2) encapsulation in a phagosome, (3) and (4) merging of the cytosol lysosome containing enzymatic degradation agents with the phagosome into a phagolysosome. (D) Confocal microscopy live imaging (20x, bright field and fluorescence) of MB uptake by a macrophage (Magenta: RAW 264.7 macrophage, white arrows: microbubbles; scale bar: 10 µm).
In this work, we investigate the dominant mechanisms controlling the dissolution of lipid-shelled MBs by inhibiting lysosomal activity with Bafilomycin-A1. Specifically, we explore (i) the MB gas core diffusion into the surrounding media due to concentration imbalance and Laplace pressure, and (ii) enzymatic digestion of the lipid shell following cellular uptake. Using the highly phagocytic and well-established RAW 264.7 macrophage cell line as well as bone marrow-derived macrophages (BMDMs) as biological models, we decouple the effects of gas diffusion and enzymatic degradation on MB stability. Furthermore, we demonstrate a practical approach to extend intracellular MB (MB-Mac) lifetime in vitro and in vivo by modulating the gas exchange in the surrounding medium. By elucidating the mechanisms governing intracellular MB dissolution and identifying routes to stabilize internalized MBs, this study provides viable strategies to expand the temporal window for ultrasound-based cell tracking in preclinical settings and supports its translation to clinics.
Materials and Methods
Cell culture
RAW 264.7 macrophages were cultured in Dulbecco’s Modified Eagle Medium (DMEM; Thermo Fisher Scientific, 10566024) supplemented with 10% fetal bovine serum (FBS; Thermo Fisher Scientific, 10082147) and 1% penicillin–streptomycin (Gibco, 15070063) in a humidified incubator maintained at 37 °C with 5% CO₂. Cell passage numbers were maintained below 30. BMDMs were harvested with complete Roswell Park Memorial Institute (cRPMI) 1640 medium, containing RPMI 1640 (Gibco, 11875093) with 10% FBS and 1% Antibiotic-Antimycotic (Cytiva, SH30027.01).
Bone marrow-derived macrophages
BMDMs were obtained by isolating bone marrow from the tibia and the femur of BALB/c mice (000651, The Jackson Laboratory). The mice were first euthanized in accordance with the Public Health Policy on the Humane Care and Use of Laboratory Animals and approved by the Institutional Animal Care and Use Committee of Georgia Institute of Technology. The tibia and femur were then harvested and placed in ice-cold Phosphate Buffer Solution (PBS; Corning, 45-000-446). Each bone was then placed in a pierced (19G needle) 0.5 mL microcentrifuge tube inside a 1.5 mL microcentrifuge tube already containing 150 μL of cRPMI (see method above), centrifuged at 4000 x g for 20 seconds, the supernatant was discarded, and the cells were resuspended in 1mL of cRPMI and pooled into a 50 mL conical tube. The pooled solution was centrifuged at 400 × g for 4 minutes, after which the supernatant was removed and the pellet was resuspended in 1 mL of ACK Lysis buffer (Quality Biological, 118-156-721) for 1 minute on ice. The reaction was quenched, and the cells were washed as described previously, resuspended in cRPMI with 20 ng/mL M-CSF (PeproTech®, 315-02-10UG) and filtered through a 70 μm strainer (MACS Strainer). The filtered cell suspension was then transferred, 2 mL per well, to an ultra-low attachment 6-well plate (Corning® Costar®, Ultra-Low attachment). The plate was then left untouched in a humidified incubator maintained at 37 °C with 5% CO₂ for 5 days, at which point 1 mL of the media was replaced with 1 mL of cRPMI + 20 ng/mL M-CSF. On day 7, all cells attached to the plate were considered BMDMs and used in subsequent studies.
Microbubble formulation
Microbubbles (MBs) were prepared according to previously published methods [19,20] by dissolving 1,2-dipalmitoyl-sn-glycero-3-phosphatidylcholine, 1,2-dipalmitoyl-sn-glycero-3-phosphatidylethanolamine–polyethylene glycol 5000, and 1,2-dipalmitoyl-sn-glycero-3-phosphatidic acid (Avanti Polar Lipids, AL, USA) at a molar ratio of 82:10:8 in a solvent mixture of propylene glycol, glycerol, and phosphate-buffered saline (PBS; pH 7.4). An aliquot (1.5 mL) of the lipid solution was transferred to a 2 mL vial (Duran Wheaton Kimble, Germany), degassed, and purged with perfluoropropane gas (Fluoromed, Round Rock, TX, USA) and stored at 4 °C. Immediately prior to use, MBs were activated by mechanical agitation for 45 s using a Vialmix (Lantheus Medical Imaging, North Billerica, MA, USA; see Fig. 1A).
RAW 264.7 macrophage labeling
RAW 264.7 macrophages were seeded overnight in 96-well plates (Falcon, 353072) at 1.0–1.5 × 10⁴ cells / well. On the day following seeding, the cells were washed once with phosphate-buffered saline and replenished with the growth medium described above. Activated MBs (30 µL) were added to each well, after which the plates were sealed with Parafilm (Parafilm, PM996). The plates were then inverted and incubated in a humidified incubator at 37 °C and 5% CO₂ for 2 h. Following co-incubation, the cells were washed twice with PBS and incubated in medium, as indicated in Fig. 1B. For ultrasound imaging experiments, the same protocol was followed, except that 35 mm Petri dishes (Nunc EasYDish; Thermo Fisher Scientific, 150464) were used for MB–macrophage harvesting and ~1.5 × 10⁶ cells were seeded overnight per petri dish.
Optical imaging and radius measurement
Immediately after washing, labeled cells were continuously imaged with an optical microscope (Nikon Ti2, 20× objective). Individual MBs spanning a 0.5 – 2.5 µm size range were manually selected (approximately 10 per biological replicate), cropped, and thresholded to remove background signal while keeping the MBs using ImageJ (version 1.54p). The projected pixel area was quantified over time, and the corresponding pixel radius was calculated according to 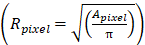 . An averaging filter (n = 10) was applied to each radius trace, and measurements acquired after the first time point at which the radius reached zero were excluded from further analysis.
Microbubble radius modeling
MB radius evolution was modeled using the multigas framework developed by Kwan et al. [14] under the simplifying assumption that  the resistance to gas i permeation through the lipid shell remained constant for all gases. The washing steps were assumed to require approximately 60 seconds; therefore, the experimental data were fitted with a 60-second temporal offset relative to the model. Two parameters were fitted: the initial radius,
 , and the shell resistance parameter,
 defined as
 using the least-squares optimizer lsqnonlin (MATLAB, 2024B). The differential equation [Eq.1] (provided below) was solved using Euler’s method, and for each step, the radius was found by finding the root of [Eq.2] using the Newton-Raphson method. For modeling perfluoro-n-pentane (PFP, C5F12) medium saturation,
 and
 were arbitrarily chosen to create different scenarios.
Perfluoro-n-pentane (PFP)-saturated media preparation
PFP–saturated medium was freshly prepared prior to each experiment. Briefly, 200 µL of PFP (Strem Chemicals, 09-6182) was added to ice-cold PBS to a final volume of 10 mL to obtain an initial concentration of 2% (v/v). The suspension was maintained on ice and sonicated for 10 min (30 s on/30 s off) at 20% amplitude using a microtip (QSonica, 418-A) coupled to a sonicator (QSonica, Q500). The resulting solution was subsequently diluted in growth medium (as described above) to the desired final concentration.
Bafilomycin -A1 treatment
RAW 264.7 macrophages were seeded overnight in a 96-well plate. Bafilomycin A1 (Baf-A1; Cayman Chemical, 11038) was initially diluted in dimethyl sulfoxide (DMSO) to a concentration of 100 µM. The Baf-A1 stock solution was further diluted in cell culture medium to obtain the desired working concentration (200 nM and 1µM) and was co-incubated with the cells for 1 h. The cells were subsequently washed twice with PBS and subjected to the MB labeling procedure as described above.
Cell viability with different concentrations of PFP
RAW 264.7 macrophages were seeded overnight in tissue culture–treated 96-well plates (Corning, 353072) at a density of 1.0×10⁴ cells per well for immediate and 24 h viability assessment. On the following day, the culture medium was replaced with 100 µL of either fresh growth medium or PFP-saturated medium (as described above), and the culture was incubated for 6 h. The cells were subsequently washed once with 200 µL of PBS, after which 100 µL of fresh growth medium was added to each well. One plate was returned to the incubator for viability assessment 24 h later, while the second plate was immediately stained using the ReadyProbes Cell Viability Imaging Kit (NucBlue/NucGreen; Thermo Fisher Scientific) according to the manufacturer’s instructions. The first plate was treated identically and imaged 24 h after PFP removal. Image analysis was performed using ImageJ (version 1.54r). Binary thresholds were automatically determined for each image using the Auto Threshold function. The resulting binary images were processed using the watershed algorithm to separate clustered signals, and the total number of nuclei was quantified. Cell viability was calculated for one 20× image per well as follows: .
Ultrasound imaging in vitro
RAW 264.7 macrophages were seeded overnight, labeled with MBs, and subsequently collected by gently scraping them with a cell scraper (Fisherbrand, #08-100-241). The collected cells were divided into two 1.5 mL microcentrifuge tubes. 100 µL of PBS was added to one tube, and 100 µL of 0.02% (v/v) PFP in PBS was added to the other, resulting in a final PFP concentration of 0.002%. Prior to ultrasound imaging, wells were cast in agarose using a custom-designed mold and subsequently filled with 500 µL of a premixed solution composed of 100 µL of the cell suspension and 400 µL of low–melting-point agarose maintained at 30 °C. The mixture was gently homogenized to ensure uniform cell distribution while minimizing bubble formation. After filling, the wells were placed at 4 °C for 5 min to allow agarose to solidify. Once solidified, Milli-Q water was added atop the agarose constructs. Ultrasound imaging was performed using a L22-14v transducer (Vermon, France) connected to a programmable ultrasound scanner (Verasonics, Vantage). Each well (n = 3 per condition) was imaged in B-mode at 0, 15, 30, 45, 60, 75, 100, 190, 220, and 250 min.
Ultrasound imaging in vivo
Mice were anesthetized with isoflurane and maintained on a heating pad throughout the experiment. Injection catheters (19G needle) were pre-filled with sterile saline prior to insertion, then placed bilaterally either subcutaneously or intratumorally. A Verasonics Vantage 256 system was used with an L22-14v transducer on a three-axis motorized positioner for ultrasound imaging. Ultrasound gel was applied over the injection site, and a water-filled Mylar acoustic window was added on top, allowing probe translation without displacing the animal or creating bubbles in the coupling gel. MB-Mac cells were suspended in a 1:1 mixture of VitroGel and either PBS alone or PBS saturated with 0.02% PFP, yielding a final concentration of 0.01% PFP and 1.5 × 10⁶ cells/100 µL. 100 µL was injected per site, with the two formulations delivered contralaterally in the same animal. Interleaved amplitude-modulation pulse-inversion (AMPI) and B-mode frames were acquired at 1.6 Hz, with settings held constant across animals and groups. Acquisition began before injection to establish baseline and continued until the AMPI signal returned to baseline, or for a minimum of 1 h 15 min (subcutaneous) or 1 h 45 min (intratumoral), whichever occurred later.
Ultrasound imaging in vivo analysis
Beamformed IQ data were reconstructed on a grid with lateral and axial pixel sizes of 0.039 mm and 0.025 mm (PDelta = [0.4, 0.25] λ; c = 1540 m/s, fs = 15.625 MHz). AMPI and B-mode images were overlaid using their indices. A freehand target ROI was drawn on the image covering the region injected with MB-Mac, and a reference ROI was placed at the same depth range and height as the target, so that the target and reference were matched for attenuation and beam profile. For each frame, the mean linear magnitude |IQ| was computed over both ROIs (in the AMPI acquisition), and the signal-to-background ratio was computed  . Each recording's time series ratio was smoothed with a 100-sample moving average and divided by its first value so that all curves start at 1 and are expressed as fold-change relative to the selected start. Curves were then resampled onto a common 5-minute grid by nearest-sample lookup for group comparison.
In vivo tumor model
All animal procedures were performed according to the guidelines of the Public Health Policy on the Humane Care and Use of Laboratory Animals and approved by the Institutional Animal Care and Use Committee of Georgia Institute of Technology. Experimental and control animals were co-housed where appropriate. For all procedures requiring tissue collection, animals were anesthetized with 5% isoflurane and subsequently euthanized by cervical dislocation while under deep anesthesia, in accordance with approved humane endpoints. All in vivo experiments were performed on 8–16 week old female BALB/c mice (000651, The Jackson Laboratory) under protocols approved by the Institutional Animal Care and Use Committee at the Georgia Institute of Technology. To establish a breast tumor model, 2 × 10⁶ 4T1 cells were injected into the posterior upper flank of each mouse on each side and were allowed to grow until they reached a size of approximately 8 mm, which usually took about 10 days from inoculation. The upper flank was chosen to reduce motion artifacts that may arise from breathing. Tumor growth was monitored by caliper measurements every 5 days. The maximum tumor burden permitted by the Institutional Animal Care and Use Committee protocol was a tumor diameter of 1.5 cm in any dimension. All animals were monitored to ensure they remained within this limit. Pre-defined endpoint criteria for early euthanasia to minimize animal distress included reaching the maximum tumor size, weight loss greater than 10%, or the presence of other signs of distress such as hunched posture, reduced activity, or labored breathing. No animals were terminated early due to exceeding these humane endpoints during the imaging study.
Isolation of leukocytes in tissue sample and flow cytometry
To evaluate viability of intratumorally delivered MB-Mac, we performed flow cytometry on harvested tissue samples. Mice were euthanized at a maximum of 4 hours after the last imaging point, and the tumors were collected. The harvested tissues were immediately minced using sterile scalpels. The tissue fragments were then washed with PBS and enzymatically digested with a cocktail of collagenase IV (Worthington, 3.2 mg/mL) and deoxyribonuclease I (Worthington, 1 mg/mL) diluted in sterile PBS. Following digestion, the cells were filtered through a 70 μm cell strainer, washed with sterile PBS, and suspended in 70% Percoll (Cytiva) solution. The suspensions were overlaid with 30% Percoll and HBSS, and subsequently centrifuged for 30 min at 650 × g. Enriched leukocyte populations were recovered at the 70% to 30% Percoll interface and washed with 1xPBS. Flow cytometry staining was performed as follows: single cell suspensions (0.5–1 × 10⁶ cells) from leukocyte-enriched tissue samples were incubated with viability dye (Zombie Aqua, BioLegend) at room temperature for 15 min. Samples were then washed with excess buffer and resuspended in FC buffer (1X PBS, 0.5% FBS, 2 mM EDTA). Cells were then fixed and all samples were analyzed using a Cytek Aurora flow cytometer (Cytek).
Declaration of AI use
Generative artificial intelligence (Opus 4.8, Opus 5.0; Claude, Anthropic) was used to correct grammatical errors and improve text fluency in sections written by non-native English–speaking authors, and to assist in the development of code used for data sorting and processing. All AI-assisted content was reviewed and verified by the authors, and data interpretation was performed solely by the authors.
Results and Discussion
Intracellular microbubble radius dynamics
First, we assessed intracellular half-life of phagocytosed MBs. We observed that phagocytosed MBs with a perfluoropropane (C3F8) gas core had a median half-life of 179 s (Interquartile range 185.5 s; mean 227 ± 158 s) following the washing steps (Fig. 2A–C, n = 31 MBs across 3 biological replicates). The average initial radius of the recorded MBs was 1.06 ± 0.33 μm (Fig. 2D). For the MB radius ranges used and under the conditions tested, our measurements exhibited no significant correlation between initial radius and MB half-life (Spearman's ρ = 0.265, p-value = 0.124, N = 35 across 3 biological replicates; Fig. S1). At the cell level, average half-life was uncorrelated with the initial number of internalized microbubbles (Spearman's ρ = 0.0, p = 0.99, N = 32) but correlated with their summed initial volume (Spearman’s ρ = 0.40, p = 0.022, N = 32 across 3 biological replicates; Fig. S2). Overall, we did not observe consistent trends with bubble radius. These findings suggest that the total gas volume may contribute to MB retention, potentially by increasing the local dissolved gas concentration and thereby reducing the diffusion-driven loss of gas from the remaining intracellular MBs.
Monitoring and modeling of intracellular MB radius dynamic. (A) Live microscopic imaging (20x) of intracellular microbubble dissolution (scale bar: 5 µm, time in minutes: seconds). (B) Intracellular MB radius over time (n=31 split across 3 biological replicates; the abrupt end appears to be due to the resolution limit of the optical microscope, see dotted line). (C) Distribution of microbubble half-life (when the observed radius decreases below 50% of the initial radius). (D) Size distribution of the different initial radius (T=0) observed. (E) Illustration of the MB driving force according to the mathematical modeling (Gas concentration gradient and Laplace pressure). (F) Fitted distribution of  . (G) Simulated radius and MB gas composition evolution with
 µm and
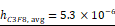 m/s (see Table S1). (H) Microscopic live imaging (60x) illustrating loss of radial symmetry and significant deformation of the lipid shell once internalized MB starts to dissolve.
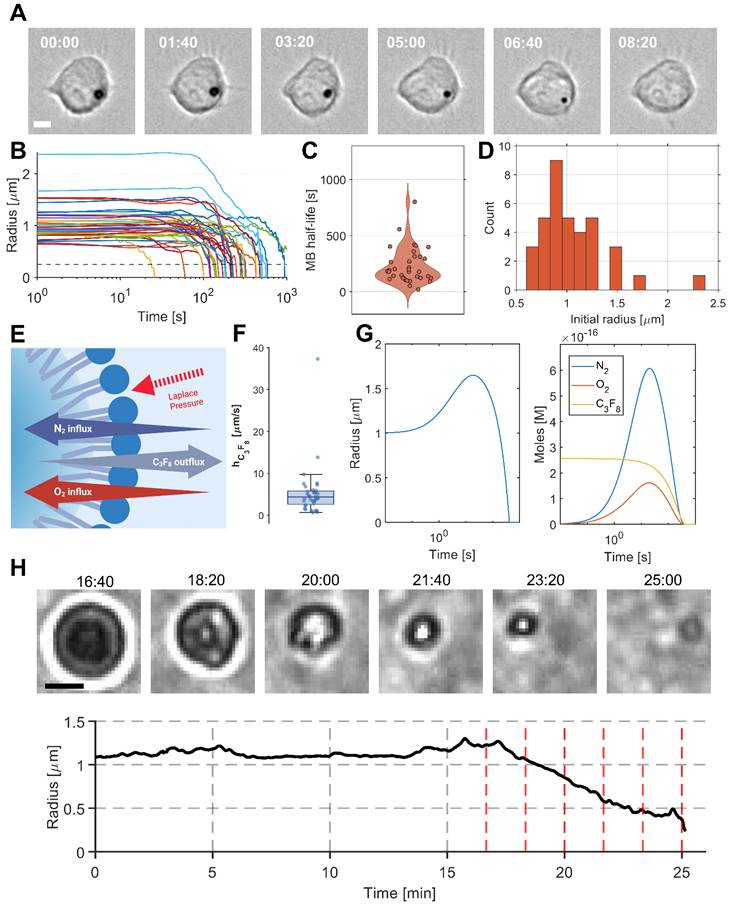
Next, we analyzed dissolution dynamics. We observed two phases during the MB radius decaying process (Fig. 2B, n = 31 across 3 biological replicates): (1) MB radius remained stable (slight oscillation may appear from the MB moving slightly in and out of focus), and (2) a rapid decrease in radius until it became no longer observable. To study this process further, we employed the mathematical framework developed by Kwan et al. [14] that models lipid-shelled MBs in multigas environments. In this model, the temporal evolution of each gas species (i ∈ {N₂, O₂, C₃F₈}, see Fig. 2E) within the MB is described by the following expression:

For each gas species  among N gases,
 is the moles of gas,
 , is the molar Henry constant,
 , is the saturation fraction,
 , is the saturation pressure far from the microbubble,
 , is the resistance to gas permeation through the lipid shell, and
 , is the resistance to gas diffusion through the surrounding media.
 with
 , the surface tension at the MB interface.
We subsequently solved for the MB radius by finding the root of [Eq. 2] closest to the current radius:
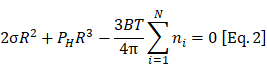
Based on the data collected (Fig. 2B), we were able to fit 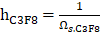 , the permeability of C3F8 through the membrane of the homemade Definity MBs, for each observed MB (see Fig. S3 and S4) and obtained
 m/s (Fig. 2F). We then simulated the evolution of the average MB radius and gas composition (Fig. 2G,
 =1 μm and
 ). The model illustrates a rapid increase in MB radius due to a sudden influx of air (O₂ + N₂) into the MBs during the first minute, followed by a steady decrease. The simulated MB half-life was 303 s, compared to an experimentally measured average of 227 s. The average fitted permeability,
 m/s , is close to that previously reported by Sarkar et al. [13] (
 ), supporting our fitting approach and findings.
While the model predicts an initial MB expansion driven by air (O₂ + N₂) influx, this behavior was not observed experimentally. This discrepancy may arise from several factors: (1) delays introduced by washing excess MBs and replenishing the medium, preventing observation of the first ~60 s of MB evolution; (2) shell mechanical properties, as increased surface tension associated with phospholipid monolayer expansion limits MB growth, as described previously [14,21]; and (3) simplifications in the model, which assume free surrounding media and neglect gas transport and mechanical constraints imposed by the phagosome, cytosol, and cell membrane (Fig. 2E). Loss of spherical symmetry during MB radius decay likely also contributes to deviations between predicted and observed trajectories (see Fig. 2H). Additionally, the narrow initial size distribution increases the sensitivity to experimental variability. Despite these differences, the close agreement between simulated (after fitting) and experimental MB half-lives that were 303s and 227s respectively, suggests that this modeling framework is useful for predicting MB behavior across varying physical and biological parameters. This is further explored in the following section.
PFP-saturated media to stabilize microbubble radius
Next, we hypothesized that the initial diffusion-driven loss of MB core gas could be counteracted by saturating the surrounding medium with PFP, a chemically related perfluorocarbon exhibiting similar physicochemical properties and easier to handle under experimental conditions (see below). To test this hypothesis, we incorporated PFP saturation into the previously described mathematical model by introducing an additional gas species (Fig. 3A). We simulated the temporal evolution of the MB radius for different degrees of PFP saturation. The model predicts that increasing PFP concentration progressively compensates for the reduction in MB radius (Fig. 3B-C) and replaces C₃F₈ as the dominant core gas with a C₅F₁₂-rich mixture (Fig. S5). As C₅F₁₂ becomes the dominant gas, its lower permeability through the MB lipid shell [13] could contribute to the longer-term MB stability. Depending on the saturation level, PFP influx either attenuates the rate of radius decrease, halts deflation, or reverses the process, ultimately leading to MB growth.
Evaluation of PFP-saturated media on intracellular MB radius and RAW 264.7 Macrophage Viability. (A) Illustration of the MB driving force according to the mathematical modeling (Gas concentration gradient and Laplace pressure). (B) Simulated radius evolution while varying  the saturation coefficient of the C₅F₁₂gas in the media (
 = 1 µm,
 and (C) gas composition for
 (see Table S2). (D) Live microscopy imaging (20x) of MB-labeled macrophage with PFP-saturated media (PFP concentration = 0.02%). (E) From top to bottom row, live microscopy imaging (20x) of MB-Mac with 0.002% PFP in media, 0.0002% PFP in media and control media. (F) RAW 264.7 macrophages viability following 6 hours co-incubation with PFP-saturated media (0.2%, 0.02%, 0.002%) (left: just after the co-incubation, right: 24 hours after the co-incubation, n = 5 wells for all conditions). (G) Number of RAW 264.7 macrophages right after co-incubation (left) vs 24 hours after (right). No significant differences were observed between control (Media) and the other groups. Data are presented as mean values +/- SD. P values were determined by a one-way ANOVA followed by Dunnett correction for multiple comparisons.
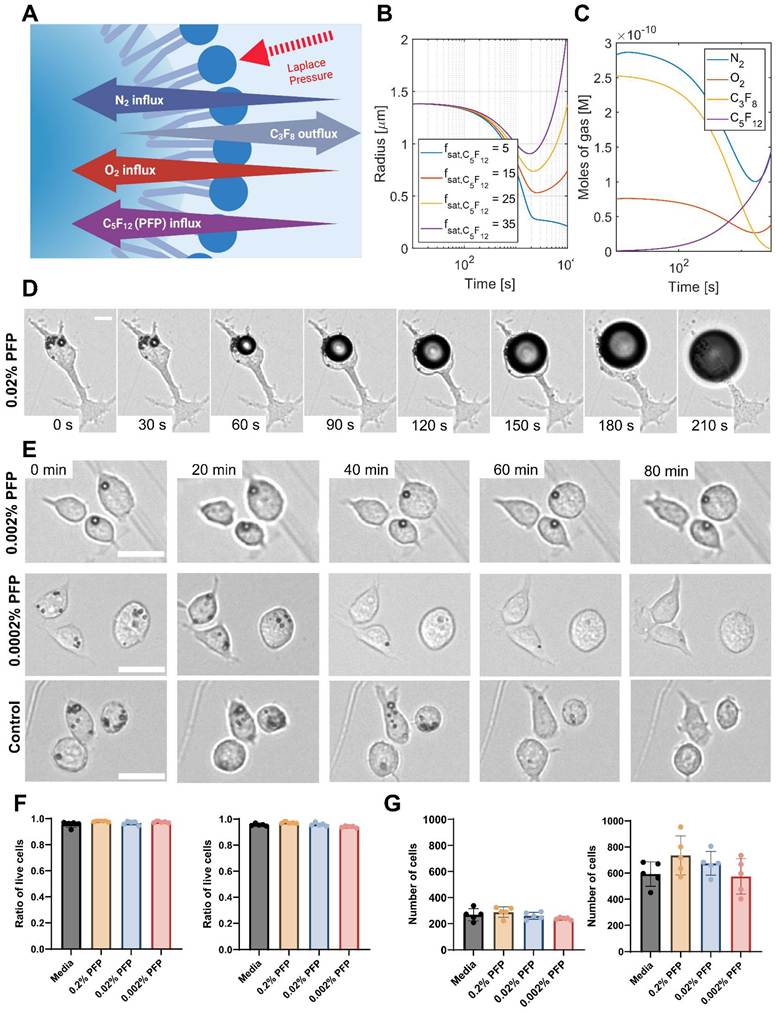
To test this behavior experimentally we exposed MB–labeled macrophage samples to PFP-saturated media at concentrations ranging from 0.0002% to 0.02% PFP-media ratio. While saturating the medium with perfluoropropane (C₃F₈), the same gas as the MB core, would in principle directly counteract diffusion of gas out of the MBs, its low boiling point (-36.6 °C) makes it experimentally challenging to handle, motivating the use of PFP instead. We assumed that when MB-labeled macrophages are immersed in freshly saturated media, PFP will diffuse gradually, partially compensating for the loss of the original gas core. Under this assumption, at high oversaturated PFP concentrations, we observed rapid MB growth (Fig. 3D). At intermediate concentrations, PFP saturation effectively halted MB radius decrease, while at low PFP concentrations, no measurable effect on MB size was detected compared to the control (Fig. 3E).
Although PFP has been reported to be biologically inert, we confirmed that the concentrations used in this study did not adversely affect cell viability or proliferation. Cell viability remained above 90% for all conditions immediately after co-incubation and 24 h following co-incubation (Fig. 3F). In addition, RAW 264.7 macrophages exhibited a twofold increase in cell number over 24 h, with no statistically significant difference compared to cells in control medium (Fig. 3G). We further confirmed these results with bone marrow-derived macrophages (BMDMs). We did not observe significant differences in viability between the control group and the various PFP concentrations after 6 hours or 24 hours of co-incubation (Fig. S6). Overall, these results demonstrate that the composition of the surrounding gas environment is a key determinant of MB stability, directly influencing MB dissolution, stabilization, or growth.
Digestion vs diffusion
To assess whether enzymatic degradation of the lipid shell contributes to the decrease in MB radius following cellular internalization, we designed an experimental framework to decouple biological digestion from diffusion-driven gas loss. To probe these two mechanisms independently and in combination, we monitored MB-labeled macrophages over time under the following four conditions: (1) MB-labeled cells alone, serving as a baseline; (2) MB-labeled cells in the presence of bafilomycin A1 (Baf-A1), a specific vacuolar H⁺-ATPase inhibitor used to reduce lysosomal acidification and enzymatic digestion of internalized MBs; (3) MB-labeled cells in 0.002% PFP–saturated medium, where the PFP concentration was tuned to compensate for perfluoropropane (C3F8) efflux from the microbubble core and thus inhibit diffusion-driven deflation; and (4) a combination of PFP and Baf-A1 to assess potential cooperative effects. Lysosomal inhibition by Baf-A1 was confirmed using pHrodo as a readout of endolysosomal acidification, in combination with zymosan to ensure that phagocytic activity was taking place. RAW 264.7 and BMDMs pre-treated with Baf-A1 (200 nM or 1µM, 1h) showed an almost 2-fold lower pHrodo signal than cells treated with a vehicle control, confirming effective inhibition (Fig. S7).
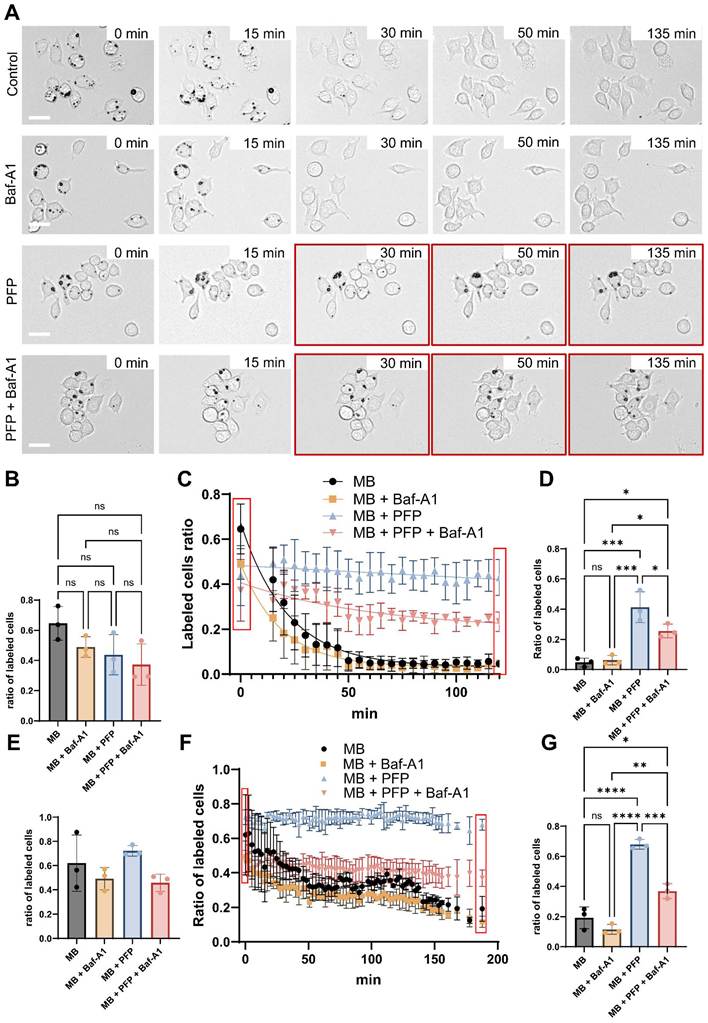
Our observations indicate that gas diffusion is the dominant mechanism driving MB radius decrease over the investigated time scale in RAW 264.7 (Fig. 4A–D), as stabilizing the gas core via PFP influx prolonged MB persistence significantly more than inhibiting enzymatic activity with Baf-A1 alone (41.3% vs 6.2% respectively of remaining labeled cells after 125 min; p-value = 0.0004). Although residual enzymatic activity cannot be entirely ruled out, this comparatively modest effect of Baf-A1 indicates that diffusion-driven gas loss, rather than lipid shell digestion, drives MB dissolution over the measured time window. These results were further investigated and confirmed with BMDMs (Fig. 4 E-G, Fig. S8). For the same PFP concentration (0.002% (v/v)), we observed some sparse MB growth potentially indicating that the PFP concentration may need to be fine-tuned for different batches of MBs or targeted cells. The difference between PFP and Baf-A1+ PFP at the final time point may reflect weaker initial labeling for the Baf-A1 + PFP group. Consistent with this, we did not observe a significant difference in the ratio of labeled cells between the initial and the final time points for either group (Fig. S8). Notably, exposure to Baf-A1 or its DMSO vehicle has been reported to partially interfere with the phagocytic pathway, which may have contributed to the reduced initial labeling observed in the Baf-A1 + PFP group [22].
Decoupling gas diffusion from enzymatic digestion. (A) Live microscopy imaging (20x) with 4 different conditions. By row, from top to bottom, MB only (control), MB + Baf-A1 (digestion process stopped), MB + PFP (PFP concentration: 0.002%, compensates for initial diffusion of core gas), MB + Baf-A1 + PFP. (B) Initial (T= 0 min) quantification of the ratio of labeled RAW 264.7 for each condition, n = 3 wells. No significant differences were observed between any of the groups. (C) Evolution of the proportion of labeled RAW 264.7 through time for each condition, n = 3 wells. (D) Final (T= 125 min) quantification of the ratio of labeled RAW 264.7 for each condition, n = 3 wells. (E) Initial (T= 0 min) quantification of the ratio of labeled BMDMs for each condition, n = 3 wells. No significant differences were observed between any of the groups. (F) Evolution of the proportion of labeled BMDMs through time for each condition, n = 3 wells. (G) Final (T= 188 min) quantification of the ratio of labeled BMDMs for each condition, n = 3 wells. Data are presented as mean values +/- SD. P values were determined by a one-way ANOVA followed by Tukey's correction for multiple comparisons. n.s. - not significant. * P ≤ 0.05, ***P ≤ 0.001.
While these findings are encouraging, additional investigations across distinct polarization states, spanning pro-inflammatory (M1-like) to anti-inflammatory (M2-like) phenotypes are needed. Such models may reveal phenotype-dependent differences in phagolysosomal processing and membrane remodeling, thereby enabling a deeper understanding of how the functional state of macrophages influences MB fate in vivo.
Effect of PFP on ultrasound imaging
We further corroborated the prolonged lifetime of MBs in PFP-saturated media using ultrasound imaging. Briefly, we harvested MB-labeled cells and divided them into two groups: a control group supplemented with PBS and the group of interest supplemented with PFP-saturated medium. We subsequently embedded the cells in low–melting-point agarose to keep them static and imaged them using ultrasound at multiple time points (Fig. 5A). We also imaged control samples consisting of PFP-saturated medium alone to verify that the enhanced echogenicity did not arise from spontaneous vaporization of PFP into MBs (Fig. S9).
Assessment of the echogenicity of naive vs PFP-saturated internalized microbubbles. (A) Schematic illustration of the experimental setup. (B) Evolution of the average intensity of labeled cells through time for each condition, n = 3 wells. (C) Ultrasound imaging of MB Only and MB + PFP cells across time. (D) Half-life from each condition. Imaging frequency 15.625 MHz, MI (B-Mode) < 0.08. Half-life values were derived from global nonlinear regression (one-phase exponential decay). Data are presented as mean values and 95% confidence intervals. Statistical comparison was performed on the decay rate constant (k) using an extra sum-of-squares F test; p < 0.0001.
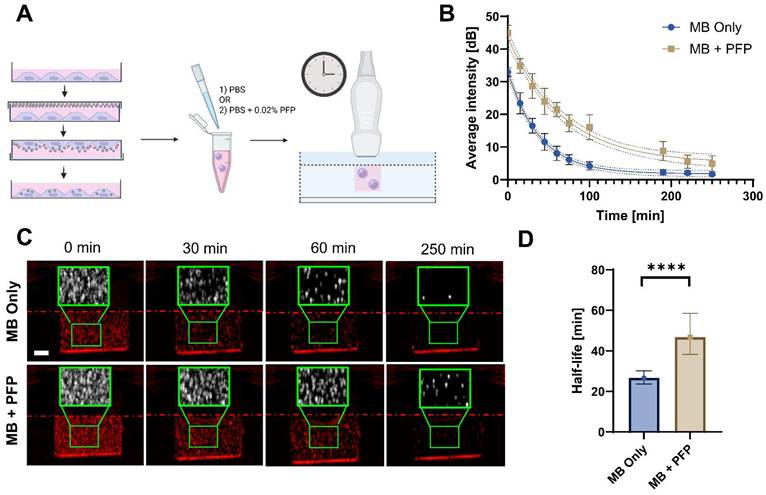
Consistent with our previous findings, cells maintained in PFP-saturated medium (0.002%) exhibited a markedly higher echogenicity throughout the entire measurement period, from the initial time point to the end of the imaging timeline (Fig. 5B–C), compared to controls. We fitted signal decay curves using a one-phase exponential model, from which we estimated apparent half-lives with  . This analysis revealed a significant improvement in US persistence in PFP-treated samples relative to controls (approximately 40 min versus 20 min, respectively – Fig. 5D; p < 0.0001). These data demonstrate that the improved MB retention observed in optical measurements leads to improved US signal persistence. Together, these findings further support our observation that extracellular gas saturation improves intracellular MB stability by mitigating gas core diffusion.
In vivo confirmation of sustained MB–labeled macrophage echogenicity
To validate our technique in vivo, we first used a subcutaneous model. We subcutaneously injected mice with a VitroGel suspension containing 1.5 ×  MB-Mac with either a final concentration of 0.01% (v/v) PFP or PBS (n = 3 per condition, Fig. 6B). We continuously imaged the animals using amplitude modulation pulse inversion (AMPI) and B-mode (Fig. S10) for 75 min, or until the microbubble AMPI signal was no longer visible. We observed a clear AMPI signal immediately post-injection in both conditions, confirming successful delivery (Fig. 6A). We observed a steady decline in the signal in the PBS group (Fig. 6C) and a significant decrease between initial and final measurements in comparison to the PFP group at the same timepoint (
 = 15 minutes; Fig. 6D). In contrast, PFP-saturated MB-Mac remained close to the initial (i.e., immediately after injection) level even after 1 hour, exhibiting no significant difference between initial and final measurements (
 = 75 minutes; Fig. S11A). We imaged 0.02% PFP-saturated PBS alone and confirmed that it was not responsible for the increased echogenicity following the injection, as no increase in signal-to-background ratio (SBR) was observed pre- vs post-injection (n = 4, Fig. S12). Hence, we confirmed that PFP saturation generated sustained contrast of MB-Mac in vivo, consistent with our in vitro observations.
Assessment of the echogenicity of naive vs PFP-saturated internalized microbubbles in vivo. (A) Longitudinal AMPI signal overlaid on B-mode for subcutaneously injected MB-Mac either suspended in PBS alone (PBS) versus PFP-saturated PBS (PFP). Imaging frequency 15.625 MHz, MI (B-Mode) < 0.08; MI (AMPI) = 0.08. (B) Schematic describing the subcutaneous injection. VitroGel is shown in blue. (C) Normalized Signal-to-Background ratio (SBR) of MB-Mac injected subcutaneously in vivo, suspended in either PBS alone (PBS) or PFP-saturated PBS (PFP), over time (n = 3 per condition), normalized to first value in the time series (see Fig. S13 for ROI definitions). (D) Statistical comparison between SBR at T = 0 min and T = 15 min for PBS and PFP-saturated groups injected subcutaneously. (E) Longitudinal AMPI signal overlaid on B-mode for intratumorally injected MB-Mac either suspended in PBS alone (PBS) versus PFP-saturated PBS (PFP). Dashed red line represents the needle. Imaging frequency 15.625 MHz, MI (B-Mode) < 0.08; MI (AMPI) = 0.08) (F) Schematic describing the intratumoral injection. VitroGel is shown in blue. (G) Normalized SBR of MB-Mac injected intratumorally in vivo, suspended in either PBS alone (PBS) or PFP-saturated PBS (PFP), over time (n = 4 per condition), normalized to first value in the time series (see Fig. S14 for ROI definitions). (H) Statistical comparison between SBR at T = 0 min and T = 25 min for PBS and PFP-saturated groups injected intratumorally. Data are presented as mean values ± SD. p values were determined by 2-way ANOVA followed by Tukey correction for multiple comparisons. *p < 0.05; n.s. not significant.
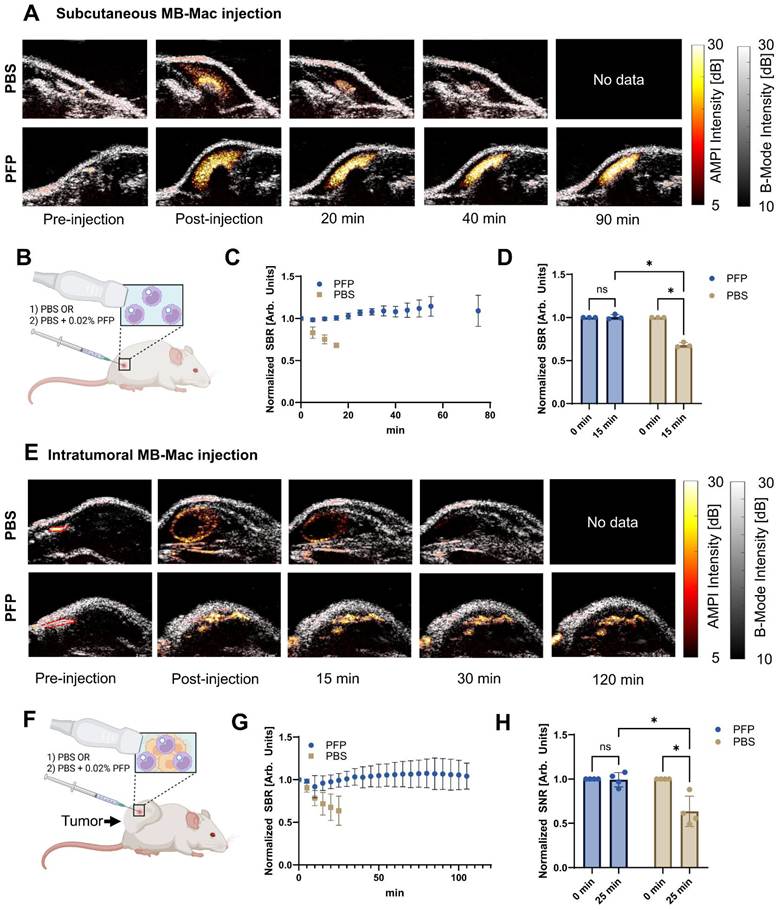
We next asked whether this extended observation window could help with known challenges of intratumoral delivery. In stiff tumors in particular, intratumorally injected immune cells distribute poorly within the tumor, leak into surrounding tissue due to elevated interstitial pressure, and backflow along the needle track [23,24]. We therefore repeated the experiment in subcutaneous 4T1 tumors (n = 4 per condition, Fig. 6E-F), which are known for their stiffness and increased interstitial pressure [25]. We observed very similar trends to the subcutaneous experiment, where the PBS group showed a rapid (Fig. 6G) and significant signal decline between initial and final measurements and in comparison to the PFP group at the same timepoint ( = 25 minutes; Fig. 6H). On the other hand, the PFP-saturated group showed stable signal over the entire imaging period with no significant difference between initial and final observation time point in our study (
 = 105 minutes; Fig. S11B). The main difference from the subcutaneous group was the spatially heterogeneous distribution of MB-Mac imposed by the stiffness of the tumors over the 2-hour imaging period (Video S1). As anticipated, in these investigations we observed backflow along the injection track (Video S2) and MB-Mac leaking outside the tumor during the injection (Video S3), reinforcing the practical need for monitoring immune cell delivery over time. Finally, we harvested the tumors and assessed the viability of the intratumorally injected MB-Mac via flow cytometry and did not find any significant differences between the PFP-saturated and control group. By extending the observation window from minutes to hours, our method enables monitoring of intratumoral delivery of immune cells within a more biologically relevant timeframe.
Together, these data demonstrate that the principles established in our in vitro studies translate to an in vivo setting, extending our findings beyond in vitro characterization and supporting the utility of the approach for monitoring cell therapy delivery and retention in a clinically relevant context.
Conclusions
In this study, we quantitatively tracked the decrease of MB radius following macrophage internalization, estimated the resistance of the lipid shell to diffusion of the perfluoropropane (C3F8) core gas, and found close agreement between the extracted parameters and previously reported values [13]. We further examined the contribution of enzymatic degradation to MB radius evolution and established experimental protocols to decouple core gas diffusion from lysosomal digestion. Our results suggest that, over the investigated timescale (≈ 2 hours), reducing enzymatic activity does not significantly extend MB half-life relative to untreated controls, whereas compensating for core gas diffusion stabilizes the microbubble radius, supporting the notion that gas diffusion is the dominant mechanism governing MB dissolution on the timescale of several hours. Further characterization of microbubble dissolution is needed to determine whether the dominant mechanism of MB degradation shifts from diffusion to digestion at later time points (i.e., only after 4h post-ingestion) as reported in previous published work characterizing the degradation of internalized gas vesicles by macrophages [26]. To the best of our knowledge, this work represents the first quantitative investigation of intracellular microbubble stability and degradation pathways.
The dissolved gas-mediated stabilization aligns with previous work investigating the impact of dissolved gas on microbubble condensation [27]. While absolute MB half-life varied between experiments due to batch-to-batch variability, strong consistency was observed within individual batches. Importantly, the measured radius dynamics agree well with previously reported multigas diffusion models [15]. Although the modeling framework we employed was an essential tool to assess the effect of saturating media with other gases, future work could focus on radius-dependent shell properties and explicitly account for interactions with the intracellular environment. This work also suggests that engineering MBs with gas cores exhibiting slower diffusion kinetics [13], combined with shell designs that enhance gas retention and resistance to intracellular dissolution, may substantially increase intracellular retention and provide a viable strategy for prolonging MB persistence and ultrasound contrast for longitudinal cell tracking in vivo following intravenous delivery.
In the current study, we leveraged these findings to develop a strategy to prolong MB lifetime by oversaturating the surrounding medium with PFP. The prolonged persistence of MB–labeled macrophages observed by optical microscopy was independently validated by enhanced and more sustained echogenicity in ultrasound measurements for samples in PFP-saturated media, as compared to controls. We further confirmed these results in vivo, showing no decline of AMPI signals up to 2 hours (i.e., observation duration in our study) for MB-Mac with PFP after intratumoral injection compared to a fast decline for the control group. This work has direct potential applications in image-guided immunotherapy, where intratumorally injected immune cells may distribute unevenly within the tumor, leak into surrounding tissues, or backflow along the needle track, potentially reducing therapeutic efficacy and resulting in off-target effects [23,24].
Taken together, these findings provide new insights into the fate of internalized MBs and establish key principles for attaining and extending the half-life of intracellular acoustic reporters. More generally, this work lays the foundation for improving ultrasound-based cell-tracking strategies and expanding their temporal imaging window.
Supplementary Material
Supplementary figures and tables, video legends.

Supplementary video 1.
Supplementary video 2.
Supplementary video 3.
Acknowledgements
This study was supported by the NIH/NIBIB Grant R21EB037352 (C.A.), Singh Family Fellow Award (Y.F.), Dan and Lou Jordan Focused Ultrasound Internship (A.H.), and the Petit Scholars Program (Y.F., A.H.). Y.F. acknowledges the use of Claude (Opus 4.8, Opus 5.0) to assist with grammatical correction and improvement of text, and to facilitate the development of data-processing code.
Author contributions
C.A., Y.F. and A.H. conceptualized the experiments. Y.F. and A.H. performed the experiments. Y.F. conducted formal analysis, curated the data, and prepared the figures. A.K., P.A., J.B. contributed to materials/methods. Y.F. and C.A. wrote the original draft. All authors reviewed and approved the final version.
Data availability
All data are included in the manuscript or supporting information. Additional raw datasets are available upon reasonable request to the corresponding author.
Competing Interests
The authors have declared that no competing interest exists.
References
1. Upadhyay A, Dalvi SV. Microbubble Formulations: Synthesis, Stability, Modeling and Biomedical Applications. Ultrasound Med Biol. 2019Feb1;45(2):301-43 doi:10.1016/j.ultrasmedbio.2018.09.022 PubMed PMID: 30527395
2. Szabo TL. Ultrasound Contrast Agents. In: Diagnostic Ultrasound Imaging: Inside Out. Elsevier. 2014
3. Frinking P, Segers T, Luan Y, Tranquart F. Three Decades of Ultrasound Contrast Agents: A Review of the Past, Present and Future Improvements. Ultrasound Med Biol. 2020Apr;46(4):4 doi:10.1016/j.ultrasmedbio.2019.12.008
4. Klibanov AL. Ultrasound Contrast Agents: Development of the Field and Current Status. In: Krause W, editor. Contrast Agents II: Optical, Ultrasound, X-Ray and Radiopharmaceutical Imaging [Internet]. Berlin, Heidelberg: Springer; 2002 [cited. 2026 Mar 3]. p. 73-106. Available from: https://doi.org/10.1007/3-540-46009-8_3 doi:10.1007/3-540-46009-8_3
5. Christensen-Jeffries K, Couture O, Dayton PA, Eldar YC, Hynynen K, Kiessling F. et al. Super-resolution ultrasound imaging. Ultrasound Med Biol. 2020Apr;46(4):865-91 doi:10.1016/j.ultrasmedbio.2019.11.013 PubMed PMID: 31973952; PubMed Central PMCID: PMC8388823
6. Demené C, Robin J, Dizeux A, Heiles B, Pernot M, Tanter M. et al. Transcranial ultrafast ultrasound localization microscopy of brain vasculature in patients. Nat Biomed Eng. 2021Mar1;5(3):219-28 doi:10.1038/s41551-021-00697-x PubMed PMID: 33723412; PubMed Central PMCID: PMC7610356
7. Errico C, Pierre J, Pezet S, Desailly Y, Lenkei Z, Couture O. et al. Ultrafast ultrasound localization microscopy for deep super-resolution vascular imaging. Nature. 2015Nov26;527(7579):499-502 doi:10.1038/nature16066 PubMed PMID: 26607546
8. Cui W, Tavri S, Benchimol MJ, Itani M, Olson ES, Zhang H. et al. Neural progenitor cells labeling with microbubble contrast agent for ultrasound imaging in vivo. Biomaterials. 2013Jul1;34(21):4926-35 doi:10.1016/j.biomaterials.2013.03.020
9. Alva A, Kim C, Premdas P, Ferry Y, Lee H, Lal N. et al. Imaging of macrophage accumulation in solid tumors with ultrasound. Nat Commun. 2025Jul9;16(1):6322 doi:10.1038/s41467-025-61624-1
10. Wang XQ, Danenberg E, Huang CS, Egle D, Callari M, Bermejo B. et al. Spatial predictors of immunotherapy response in triple-negative breast cancer. Nature. 2023Sep;621(7980):868-76 doi:10.1038/s41586-023-06498-3
11. Park KS, Gottlieb AP, Janes ME, Prakash S, Kapate N, Suja VC. et al. Adoptively transferred macrophages for cancer immunotherapy. J Immunother Cancer. 2025May24;13(5):e010437 doi:10.1136/jitc-2024-010437 PubMed PMID: 40413021; PubMed Central PMCID: PMC12104917
12. Boyajian RA, Otis SM. Continuous Infusion Versus Bolus Injection Of Ultrasound Contrast Agents in Vascular Doppler Flow Imaging. Stroke. 2000Sep;31(9):2266-78 doi:10.1161/01.STR.31.9.2266-l
13. Sarkar K, Katiyar A, Jain P. Growth and Dissolution of an Encapsulated Contrast Microbubble: Effects of Encapsulation Permeability. Ultrasound Med Biol. 2009Aug;35(8):8 doi:10.1016/j.ultrasmedbio.2009.04.010
14. Kwan JJ, Borden MA. Lipid monolayer dilatational mechanics during microbubble gas exchange. Soft Matter. 2012;8(17):4756 doi:10.1039/c2sm07437k
15. Kwan JJ, Borden MA. Microbubble Dissolution in a Multigas Environment. Langmuir. 2010May4;26(9):6542-8 doi:10.1021/la904088p
16. Duncan PB, Needham D. Test of the Epstein-Plesset Model for Gas Microparticle Dissolution in Aqueous Media: Effect of Surface Tension and Gas Undersaturation in Solution. Langmuir. 2004Mar1;20(7):2567-78 doi:10.1021/la034930i
17. Dayton PA, Chomas JE, Lum AFH, Allen JS, Lindner JR, Simon SI. et al. Optical and Acoustical Dynamics of Microbubble Contrast Agents inside Neutrophils. Biophys J. 2001Mar1;80(3):1547-56 doi:10.1016/S0006-3495(01)76127-9
18. Bioley G, Bussat P, Lassus A, Schneider M, Terrettaz J, Corthésy B. The phagocytosis of gas-filled microbubbles by human and murine antigen-presenting cells. Biomaterials. 2012Jan;33(1):333-42 doi:10.1016/j.biomaterials.2011.09.045
19. Li S, Chen C, Lof J, Stolze EA, Sklenar J, Chen X. et al. Acoustic Activation Imaging with Intravenous Perfluoropropane Nanodroplets Results in Selective Bioactivation of the Risk Area. J Ultrasound Med Off J Am Inst Ultrasound Med. 2024Jun;43(6):1063-80 doi:10.1002/jum.16435 PubMed PMID: 38440926; PubMed Central PMCID: PMC11093707
20. Zeng P, Chen C, Lof J, Stolze E, Li S, Chen X. et al. Acoustic Detection of Retained Perfluoropropane Droplets within the Developing Myocardial Infarct Zone. Ultrasound Med Biol. 2022Nov;48(11):2322-34 doi:10.1016/j.ultrasmedbio.2022.07.005 PubMed PMID: 36050231; PubMed Central PMCID: PMC9547398
21. Marmottant P, van der Meer S, Emmer M, Versluis M, de Jong N, Hilgenfeldt S. et al. A model for large amplitude oscillations of coated bubbles accounting for buckling and rupture. J Acoust Soc Am. 2005Dec1;118(6):3499-505 doi:10.1121/1.2109427
22. Bidani A, Heming TA. Effects of bafilomycin A1 on functional capabilities of LPS-activated alveolar macrophages. J Leukoc Biol. 1995Feb1;57(2):275-81 doi:10.1002/jlb.57.2.275
23. Sheth RA, Murthy R, Hong DS, Patel S, Overman MJ, Diab A. et al. Assessment of Image-Guided Intratumoral Delivery of Immunotherapeutics in Patients With Cancer. JAMA Netw Open. 2020Jul29;3(7):e207911 doi:10.1001/jamanetworkopen.2020.7911
24. Muñoz NM, Williams M, Dixon K, Dupuis C, McWatters A, Avritscher R. et al. Influence of injection technique, drug formulation and tumor microenvironment on intratumoral immunotherapy delivery and efficacy. J Immunother Cancer. 2021Feb;9(2):e001800 doi:10.1136/jitc-2020-001800
25. Riegler J, Labyed Y, Rosenzweig S, Javinal V, Castiglioni A, Dominguez CX. et al. Tumor Elastography and Its Association with Collagen and the Tumor Microenvironment. Clin Cancer Res. 2018Sep14;24(18):4455-67 doi:10.1158/1078-0432.CCR-17-3262
26. Ling B, Lee J, Maresca D, Lee-Gosselin A, Malounda D, Swift MB. et al. Biomolecular Ultrasound Imaging of Phagolysosomal Function. ACS Nano. 2020Sep22;14(9):12210-21 doi:10.1021/acsnano.0c05912
27. Mountford PA, Sirsi SR, Borden MA. Condensation Phase Diagrams for Lipid-Coated Perfluorobutane Microbubbles. Langmuir. 2014Jun3;30(21):6209-18 doi:10.1021/la501004u
Author contact
Corresponding author: Costas Arvanitis, Email: costas.arvanitisedu.