Impact Factor




Theranostics 2027; 17(1):646-670. doi:10.7150/thno.133941 This issue Cite
Research Paper
HIF-1α–SHMT-driven serine catabolism protects glioblastoma from ferroptosis in the serine/glycine-restricted brain microenvironment
Hye Jin Yun1*, Bongjun Kim2*, Eun Bin Lee1, Su Hwan Park1, Eun Hee Ko1, Rui Liu3, Seong-il Eyun4, Kyu Heo5, Ji Young Yoo6,7  , Yun-Yong Park8 , Silu Wang9,10 , Jong-Ho Lee1,11
1. Department of Health Sciences, The Graduate School of Dong-A University, Busan, 49315, Republic of Korea.
2. School of Biological Sciences and Technology, College of Natural Sciences, Chonnam National University, Jeonnam-Gwangju, 61186, Republic of Korea.
3. State Key Laboratory of Oral Diseases, National Clinical Research Center for Oral Diseases, Chinese Academy of Medical Sciences Research Unit of Oral Carcinogenesis and Management, West China Hospital of Stomatology, Sichuan University, Chengdu, Sichuan, 610041, China.
4. Department of Life Science, Chung-Ang University, Seoul, 06974, Republic of Korea.
5. Research Center, Dongnam Institute of Radiological & Medical Sciences, Busan, 46033 Republic of Korea.
6. Department of Neurosurgery, McGovern Medical School, The University of Texas Health Science Center at Houston, Houston, TX, 77030, USA.
7. The University of Texas MD Anderson Cancer Center UTHealth Houston Graduate School of Biomedical Science, Houston, Texas, USA.
8. Department of Innovative Pharmaceutical Sciences and Engineering, Inje University, Gimhae 50834, Republic of Korea.
9. Central Laboratory of the Medical Research Center, The First Affiliated Hospital of Ningbo University, Ningbo, Zhejiang, China; Ningbo Clinical Research Center for Urological Disease, Ningbo, Zhejiang, 315010, China.
10. Key Laboratory of Diagnosis and Treatment of Severe Hepato-Pancreatic Diseases of Zhejiang Province, The First Affiliated Hospital of Wenzhou Medical University, Wenzhou Medical University, Wenzhou, Zhejiang, 325000, China.
11. Department of Biomedical Sciences, Dong-A University, Busan, 49315, Republic of Korea.
* These authors equally contributed.
Received 2026-3-5; Accepted 2026-10-24; Published 2027-1-1
Abstract
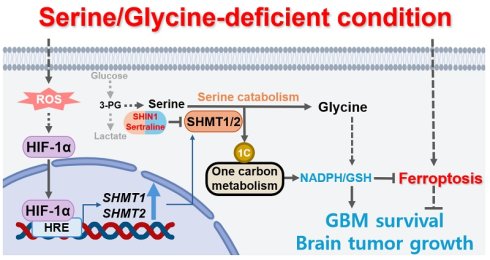
Rationale: Serine metabolism is frequently rewired in cancer, yet how serine catabolism supports glioblastoma (GBM) adaptation to restricted serine/glycine (S/G) availability remains unclear. In particular, the expression, regulation, and function of cytosolic serine hydroxymethyltransferase 1 (SHMT1) and mitochondrial SHMT2 under S/G restriction are poorly defined.
Methods: Single-cell and bulk transcriptomic datasets and clinical GBM specimens were analyzed to assess SHMT1/2 expression and clinical correlations. Hypoxia-inducible factor-1α (HIF-1α)-dependent transcriptional regulation of SHMT1/2 was investigated using promoter and chromatin immunoprecipitation analyses. Genetic depletion of SHMT1/2 and pharmacological SHMT targeting were used to evaluate redox homeostasis, oxidative stress, ferroptosis-associated phenotypes (Fe²⁺, lipid peroxidation, 4-HNE), GBM cell growth in vitro, and tumor growth in vivo.
Results: S/G deprivation induced oxidative stress and ferroptosis-associated cell death, accompanied by robust upregulation of SHMT1/2. SHMT1/2 were overexpressed in GBM and associated with malignant features and poor prognosis. Mechanistically, S/G restriction activated reactive oxygen species (ROS)-dependent HIF-1α, which promoted SHMT1/2 transcription through direct promoter binding. Functionally, the HIF-1α–SHMT1/2 axis supported serine catabolism to generate glycine and one-carbon units, sustaining NADPH/glutathione redox balance and limiting ferroptotic damage under S/G-restricted conditions. Genetic or pharmacological disruption of SHMT1/2 impaired redox homeostasis, increased ferroptosis-associated lipid damage, and reduced GBM cell viability in vitro, while suppressing tumor growth and prolonging survival in vivo. SHMT1/2 expression positively correlated with HIF-1α in single-cell and bulk GBM specimens, further supporting the clinical relevance of this regulatory axis.
Conclusions: Our findings identify HIF-1α–SHMT1/2–driven serine catabolism as a metabolic adaptation that supports redox homeostasis and ferroptosis resistance in GBM under restricted S/G availability. Disrupting this pathway compromises redox defense and suppresses GBM growth, highlighting SHMT-dependent serine catabolism as a potential metabolic vulnerability in GBM.
Keywords: glioblastoma, SHMT, HIF-1α, serine catabolism, ferroptosis
Introduction
Metabolic reprogramming is a hallmark of cancer that enables tumor cells to meet the increased energetic and biosynthetic demands required for sustained proliferation and tumor growth [1, 2]. During tumor development, metabolic pathways are dynamically remodeled in response to both genetic alterations and tissue-specific features of the tumor microenvironment [3]. These metabolic adaptations are particularly important under adverse microenvironmental conditions, including nutrient limitation and hypoxia, where cancer cells must maintain metabolic homeostasis despite restricted availability of essential nutrients and oxygen. Accordingly, metabolic plasticity represents a critical mechanism by which cancer cells adapt to microenvironmental stress. However, the specific metabolic programs that support this adaptation and the therapeutic vulnerabilities that arise from their dependence on these programs remain incompletely understood.
Cellular serine availability is maintained through extracellular uptake and de novo biosynthesis via the serine synthesis pathway (SSP), in which the glycolytic intermediate 3-phosphoglycerate (3-PG) is sequentially converted to serine by phosphoglycerate dehydrogenase (PHGDH), phosphoserine aminotransferase (PSAT1), and phosphoserine phosphatase (PSPH) [4, 5]. Beyond its biosynthesis, serine is catabolized by serine hydroxymethyltransferases (SHMTs), comprising the cytosolic isozyme SHMT1 and the mitochondrial isozyme SHMT2, to generate glycine and one-carbon units [4, 5]. As a non-essential amino acid, serine contributes to one-carbon metabolism and supports multiple cellular processes, including nucleotide biosynthesis, nicotinamide adenine dinucleotide phosphate (NADPH)- and glutathione (GSH)-dependent redox homeostasis, and methylation reactions [4-6]. Accordingly, SHMT-dependent serine catabolism has been increasingly implicated in cancer-associated metabolic reprogramming. Glioblastoma (GBM) is the most aggressive primary brain tumor and remains associated with poor prognosis [7]. Of particular relevance to GBM, the availability of serine and glycine differs between the central nervous system and systemic circulation, with lower concentrations reported in human cerebrospinal fluid than in the systemic circulation [8-10]. Relatively limited S/G availability has also been demonstrated in the mouse brain microenvironment [11, 12], indicating that brain tumors develop within a distinct nutrient environment that may impose selective metabolic demands. Despite the established importance of serine metabolism in cancer, how GBM cells engage and regulate SHMT-mediated serine catabolism in response to the relatively restricted S/G availability of the brain microenvironment remains unclear.
Ferroptosis is a regulated form of cell death driven by iron-dependent lipid peroxidation and is mechanistically distinct from apoptosis, necroptosis, and pyroptosis [13, 14]. A central defense against ferroptosis is mediated by glutathione peroxidase 4 (GPX4), which detoxifies lipid hydroperoxides using GSH as a reducing substrate [15-18]. Accordingly, disruption of GPX4 activity or depletion of GSH can promote lipid peroxide accumulation and trigger ferroptosis across diverse cell types [19]. Ferroptosis is characterized by membrane lipid peroxidation, intracellular iron accumulation, and impaired antioxidant defenses. Alterations in iron, lipid metabolism, reactive oxygen species (ROS), and GSH levels during ferroptosis indicate that this form of cell death is tightly linked to cellular metabolic processes [20]. Cancer cells can acquire ferroptosis resistance through metabolic rewiring [21-25], which contributes to tumor progression and therapy resistance [26]. Notably, nutrient limitations, including restricted serine/glycine availability, may compromise NADPH- and GSH-dependent antioxidant defenses and increase the vulnerability of GBM cells to ferroptosis, highlighting the importance of metabolic defense mechanisms that sustain redox homeostasis under nutrient-limited conditions.
In this study, we investigated how GBM cells adapt to restricted serine/glycine availability through an integrative approach combining single-cell and bulk transcriptomic analyses, validation in clinical specimens, and mechanistic studies of the upstream regulation and functional significance of SHMT1/2-mediated serine catabolism using genetic and pharmacological perturbation in vitro and in vivo. We identify ROS–hypoxia-inducible factor-1α (HIF-1α) signaling as an upstream regulatory mechanism of SHMT1/2 induction under serine/glycine restriction and show that SHMT1/2-mediated serine catabolism supports NADPH/GSH-dependent redox homeostasis and ferroptosis resistance. Furthermore, genetic and pharmacological targeting of SHMT1/2 impaired GBM growth in vivo, supporting SHMT-dependent serine catabolism as a potential metabolic vulnerability in GBM.
Materials and Methods
Materials
N-acetyl-L-cysteine (NAC) (#A7250), cobalt (II) chloride (CoCl2) (#60818), glycine (#G8790), and sodium formate (#71539) were obtained from Sigma-Aldrich (St. Louis, MO, USA). Hydrogen peroxide (H2O2, 30%) (#107209) was obtained from Merck Millipore (Burlington, MA, USA). PX-478 (#S7612) was obtained from Selleck Chemicals (Houston, TX, USA). SHIN1 (#HY-112066), sertraline hydrochloride (#HY-B0176A), Z-VAD-FMK (Z-VAD) (#HY-16658B), Ferrostatin-1 (Fer-1) (#HY-100579), Necrostatin-1 (Nec-1) (#HY-15760), and Liproxstatin-1 (Lip-1) (#HY-12726) were obtained from MedChemExpress (Monmouth Junction, NJ, USA). Antibodies used for immunoblotting (IB) and immunohistochemistry (IHC), together with their sources, catalog numbers, and working dilutions, are listed in Table S1.
Cell culture
U87MG and U373MG cells were obtained from the Korean Cell Line Bank (KCLB; Seoul, Republic of Korea). U251, A172, T98G, LN18, and LN229 cells, together with normal human astrocytes (NHA), were kindly provided by the individuals thanked in the Acknowledgements. Cell cultures were routinely screened for mycoplasma contamination, and their identities were confirmed using authentication information from the respective sources. NHA were maintained in Astrocyte Medium (#1801, ScienCell, Carlsbad, CA, USA) according to the manufacturer's instructions. Unless otherwise indicated, GBM cells were cultured in Dulbecco's modified Eagle's medium (DMEM; #LM001-05; Welgene, Gyeongsan-si, Republic of Korea) supplemented with 10% fetal bovine serum (FBS; #S001-04, Welgene) and 1% penicillin/streptomycin (#PS-B, Capricorn Scientific, Germany). The glioblastoma stem-like cell (GSC) lines NCH421K and NCH644 were obtained from Cytion (Heidelberg, Germany) and cultured in DMEM:Ham's F-12 (1:1) medium (#820400a, Cytion) supplemented with 10% FBS, 5 mg/L heparin, 20 ng/mL basic fibroblast growth factor (bFGF), 20 ng/mL epidermal growth factor (EGF), 5 mg/L insulin, 100 mg/L transferrin, 5.2 μg/L sodium selenite, 6.3 μg/L progesterone, 161.1 μg/L putrescine, and 1% penicillin/streptomycin.
Serine and glycine deprivation
The serine/glycine (S/G)-containing control medium consisted of DMEM (#LM001-05, Welgene), containing 0.4 mM L-serine and 0.4 mM glycine, supplemented with 10% dialyzed fetal bovine serum (dFBS; #26400044, Gibco, Gaithersburg, MD, USA) and 1% penicillin/streptomycin. The S/G(-) condition was established using a customized DMEM formulation (#LM001-229, Welgene) with the same composition as the control DMEM but without L-serine and glycine. The customized medium contained the same concentrations of dFBS and penicillin/streptomycin as the control medium. Dialyzed FBS was used in both media to minimize the contribution of exogenous free amino acids while maintaining identical serum conditions between experimental groups.
Cell proliferation and viability assays
Cells (1 × 10⁴) were seeded and cultured in either S/G-containing control [S/G(+)] medium or S/G-deprived [S/G(-)] medium as described above. On days 2, 4, and 6 after seeding, cells were trypsinized and manually counted using a hemocytometer.
Cell viability was determined using a WST-8 Cell Counting Kit (#QM5000, Biomax, Guri-si, Republic of Korea) according to the manufacturer's instructions. GBM cells (3 × 10³) were seeded in 96-well plates and maintained under the indicated experimental conditions for the specified durations. At the indicated time points, WST-8 reagent was added to each well, followed by incubation at 37 °C for 1 h. Absorbance was measured at 450 nm using a microplate reader at room temperature (RT).
Flow cytometric analysis of cell death and apoptosis
Cells were plated in 12-well plates under the indicated experimental conditions. For cell death analysis, cells were stained with propidium iodide (PI) alone, and PI-positive cells were determined by flow cytometry. The percentage of PI-positive cells was calculated relative to the total analyzed cell population. For apoptosis analysis, cells were subjected to dual staining with FITC Annexin V and PI using a FITC Annexin V Apoptosis Detection Kit with PI (#640914, BioLegend, San Diego, CA, USA) according to the manufacturer's instructions. Early apoptotic (Annexin V-positive/PI-negative) and late apoptotic (Annexin V-positive/PI-positive) populations were identified, and the two populations were combined to determine the total apoptotic fraction. Samples were analyzed on a NovoCyte flow cytometer (Agilent, Santa Clara, CA, USA). A minimum of 10,000 events was acquired for each sample, and flow-cytometry data were processed using FlowJo software (version 10; Tree Star, Ashland, OR, USA).
Measurements of lipid ROS
To evaluate lipid ROS, cells were plated in 24-well plates and stained with BODIPY C11 using the Image iTTM Lipid Peroxidation Kit (#C10445, Invitrogen, Waltham, MA, USA) according to the manufacturer’s instructions. Fluorescence images were acquired using a fluorescence microscope (Echo, CA, USA), and representative images were used to assess changes in lipid ROS accumulation.
Gene knockdown and overexpression
siRNA targeting HIF-1α (#104730345) was obtained from Integrated DNA Technologies (Coralville, IA, USA). Lentiviral plasmids based on the pLKO.1-puro backbone carrying shRNA against GFP, HIF-1α (#TRCN0000003810), SHMT1 (#TRCN0000034766), or SHMT2 (#TRCN0000234659) were purchased from Sigma-Aldrich (St. Louis, MO, USA). The pCMV3-Flag-HIF1-α expression plasmid (#HG11977-NF) was purchased from Sino Biological (Beijing, China). Cells were seeded in 60-mm culture dishes at 4 × 10⁵ cells per dish 18 h before transfection. HIF-1α siRNA was introduced using Lipofectamine™ RNAiMAX transfection reagent (#13778150, Thermo Fisher Scientific, Pittsburgh, PA, USA) according to the manufacturer’s instructions. Transfection of shRNA constructs and the HIF-1α expression plasmid was carried out with LipofectamineTM 2000 transfection reagent (#11668027, Thermo Fisher Scientific, Pittsburgh, PA, USA) according to the manufacturer’s instructions.
Quantitative real-time PCR (qPCR) analysis
RNAiso Plus reagent (#9108, Takara, Japan) was used to isolate total RNA according to the manufacturer’s instructions. Equivalent amounts of isolated RNA were converted to cDNA with PrimeScript™ RT Master Mix (Perfect Real Time) (#RR036A, Takara, Japan). qPCR amplification was carried out on a Thermal Cycler Dice® Real Time System III detection system using a KAPA SYBR® FAST qPCR Master Mix (#KK4602, Roche, CH), according to the manufacturer’s instructions. The amplification protocol comprised 40 cycles of 95 °C for 15 s and 60 °C for 1 min. Transcript abundance was determined by the 2⁻ΔΔCt method [27] using GAPDH as the reference gene, with each sample analyzed in triplicate. The primer sequences used for qPCR analysis are provided in Table S2.
Immunoblotting (IB) analysis
Whole-cell lysates were prepared using a lysis buffer composed of 50 mM Tris–HCl [pH 7.5], 0.1% sodium dodecyl sulfate (SDS), 1% Triton X-100, 150 mM NaCl, 1 mM dithiothreitol (DTT), 0.5 mM EDTA, 100 μM sodium orthovanadate, 100 μM sodium pyrophosphate, 1 mM sodium fluoride, and protease inhibitor cocktail. The lysates were clarified by centrifugation at 15,000 rpm for 15 min at 4 °C, and protein concentrations in the resulting supernatants were measured with the DC Protein Assay Kit (#5000112, Bio-Rad, Hercules, CA, USA). Equivalent amounts of protein were resolved by SDS-polyacrylamide gel electrophoresis (SDS-PAGE), followed by transfer to nitrocellulose membranes. Membranes were blocked with 5% skim milk in TBST for 30 min at RT before incubation with primary antibodies overnight at 4 °C. After washing, horseradish peroxidase (HRP)-linked secondary antibodies were applied (anti-rabbit: #RSA1221; anti-mouse: #RSA1122, BioActs, Incheon, Republic of Korea) for 2 h at RT. Band intensities were quantified with ImageJ software (National Institutes of Health, Bethesda, MD, USA). IB experiments were independently repeated at least three times. Figure S8 shows uncropped images of the original immunoblots.
Analysis of single-cell RNA sequencing
For the normal brain scRNA-seq dataset, a large publicly available collection of scRNA-seq datasets was downloaded and analyzed (Human Brain Cell Atlas v1.0; SCR015820) [28]. From this collection, we selected 12 datasets (three from the medial entorhinal cortex [MEC], three from the middle temporal gyrus [MTG], three from the primary motor cortex [M1C], and three from the superior temporal gyrus [STG]) for analysis (Data File S1). For the glioblastoma scRNA-seq dataset, 40 datasets (paired primary and recurrent glioblastoma datasets from 20 patients; Data File S1) were selected and downloaded from a large, publicly available scRNA-seq cohort (GSE174554) [29]. We used the filtered matrix output generated by the Cell Ranger pipeline (v.3.0.2).
To standardize gene names across the cohort, we applied the HGNChelper package (v.0.8.15) [30]. Next, we applied the scDblFinder package (v.1.18.0) [31] to predict and remove doublets. Using the Seurat package (v.5.3.0) [32], the datasets were merged and analyzed. For each sample, poor-quality cells were filtered based on the number of features (min features = 200, min cells = 3), the number of detected RNAs (> 200 and < 9,000), and percentage of reads arising from the mitochondrial genome (< 5%). To reduce batch effects, we applied the Harmony package (v.1.2.3) [33]. Clustering with default parameters and nonlinear dimensionality reduction using uniform manifold approximation and projection (UMAP) were performed using the Seurat package. Cell clusters were annotated based on the marker genes identified using the Seurat FindAllMarkers function and previous published literature (Data File S2) [28, 29].
Gene set scores (hypoxia-related genes from MSigDB [200 genes] [34], hypoxia-related genes from meta-program [50 genes] [35], and ferroptosis-related genes [FerrDb v2; 348 suppressor genes, 369 driver genes, and 11 marker genes] [36]) were calculated using the Seurat AddModuleScore function (Data File S3). For correlation analysis, we divided the cells into SHMT1/2-negative and SHMT1/2-positive groups based on SHMT1/2 expression. Cells with expression levels of both SHMT1 and SHMT2 above 0.01 were identified as SHMT1/2-positive cells, and the remaining cells were identified as SHMT1/2-negative cells. Among the SHMT1/2-positive cells, we performed Pearson correlation analysis using correlationAnalyzeR (v.1.0.0) package [37].
Analysis of RNA sequencing and gene set enrichment analysis (GSEA)
RNA-sequencing data were obtained from U87MG cells cultured in S/G-containing control [S/G(+)] or S/G-deprived [S/G(-)] medium for 24 h, as previously described [38]. The RNA-sequencing dataset is available in the Gene Expression Omnibus (GEO) under accession number GSE235422. RNA-sequencing data were processed and normalized using R software. Differentially expressed genes (DEGs) between S/G(+) and S/G(-) conditions were identified using an R-based differential expression analysis. Fold changes and statistical significance were calculated to identify genes differentially expressed between the two conditions.
Gene set enrichment analysis (GSEA) was performed using GSEA software (version 4.3.3; Broad Institute), as previously described [39]. Normalized expression data were used for GSEA, with Signal2Noise used as the gene-ranking metric. Normalized enrichment scores (NES) were calculated, and gene sets with a false discovery rate (FDR) q-value < 0.25 were considered significantly enriched.
Gene ontology and pathway enrichment analyses
Differentially expressed genes (DEGs), defined as genes with a fold change ≥ 1.3 and P < 0.05, were subjected to functional enrichment analysis using Enrichr [40]. Gene Ontology (GO) and Kyoto Encyclopedia of Genes and Genomes (KEGG) pathway enrichment analyses were performed using the corresponding gene-set libraries available in Enrichr. Enrichment significance was assessed using Fisher’s exact test, and terms with an adjusted P-value < 0.05 were considered significantly enriched.
Assessment of cellular redox status and ROS levels
Intracellular NADPH/NADP⁺ ratio was analyzed in 1 × 10⁵ cells using the NADP/NADPH Quantification Colorimetric Kit (#ab65349, Abcam, Cambridge, UK) according to the manufacturer's instructions. Cells were lysed in the assay buffer supplied with the kit, and absorbance was recorded at 450 nm using a 96-well microplate reader at RT. For GSH/GSSG analysis, 1 × 10⁵ cells were processed with the GSH+GSSG/GSH Assay Kit (#ab239709, Abcam) according to the manufacturer's instructions, with absorbance recorded at 405 nm at RT. Protein concentrations were determined from aliquots of each lysate using the DC Protein Assay (Bio-Rad). Intracellular NADPH, NADP⁺, GSH, and GSSG levels were normalized to total protein concentration before calculation of the corresponding ratios. Intracellular ROS levels were determined with a Reactive Oxygen Species (ROS) Detection Assay Kit (#ab287839, Abcam, Cambridge, UK) following the manufacturer's protocol. Fluorescence was measured at Ex/Em = 495/529 nm in endpoint mode.
Measurement of intracellular metabolites
Intracellular serine, glycine, formate, and asparagine levels in cultured cells (1 × 10⁵) or tumor tissues were measured with the L-Serine ELISA Kit (#IS-I-1200R, Immusmol, Bordeaux, France), Glycine Assay Kit (Fluorometric) (#ab211100, Abcam, Cambridge, UK), Formate Assay Kit (#ab111748, Abcam), and Asparagine Assay Kit (Fluorometric) (#ab273333, Abcam), respectively, according to the manufacturers’ instructions. Cells were lysed in the buffers provided with the respective assay kits. For measurement of glycine and formate levels in tumors, excised tumor tissues were weighed and homogenized in the buffers provided. Cell lysates and tumor homogenates were then centrifuged to remove cellular and tissue debris. Serine and formate levels were determined by measuring absorbance at 450 nm using a microplate reader, whereas glycine and asparagine levels were determined fluorometrically at Ex/Em = 535/587 nm and 538/587 nm, respectively, in endpoint mode. Protein concentrations were determined from aliquots of each lysate using the DC Protein Assay (Bio-Rad), and intracellular metabolite levels were normalized to total protein concentration.
Measurement of cellular iron levels
To evaluate cellular iron (Fe²⁺) levels, 1 × 10⁵ cells were harvested and lysed using the assay buffer provided with the Iron Assay Kit (#ab83366, Abcam, Cambridge, UK) according to the manufacturer's instructions. Absorbance was measured at 593 nm using a 96-well microplate reader at RT. Protein concentrations were determined from aliquots of each lysate using the DC Protein Assay (Bio-Rad), and cellular Fe²⁺ levels were normalized to total protein concentration.
Glycine and formate supplementation
For glycine rescue experiments, glycine was supplemented at 1.0 mM in mechanistic assays evaluating redox homeostasis and ferroptosis-associated phenotypes. To confirm that the observed rescue effects were not restricted to this concentration, additional experiments were performed using 0.4 mM glycine, corresponding to the glycine concentration in the standard DMEM used in this study. Formate was supplemented at 0.5 mM in the indicated cell viability rescue experiments. The specific concentrations of glycine and formate used in each rescue experiment are indicated in the corresponding figure legends.
Chromatin immunoprecipitation (ChIP) assay
ChIP was carried out with the SimpleChIP Enzymatic Chromatin IP kit (#9003S, Cell Signaling Technology, Danvers, MA, USA), according to the manufacturer’s instructions. Chromatin was isolated from 1 × 10⁷ cells grown in 150-mm culture dishes, with an aliquot retained as input DNA. The remaining chromatin was subjected to overnight immunoprecipitation at 4 °C using an anti-HIF-1α antibody or control IgG. Immunoprecipitated DNA was analyzed by qPCR using primers targeting the HIF-1α-binding regions of the SHMT1 and SHMT2 promoters (Table S3).
SHMT1/2 promoter luciferase assay
Cells were co-transfected with the empty pGL3-Basic vector (#E1751, Promega, Madison, WI, USA) or pGL3 firefly luciferase reporter constructs containing the SHMT1 promoter region (-1169 to -750 relative to the transcription start site) or the SHMT2 promoter region (-2186 to -1977 relative to the transcription start site), encompassing the respective wild-type or mutant hypoxia-response elements (HREs), together with the pRL-TK Renilla luciferase plasmid (#E2241, Promega) at a 10:1 ratio. The HRE-mutant constructs were generated by site-directed mutagenesis of the HRE sequence (5′-CGTG-3′ to 5′-ATAA-3′) using the following mutagenic forward primers: SHMT1-HRE-mut, 5′-CTGGGACTATAGGCAATAACCACCACACCCGACT-3′; and SHMT2-HRE-mut, 5′-TGGCTTTTCCATGCAATAAGATTGGGGGCCTCAGG-3′. Transfections were performed using Lipofectamine™ 2000 (Thermo Fisher Scientific). Following transfection, cells were cultured in either serine- and glycine-replete or serine- and glycine-deficient medium for 24 h. Firefly and Renilla luciferase activities were measured using the Dual-Luciferase® Reporter Assay System (#E1910, Promega), and relative luciferase activity was calculated by normalizing firefly luciferase activity to Renilla luciferase activity.
Intracranial implantation of GBM cells in mice and histologic evaluation
Five-week-old male athymic nude mice received intracranial implantation of U87MG cells with or without SHMT1 or SHMT2 depletion (n = 5 per group). For pharmacological treatment with sertraline, U87MG cells were intracranially implanted into 5-week-old male athymic nude mice (n = 5 per group). One week after tumor implantation, mice were randomly assigned to receive either sertraline or vehicle treatment. Sertraline was dissolved in a vehicle containing 10% DMSO, 40% PEG300, and 5% Tween-80 and administered by intraperitoneal (i.p.) injection at 25 mg/kg every other day for 21 days. Control mice received the corresponding vehicle alone according to the same administration schedule. At 28 days after tumor implantation, mice were sacrificed and brains were collected for histological analysis. Brain tissues were fixed in 4% paraformaldehyde in PBS and processed into 5 μm paraffin sections. Histological examination was performed following hematoxylin and eosin (H&E) staining using Mayer’s hematoxylin (#HK100; Biogenex Laboratories, San Ramon, CA, USA) and eosin (Biogenex Laboratories). Sections were mounted with Universal Mount (Research Genetics, Huntsville, AL, USA). Tumor dimensions were obtained from H&E-stained sections, and tumor volume was estimated using V = (L × W²)/2, where L and W denote tumor length and width, respectively. Mice were maintained in the certified animal facility of Dong-A University. All animal work adhered to institutional and governmental ethical regulations and was reviewed and approved by the Institutional Animal Care and Use Committee of Dong-A University.
For survival analysis, an independent cohort of 5-week-old male athymic nude mice was used (n = 10 per group). U87MG cells (1 × 10⁶ cells per mouse) were intracranially implanted using the same procedure as that used for the tumor growth experiments. One week after tumor implantation, mice were randomly assigned to receive either sertraline or vehicle treatment. Sertraline (25 mg/kg) or vehicle was administered by i.p. injection every other day for 21 days. Mice were monitored daily for survival and general health status, including body weight, body condition, clinical signs, and activity, for 30 days after treatment initiation. Humane endpoints included body weight loss of 20% or more from baseline or severe deterioration in general condition or activity. Mice reaching a humane endpoint were euthanized in accordance with the approved animal protocol and recorded as events for survival analysis. For Kaplan–Meier survival analysis, the day of treatment initiation (7 days after tumor implantation) was designated as day 0. Survival distributions were estimated using the Kaplan–Meier method and compared using the log-rank (Mantel–Cox) test.
Immunohistochemical (IHC) analysis and scoring
IHC analysis was conducted using formalin-fixed, paraffin-embedded tissue slides. HIF-1α, SHMT1, SHMT2, Ki-67, and 4-HNE were detected with the VECTASTAIN Elite ABC kit (#PK-6200, Vector Laboratories, Burlingame, CA, USA). 3,3′-diaminobenzidine (DAB; #SK-4100, Vector Laboratories, Burlingame, CA, USA) was used as the chromogenic substrate for immunostaining, followed by hematoxylin counterstaining. For each slide, staining was evaluated in six randomly selected microscopic fields, and the field-specific scores were averaged.
Human GBM specimens and the corresponding clinical information were provided by the First Affiliated Hospital of Wenzhou Medical University, China. The study was approved by the Institutional Ethics Committee of Wenzhou Medical University, and all participating patients provided written informed consent. Tissue sections from 30 paraffin-embedded human GBM specimens were stained using antibodies specific to HIF-1α, SHMT1, and SHMT2, with non-immune IgG included as a negative control. IHC staining was scored according to the proportion of positive cells and signal intensity, as previously described [38]. The proportion score ranged from 0 to 5: 0 (no staining), 1 (0.1-1%), 2 (1.1-10%), 3 (11-30%), 4 (31-70%), and 5 (71-100%). Staining intensity was assigned a score of 0–3: 0 (no signal), 1 (weak), 2 (moderate), and 3 (strong). The proportion and intensity scores were summed to obtain a final immunoreactivity score ranging from 0 to 8.
Terminal deoxynucleotidyl transferase dUTP nick end labeling (TUNEL) assay of intracranial tumors
Apoptotic cells in intracranial tumor sections were detected with the DeadEnd™ Colorimetric TUNEL System (#G7360, Promega), according to the manufacturer’s protocol. Tumor tissue sections were initially incubated with equilibration buffer for 10 min, followed by enzymatic digestion with proteinase K solution (20 μg/mL) for another 10 min. Following PBS washing, the sections were incubated with terminal deoxynucleotidyl transferase (TdT) for 1 h at 37 °C in a humidified chamber to label DNA strand breaks with biotinylated nucleotides. TUNEL-positive signals were visualized by horseradish peroxidase-conjugated streptavidin followed by DAB development.
IHC evaluation of human glioma tissue microarrays
A commercially available paraffin-embedded glioma tissue microarray (#GL803d; US Biomax, Rockville, MD, USA) was used for IHC analysis. The tissue microarray included normal brain (n = 5), low-grade glioma (n = 45), and high-grade glioma (n = 30) specimens. All specimens were collected with informed donor consent in accordance with applicable ethical guidelines. SHMT1 and SHMT2 IHC staining was carried out as described above.
Genomic data analysis
Gene expression and clinical data for glioma patients were obtained from The Cancer Genome Atlas, the Gene Expression Omnibus, and the Chinese Glioma Genome Atlas (CGGA). TCGA data and GEO/CGGA data were obtained from their respective public repositories (www.cbioportal.org; https://www.ncbi.nlm.nih.gov/geo; http://www.cgga.org.cn). Expression data were normalized to TPM/FPKM and log2-transformed prior to analysis. Data processing and statistical analyses were performed using R software (Ver 4.6.1) with the limma, edgeR packages.
Correlation analysis
Pearson’s correlation analysis was performed to evaluate the relationship between gene expression levels. Pearson’s correlation coefficient (r) and the corresponding P-value were calculated to assess the strength and statistical significance of the correlation, respectively. A P-value < 0.05 was considered statistically significant.
Determination of optimal cutoff values
Optimal cutoff values for gene expression were determined using maximally selected rank statistics implemented in the R maxstat package. Overall survival (OS) was used as the clinical endpoint, and the expression threshold that maximized the standardized log-rank statistic was selected as the optimal cutoff. Patients were subsequently stratified into low- and high-expression groups according to the identified optimal cutoff.
Survival analysis
Kaplan–Meier survival analysis was performed to evaluate overall survival between the low- and high-expression groups, and survival differences were assessed using the log-rank test. Hazard ratios (HRs) and corresponding 95% confidence intervals (CIs) were estimated using Cox proportional hazards regression analysis. A P-value < 0.05 was considered statistically significant.
Statistical analysis
Quantitative experimental results are expressed as the mean ± standard deviation (SD) from a minimum of three independent experiments. Differences between two groups were evaluated using a two-tailed Student’s t-test, whereas comparisons involving more than two groups were performed by one-way ANOVA with Tukey’s post hoc test. Statistical analyses of experimental data were performed using GraphPad Prism version 11.1.0 (GraphPad Software, Boston, MA, USA), with P < 0.05 considered statistically significant.
Results
Serine/glycine deprivation induces ferroptotic stress and cell death in GBM cells
We first assessed the impact of serine/glycine (S/G) deprivation on GBM cell survival and observed that short-term S/G deprivation significantly increased cell death (Figure 1A). To characterize the stress-response programs associated with S/G deprivation, we reanalyzed our previously generated RNA-sequencing dataset (GSE235422) using Gene Set Enrichment Analysis (GSEA), which revealed a significant enrichment of ferroptosis-related gene sets in S/G-deprived cells (Figure 1B). Consistently, ontology-based pathway enrichment analysis of differentially expressed genes (DEGs) ranked ferroptosis and apoptosis among the most significantly enriched pathways (Figure 1C). We therefore examined the contribution of different regulated cell-death pathways using pathway-specific inhibitors. After 96 h of concurrent S/G deprivation and inhibitor treatment, ferrostatin-1 (Fer-1, a ferroptosis inhibitor) most effectively restored cell viability, whereas Z-VAD-FMK (Z-VAD, an apoptosis inhibitor) provided partial protection and necrostatin-1 (Nec-1, a necroptosis inhibitor) had no significant effect (Figure 1D). Similar responses were observed at 48 and 72 h (Figure S1A), indicating a progressive loss of cell viability during prolonged S/G deprivation. Notably, the relatively modest increase in PI-positive cell death observed at 24 h (Figure 1A) contrasts with the more pronounced loss of cell viability measured after 96 h of S/G deprivation (Figure 1D), reflecting the cumulative effects of prolonged S/G deprivation. Fer-1 also significantly reduced S/G deprivation-induced PI-positive cell death (Figure 1A) and attenuated the accompanying increases in intracellular Fe²⁺ (Figure 1E) and lipid ROS (Figure 1F). The involvement of ferroptosis was further supported by the protective effect of the independent ferroptosis inhibitor Liproxstatin-1 (Figure S1B). In parallel, S/G deprivation increased PARP cleavage, indicating activation of apoptotic signaling (Figure S1C), consistent with the partial protective effect of Z-VAD. S/G deprivation also increased 4-hydroxynonenal (4-HNE), a product of lipid peroxidation, and altered the levels of ferroptosis-associated proteins, such as solute carrier family 7 member 11 (SLC7A11), ferritin heavy chain 1 (FTH1), glutathione peroxidase 4 (GPX4), ChaC glutathione specific gamma-glutamylcyclotransferase 1 (CHAC1), and prostaglandin-endoperoxide synthase 2 (PTGS2) (Figure 1G), with corresponding transcriptional changes observed in ferroptosis-associated genes (Figure S1D). Together, these findings indicate that S/G deprivation induces a mixed cell-death response in GBM cells, with ferroptosis representing the predominant component under these conditions.
Serine/glycine deprivation induces ferroptotic stress and cell death in GBM cells. (A) The specified cell lines were maintained in S/G(-) or control media for 24 h in the presence or absence of Ferrostatin-1 (Fer-1, 5 μM). Cell death was analyzed by flow cytometry. Representative PI histograms are shown (left panel), and quantification of relative PI-positive cells from three independent experiments is presented (right panel). (B) GSEA of the ferroptosis gene set in U87MG cells cultured under serine/glycine (S/G)-deprived conditions for 24 h compared with control conditions. NES and FDR q-values are indicated. (C) An ontology-based enrichment analysis of DEGs between S/G-deprived and control U87MG cells is presented as a bubble plot. Pathways were ranked using an enrichment score derived from the odds ratio and P-value. The odds ratio, reflecting the strength of DEG enrichment within each pathway, is represented by bubble size, whereas the color scale corresponds to -log₁₀(P-value), indicating statistical significance. (D) Cell viability was measured after 96 h of concurrent treatment with S/G deprivation and the indicated inhibitors. Cells were cultured in control or S/G(-) media supplemented with Z-VAD-FMK (Z-VAD, 10 μM), Ferrostatin-1 (Fer-1, 5 μM), or Necrostatin-1 (Nec-1, 25 μM). Data are presented relative to untreated cells cultured in control medium. (E) The specified cell lines were maintained in S/G(-) or control media for 24 h in the presence or absence of Fer-1 (5 μM). Cellular Fe²⁺ levels were measured and quantified from three independent experiments. (F) The specified cell lines were cultured in control or S/G(-) media for 24 h in the presence or absence of Fer-1 (5 μM), and stained with C11-BODIPY. Representative fluorescence images showing changes in lipid ROS accumulation are shown. Scale bar, 60 μm. (G) The specified cell lines were maintained in S/G(-) or control media for 24 h. Protein expression was examined by IB. (H) Publicly available scRNA-seq datasets (SCR015820 and GSE174554) were analyzed, including cells derived from normal brain tissues and primary and recurrent GBM specimens. Uniform manifold approximation and projection (UMAP) visualization shows cells colored according to cell type identity. OPC, oligodendrocyte progenitor cell. (I) Highlighted UMAP plots showing cells from normal brain, primary GBM, and recurrent GBM (first column). Feature plots displaying the transcriptional module scores of ferroptosis-driver (second column), ferroptosis-suppressor (third column), and ferroptosis-marker (fourth column) gene sets. Data are presented relative to the untreated S/G(+) control group. Values represent mean ± s.d. of three independent experiments (A, D, E). *, P < 0.05; **, P < 0.01; ***, P < 0.001. NS, not significant.
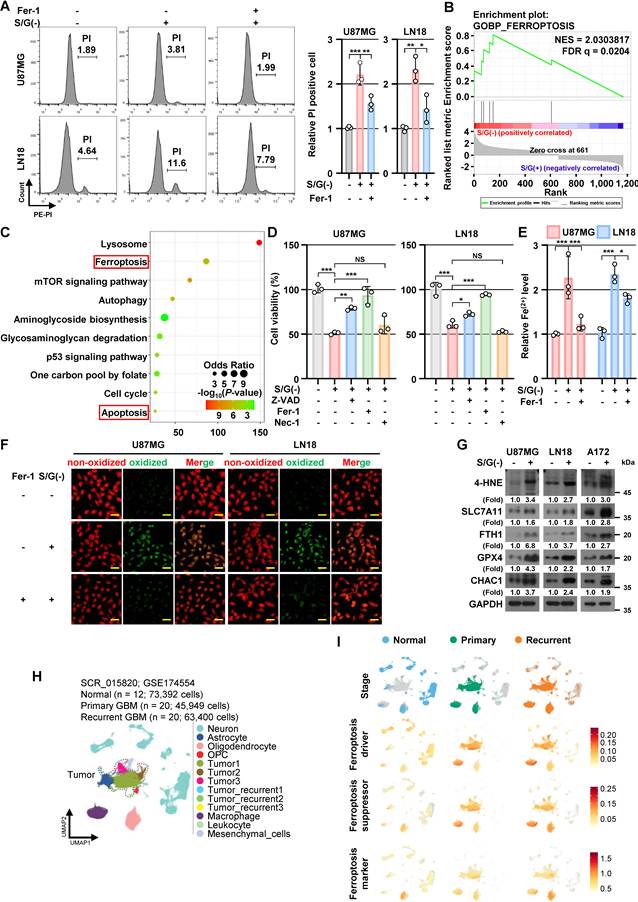
To extend these findings to human tumors, we analyzed published single-cell RNA-sequencing (scRNA-seq) datasets from normal brain and primary/recurrent GBM. For the normal control, we downloaded a large cohort of normal brain scRNA-seq data (SCR_015820) [28], and then we selected 12 samples (medial entorhinal cortex [MEC, n = 3], middle temporal gyrus [MTG, n = 3], primary motor cortex [M1C, n = 3], and superior temporal gyrus [STG, n = 3], Data File S1). For the GBM tumor, we downloaded the large cohort of primary and recurrent GBM scRNA-seq data (GSE174554) [29] and selected 40 matched samples (primary [n = 20] and recurrent [n = 20], Data File S1). Then, we annotated cell types from the unbiased clusters based on the marker genes (Data File S2) and previous literature [28, 29] (Figure 1H and Figure S1E). The scRNA-seq data showed that ferroptosis-related driver, suppressor, and marker gene scores were elevated in both primary and recurrent GBM cells compared with normal brain cell populations (Figure 1I), indicating broad dysregulation of ferroptosis-associated programs in human GBM. Collectively, these findings indicate that S/G deprivation imposes ferroptotic stress on GBM cells and reveal a requirement for metabolic adaptations that protect against ferroptosis under S/G-restricted conditions.
S/G deprivation induces SHMT1/2 expression in GBM cells in association with oxidative-stress responses
Reanalysis of our previously generated RNA-seq dataset (GSE235422) revealed enrichment of gene sets associated with amino acid/serine metabolism and oxidative-stress responses under S/G deprivation (Figure 2A). In particular, genes involved in L-serine metabolic process were upregulated, including SSP enzymes (PHGDH, PSAT1, and PSPH) and the serine catabolic enzyme SHMT2 (Figure 2B). SHMT1 showed an increasing trend but did not meet the cutoff criterion for inclusion in the heatmap. S/G deprivation also altered multiple oxidative-stress response genes, including SLC7A11, SESN2, ATF4, HMOX1, NQO1, GPX4, and SOD2 (Figure 2B; Table S4). Our previous study demonstrated SSP activation through PHGDH, PSAT1, and PSPH induction under S/G deprivation [38]. Given the increased SHMT2 expression observed in the present RNA-seq analysis, we next investigated the regulation of SHMT1/2 under S/G-restricted conditions. We subsequently validated the transcriptomic findings in established GBM cell lines and patient-derived glioma stem cells (NCH421K and NCH644). Both SHMT1 and SHMT2 showed increased mRNA and protein expression following S/G deprivation, as determined by qPCR and IB, respectively (Figure 2C and D).
S/G deprivation induces SHMT1/2 expression in GBM cells in association with oxidative-stress responses. (A) Gene set enrichment analysis (GSEA) showing enrichment of gene sets associated with L-amino acid metabolic process, L-serine metabolic process, and response to oxidative stress in U87MG cells cultured under serine/glycine (S/G)-deprived conditions for 24 h compared with control conditions. Normalized enrichment scores (NES) and FDR q-values are indicated. (B) Heatmap of genes associated with the L-serine metabolic process and response to oxidative stress in U87MG cells under control and serine/glycine (S/G)-deprived conditions. Gene expression levels are presented as Z-scores. (C and D) The specified cell lines were maintained in S/G(-) or control media for 24 h. qPCR (C) and IB (D) analyses were performed using the indicated primers and antibodies, respectively. (E) The specified cell lines were maintained in S/G(-) or control media for 24 h. mRNA levels were determined by qPCR. (F) Highlighted UMAP plots showing cells from normal brain, primary GBM, and recurrent GBM (top row). Feature plots displaying the expression of SLC7A11 (middle row) and SOD2 (bottom row). (G) The specified cell lines were maintained in S/G(-) or control media for 24 h in the presence or absence of NAC (2 mM). Protein expression was examined by IB. Data are presented relative to the untreated S/G(+) control group. Values represent mean ± s.d. of three independent experiments (C, E). *, P < 0.05; **, P < 0.01; ***, P < 0.001.
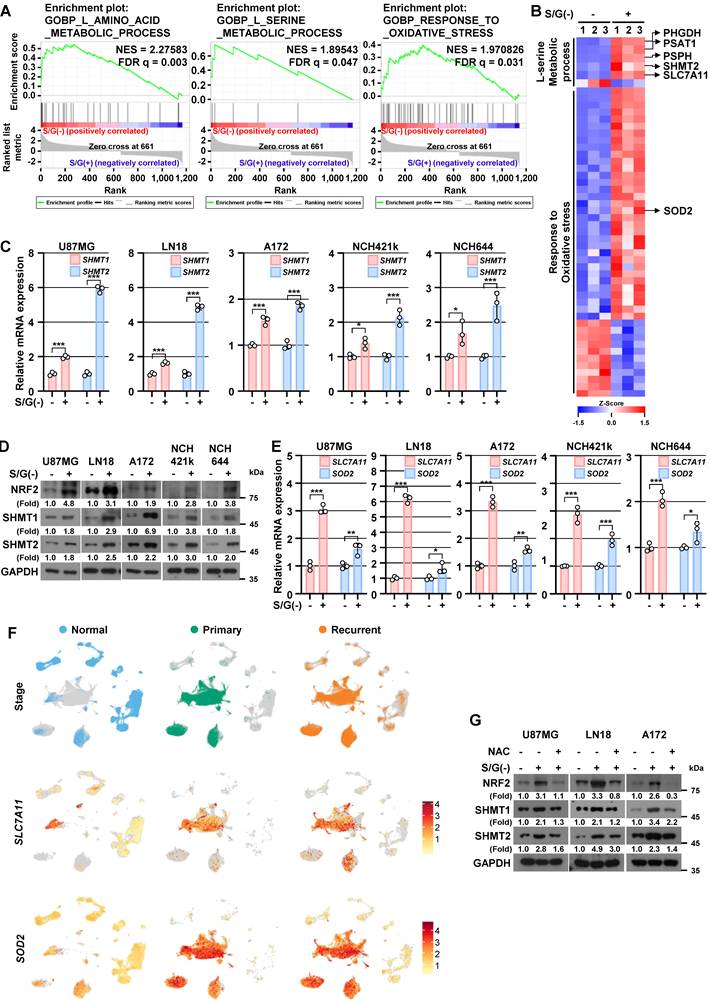
To determine whether maintenance of intracellular serine and glycine pools was conserved across GBM models, we measured intracellular serine and glycine under S/G-deprived conditions. Despite the absence of serine and glycine from the culture medium, established GBM cells and patient-derived glioma stem cells maintained higher intracellular serine and glycine levels than normal human astrocytes (NHA) (Figure S2A). Together with our previous evidence of SSP activation [38] and the induction of SHMT1/2 observed here, these findings are consistent with an adaptive reorganization of serine metabolism under S/G deprivation. S/G deprivation also increased intracellular ROS (Figure S2B) and induced NRF2 (Figure 2D), a central regulator of antioxidant response elements [41], along with its downstream target gene SLC7A11 [42] and superoxide dismutase 2 (SOD2) [43] (Figure 2E) in established GBM cell lines and patient-derived glioma stem cells. Consistently, scRNA-seq analysis showed elevated expression of SLC7A11 and SOD2 in primary and recurrent GBM cells (Figure 2F). To determine whether ROS contributes to SHMT1/2 induction, we attenuated ROS accumulation using N-acetyl-L-cysteine (NAC) (Figure S2B). NAC markedly suppressed S/G deprivation-induced NRF2 and SHMT1/2 expression (Figure 2G). Conversely, treatment with hydrogen peroxide (H2O2), a pro-oxidant molecule, upregulated ROS accumulation (Figure S2C), SHMT1/2 mRNA (Figure S2D), and protein (Figure S2E), and these inductions were largely abolished by NAC (Figure S2D and S2E). These observations support ROS-dependent oxidative-stress signaling as a contributor to SHMT1/2 induction during S/G deprivation.
Elevated SHMT1/2 expression is associated with malignant features and poor prognosis in GBM
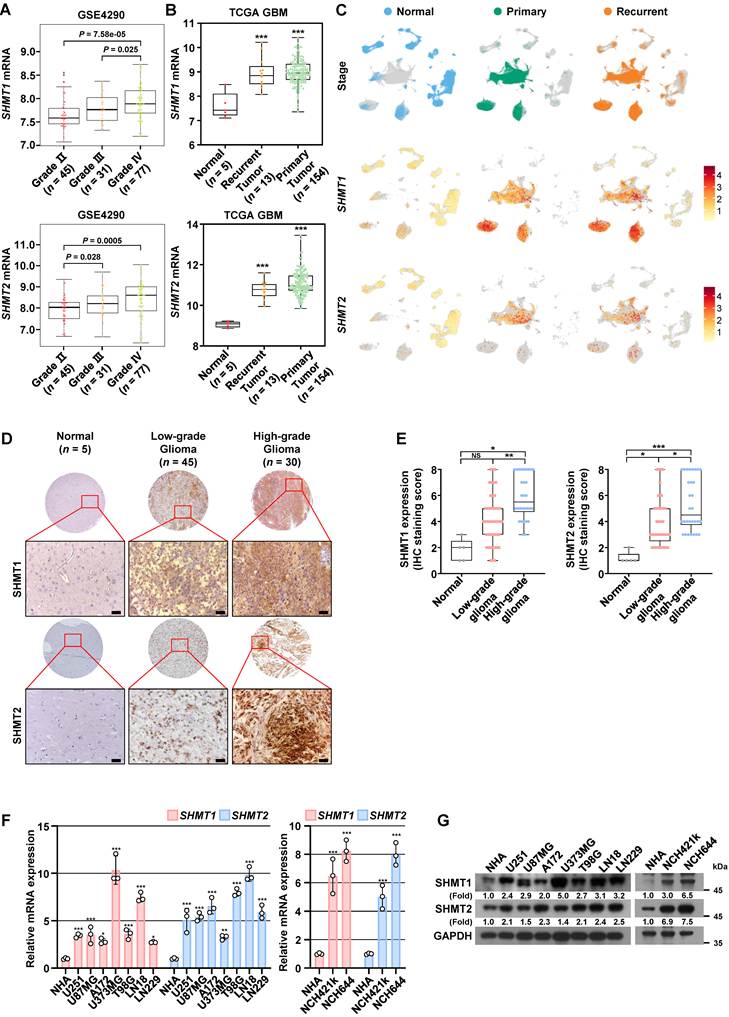
We next examined the expression and clinical relevance of SHMT1/2 in human GBM. Analysis of publicly available FireBrowse data (www.firebrowse.org) showed differential expression of SHMT1 and SHMT2 across 28 human cancer types, with SHMT2 exhibiting particularly widespread upregulation. Notably, both SHMT1 and SHMT2 expression was elevated in GBM compared with normal brain tissue (Figure S3A). Analysis of the GEO dataset GSE4290 confirmed higher SHMT1 and SHMT2 expression in GBM than in normal brain tissue (Figure S3B), with expression increasing with glioma grade (Figure 3A). Consistently, TCGA analysis showed elevated SHMT1 and SHMT2 expression in both primary and recurrent GBM compared with normal brain tissue (Figure 3B). In the independent CGGA mRNAseq-325 GBM cohort, high expression of SHMT1 or SHMT2 was significantly associated with poorer overall survival (both P < 0.05; Figure S3C). Consistently, univariate Cox proportional hazards regression analysis showed that high expression of SHMT1 (HR = 1.49, 95% CI = 1.05–2.14, P = 0.028) and SHMT2 (HR = 1.67, 95% CI = 1.07–2.61, P = 0.024) was significantly associated with an increased risk of death (Figure S3D). At the single-cell level, SHMT1 and SHMT2 expression was elevated in primary and recurrent GBM cells (Figure 3C). Increased expression was also observed in tumor-associated macrophages (TAMs) and oligodendrocytes within the tumor microenvironment, with SHMT1 showing particularly prominent expression in these populations (Figure 3C). Further analysis of TAM heterogeneity revealed heterogeneous expression of markers associated with TAM subtype and macrophage cellular origin. SHMT1 was broadly expressed across TAM populations, irrespective of these marker-expression patterns, with no clear enrichment in any specific TAM subtype or macrophage origin (Figure S3E-G). We next validated SHMT1/2 expression in human glioma specimens. Immunohistochemical (IHC) analysis showed higher SHMT1 and SHMT2 expression in glioma specimens than in normal brain tissue, with stronger expression in higher-grade tumors (Figure 3D and 3E). Consistently, quantitative real-time PCR and immunoblotting analyses showed significantly higher SHMT1 and SHMT2 mRNA and protein levels in established GBM cell lines and patient-derived glioma stem cells than in NHA (Figure 3F and 3G). Collectively, these findings indicate that SHMT1/2 expression is elevated in GBM and associated with malignant disease features and poor clinical outcome.
Elevated SHMT1/2 expression is associated with malignant features and poor prognosis in GBM. (A) Analysis of SHMT1 and SHMT2 mRNA expression in the GEO dataset (GSE4290) across the indicated cohorts with different tumor grades. (B) Analysis of SHMT1 and SHMT2 mRNA expression in the TCGA dataset in normal (n = 5), recurrent GBM (n = 13), and primary GBM (n = 154) tissues. (C) Highlighted UMAP plots showing cells from normal brain, primary GBM, and recurrent GBM (top row). Feature plots displaying the expression of SHMT1 (middle row) and SHMT2 (bottom row). (D and E) Tissue microarrays containing human glioma and normal brain specimens were subjected to IHC staining for SHMT1 and SHMT2. Representative IHC images of normal brain, low-grade glioma, and high-grade glioma tissues are shown (D), with corresponding quantification of IHC staining scores (E). Scale bar, 40 μm. (F and G) The specified cell lines were maintained in their respective standard complete culture media for 24 h. qPCR (F) and IB (G) analyses were performed using the indicated primers and antibodies, respectively. For (E), boxes indicate the interquartile range, center lines indicate the median, and whiskers indicate the minimum and maximum values. Values in (F) represent mean ± s.d. of three independent experiments. *, P < 0.05; **, P < 0.01; ***, P < 0.001. NS, not significant.
HIF-1α directly transactivates SHMT1/2 under serine/glycine deprivation and correlates with SHMT1/2 expression in human GBM
We previously showed that HIF-1α induces SSP enzymes (PHGDH, PSAT1, and PSPH) to enhance de novo serine biosynthesis under S/G deprivation [38]. To overcome the oxidative stress imposed by S/G deprivation (Figure 1), GBM cells may need to coordinate de novo serine biosynthesis with serine catabolism. Therefore, we hypothesized that the expression of genes involved in de novo serine biosynthesis and SHMT-mediated serine catabolism may be coordinately regulated. We next determined whether SHMT1/2 genes were associated with SSP genes in human GBM cohorts, because expression levels of SHMT1/2 are higher in human glioma specimens than in normal human brain tissue (Figure 3), similar to SSP genes [38]. Both SHMT1 and SHMT2 genes showed a high correlation with PHGDH, PSAT1, and PSPH genes (Figure S4A). In addition, given the role of ROS not only in HIF-1α-induced SSP upregulation [38] but also in SHMT1/2 expression (Figure 2) under S/G deprivation, we asked whether SHMT1/2 genes are also upregulated by HIF-1α. Promoter analysis identified hypoxia-responsive elements (HREs), putative HIF-1α-binding sites, within the promoter regions of both SHMT1 and SHMT2 (Figure 4A; Figure S4B). A chromatin immunoprecipitation (ChIP)-qPCR showed increased HIF-1α occupancy at these promoter regions under S/G deprivation in GBM cells (Figure 4B). To determine the functional requirement of the identified HREs, we compared wild-type and HRE-mutant SHMT1 and SHMT2 promoter constructs. S/G deprivation significantly increased wild-type promoter activity, whereas mutation of the HREs markedly attenuated this induction (Figure 4C). Together, these findings support direct HIF-1α-mediated transcriptional activation of SHMT1/2 through the identified HREs under S/G deprivation. Consistently, siRNA-mediated HIF-1α depletion reduced S/G deprivation-induced SHMT1/2 mRNA and protein expression (Figure 4D and 4E). Pharmacological inhibition of HIF-1α with PX-478 similarly attenuated SHMT1/2 induction (Figure S4C and S4D). Re-expression of HIF-1α in HIF-1α-depleted cells restored SHMT1/2 mRNA and protein expression under S/G-deprived conditions (Figure S4E and S4F). Conversely, CoCl₂ treatment increased SHMT1/2 mRNA and protein expression in cells cultured in S/G-containing control medium (Figure S4G and S4H). Collectively, these results identify HIF-1α as a transcriptional regulator of SHMT1/2 under S/G deprivation.
HIF-1α directly transactivates SHMT1/2 under serine/glycine deprivation and correlates with SHMT1/2 expression in human GBM. (A) Diagrams displaying putative HIF-1α-binding motifs within the regulatory regions of SHMT1 and SHMT2. Promoter coordinates are shown in the 5′-to-3′ orientation relative to the transcription start site (+1). (B) The specified cell lines were maintained in S/G(-) or control media for 24 h. ChIP assays were conducted using an anti-HIF-1α antibody, followed by qPCR using primers targeting the promoter regions of SHMT1 and SHMT2. (C) Luciferase reporter assays using wild-type (WT) or HRE-mutant (Mut) SHMT1 and SHMT2 promoter constructs in U87MG and LN18 cells cultured under S/G(+) or S/G(-) conditions for 24 h. Luciferase activity was normalized to Renilla luciferase activity and presented relative to the S/G(+) WT promoter control. (D and E) The specified cell lines with or without HIF-1α depletion were maintained in S/G(-) or control media for 24 h. mRNA and protein expression were examined by qPCR (D) and IB (E), respectively. (F) IHC staining was performed on 30 human GBM specimens with the indicated antibodies. Images from five individual specimens are presented as representative examples. Scale bar, 40 μm. (G) Pearson’s correlation analysis of IHC staining scores for HIF-1α and SHMT1 or SHMT2 in 30 human GBM specimens. Some data points overlap. (H) Feature plots showing HIF1A expression (top row) and the transcriptional module scores of hypoxia-related gene sets derived from MSigDB (middle row) or the meta-program (bottom row). (I) Scatter plots showing the relationship between SHMT1/2 and HIF1A expression in SHMT1/2-negative and SHMT1/2-positive cells. Correlations were evaluated using Pearson’s correlation coefficient. (J) Scatter plots showing the relationship between SHMT1/2 expression and the transcriptional module scores of hypoxia-related genes from MSigDB in SHMT1/2-negative and SHMT1/2-positive cells. Correlations were assessed using Pearson’s correlation coefficient. Data are presented relative to the untreated S/G(+) control group. Values represent mean ± s.d. of three independent experiments (B-D). **, P < 0.01; ***, P < 0.001. NS, not significant.
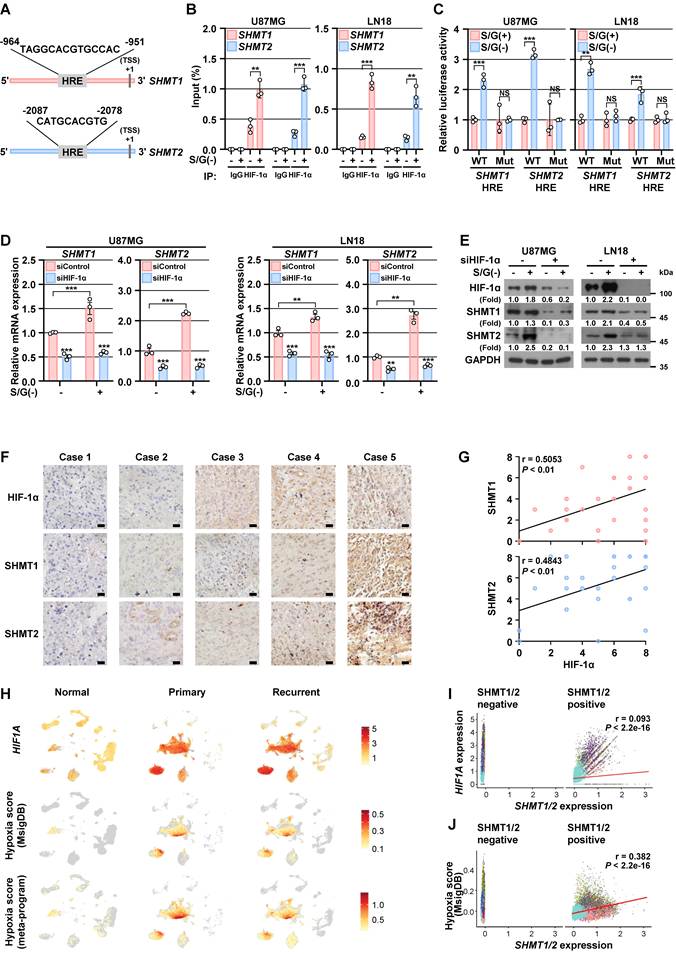
To examine the clinical relevance of the HIF-1α–SHMT1/2 axis, we analyzed 30 primary human GBM specimens. IHC analysis showed significant positive correlations between HIF-1α and SHMT1/2 protein expression (Figure 4F and 4G). scRNA-seq analysis further showed higher hypoxia scores and HIF1A expression in primary and recurrent GBM than in normal brain populations (Figure 4H). Consistent with IHC results from human primary GBM specimens, similar correlations were observed at the single-cell level: SHMT1 and SHMT2 mRNA levels positively correlated with HIF1A mRNA levels in tumor cells, TAMs, and oligodendrocytes (Figure 4I), as well as with the hypoxia score (Figure 4J). Further analysis showed that HIF1A, similar to SHMT1, was broadly expressed across TAM populations without apparent restriction to a specific macrophage subtype or cellular origin (Figure S3E-G). Consistently, independent GEO datasets showed positive correlations between HIF1A and SHMT1/2 expression in brain tumor cohorts (Figure S4I). Together, these findings support the relevance of HIF-1α-associated SHMT1/2 regulation in human GBM.
HIF-1α–SHMT1/2-driven serine catabolism sustains redox homeostasis under S/G deprivation
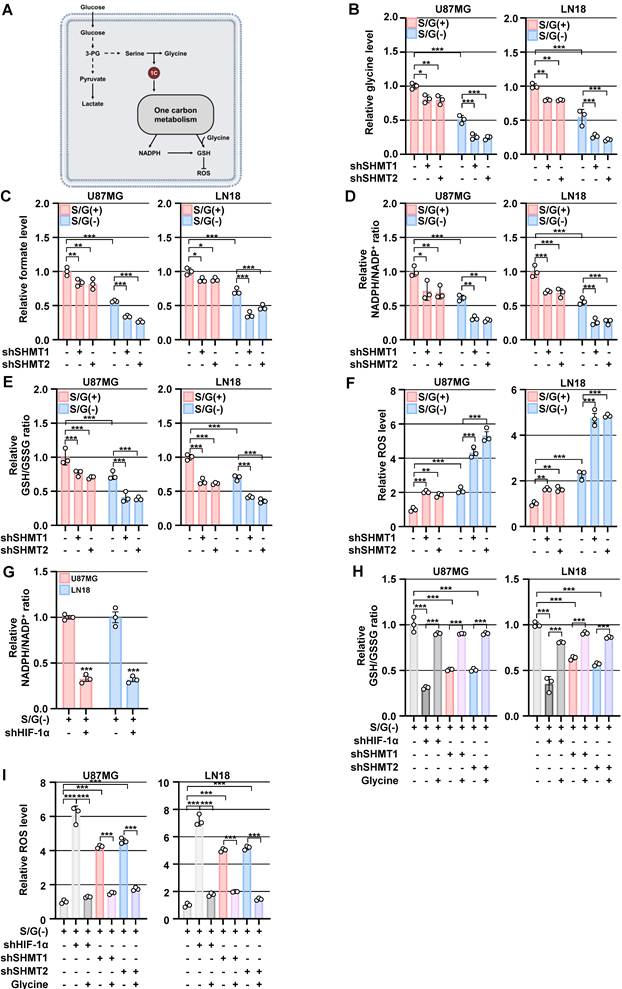
To define the functional contribution of the HIF-1α–SHMT1/2 axis to cellular adaptation under S/G-restricted conditions, we individually silenced SHMT1 and SHMT2 in GBM cells using gene-specific short hairpin RNA (shRNA). Knockdown efficiency was confirmed by immunoblotting under both S/G-containing and S/G-deprived conditions (Figure S5A). Serine catabolism via SHMT1/2 generates glycine and one-carbon units, which can support redox balance by providing glycine for GSH synthesis and by fueling one-carbon–dependent NADPH production required for regeneration of reduced GSH and detoxification of ROS [4, 5] (Figure 5A). SHMT1 or SHMT2 depletion did not significantly alter intracellular serine levels under either condition (Figure S5B), but significantly reduced intracellular glycine levels (Figure 5B). Intracellular asparagine levels were unchanged following SHMT1 or SHMT2 depletion (Figure S5C), providing an unrelated amino-acid control for these metabolic changes. SHMT1 or SHMT2 depletion also reduced intracellular formate levels (Figure 5C). Because formate generated through one-carbon metabolism can be released extracellularly [44], we additionally measured extracellular formate as an independent indicator of one-carbon metabolic activity, which was also reduced following SHMT1 or SHMT2 depletion (Figure S5D). SHMT1 or SHMT2 depletion decreased the NADPH/NADP⁺ ratio (Figure 5D) and the GSH/GSSG ratio (Figure 5E), while increasing ROS levels (Figure 5F); notably, these effects were more pronounced under extracellular S/G deprivation. HIF-1α inhibition similarly decreased the NADPH/NADP⁺ ratio (Figure 5G) and the GSH/GSSG ratio (Figure 5H; second bar) and increased ROS accumulation in S/G-deprived GBM cells (Figure 5I; second bar). Importantly, glycine supplementation restored the reduced GSH/GSSG ratio (Figure 5H) and attenuated the elevated ROS levels (Figure 5I) caused by HIF-1α inhibition or SHMT1/2 silencing under S/G-deprived conditions. In SHMT1/2-depleted cells, glycine supplementation also partially restored intracellular formate levels (Figure S5E) and the NADPH/NADP⁺ ratio (Figure S5F). Collectively, these findings indicate that HIF-1α–SHMT1/2-mediated serine catabolism supports NADPH/GSH-dependent redox homeostasis under S/G-restricted conditions.
HIF-1α–SHMT1/2-driven serine catabolism sustains redox homeostasis under S/G deprivation. (A) Schematic illustrating the contribution of serine catabolism-derived glycine and one-carbon units to redox homeostasis. (B-F) The specified cell lines with or without SHMT1 or SHMT2 depletion were maintained in S/G(-) or control media for 24 h. Glycine levels (B), formate levels (C), the NADPH/NADP+ ratio (D), the GSH/GSSG ratio (E), and ROS levels (F) were measured. (G) The specified cell lines with or without HIF-1α depletion were maintained in S/G(-) media for 24 h. The NADPH/NADP+ ratio was measured. (H and I) The specified cell lines with or without HIF-1α, SHMT1, or SHMT2 depletion were cultured under S/G-deprived conditions for 24 h, with or without supplementation of glycine (1 mM). The GSH/GSSG ratio (H) and ROS levels (I) were measured. Data are presented relative to the untreated S/G(+) control group. Values represent mean ± s.d. of three independent experiments (B-I). *, P < 0.05; **, P < 0.01; ***, P < 0.001.
HIF-1α–SHMT1/2-mediated serine catabolism supports ferroptosis resistance under S/G deprivation
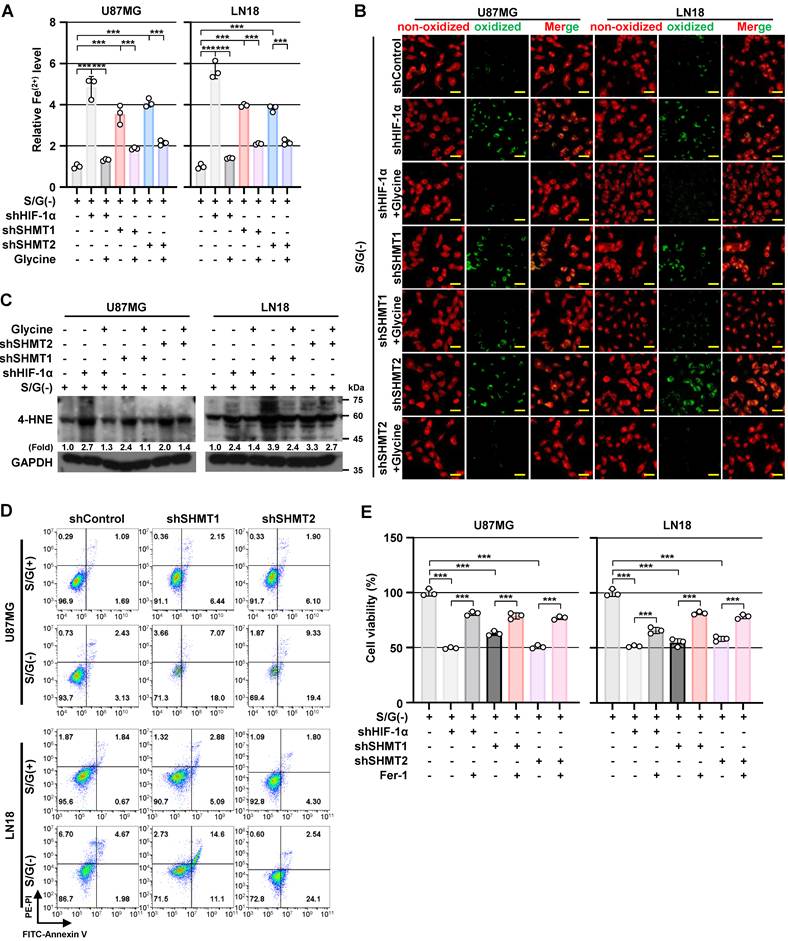
We next investigated whether HIF-1α–SHMT1/2-dependent serine catabolism protects GBM cells from ferroptotic stress under S/G deprivation. Silencing of HIF-1α or SHMT1/2 markedly increased ferroptosis-associated phenotypes, including elevated Fe²⁺ (Figure 6A), enhanced lipid peroxidation (lipid ROS; Figure 6B), and increased 4-HNE accumulation (Figure 6C) under S/G-deprived conditions. Notably, glycine supplementation significantly attenuated these changes (Figure 6A–6C), consistent with its protective effects on redox homeostasis observed above. SHMT1 or SHMT2 depletion increased Annexin V/PI-positive cell populations (Figure 6D) and reduced cell numbers (Figure S6A) under both S/G-containing and S/G-deprived conditions in GBM cells. Consistently, SHMT1/2 depletion reduced cyclin D1, c-Myc, and Bcl-2 expression and increased PARP cleavage (Figure S6B), indicating reduced proliferative signaling accompanied by activation of apoptotic signaling. Importantly, Fer-1 significantly restored cell viability following HIF-1α or SHMT1/2 disruption (Figure 6E), while only partially reducing Annexin V/PI-positive apoptotic cell populations (Figure S6C), indicating that ferroptosis is a major contributor to the loss of viability. Furthermore, glycine supplementation partially restored cell viability following HIF-1α inhibition or SHMT1/2 depletion under S/G-deprived conditions (Figure S6D). Single-cell analysis revealed that SHMT1/2 expression correlated more strongly with ferroptosis-suppressor gene scores (Pearson’s R = 0.554) than with marker (R = 0.351) or driver gene scores (R = 0.090) in GBM cells (Figure S6E), linking SHMT1/2 expression to ferroptosis-suppressive transcriptional programs. Collectively, these findings indicate that HIF-1α–SHMT1/2-mediated serine catabolism supports ferroptosis resistance in GBM cells under S/G-restricted conditions.
HIF-1α–SHMT1/2-mediated serine catabolism supports ferroptosis resistance under S/G deprivation. (A) The specified cell lines with or without HIF-1α, SHMT1, or SHMT2 depletion were cultured under S/G-deprived conditions for 24 h, with or without glycine (1 mM) supplementation. Cellular Fe²⁺ levels were measured. (B) The specified cell lines with or without HIF-1α, SHMT1, or SHMT2 depletion were maintained in S/G(-) media for 24 h in the presence or absence of glycine (1 mM), and stained with BODIPY C11. Representative fluorescence images showing changes in lipid ROS accumulation are shown. Scale bar, 60 μm. (C) The specified cell lines with or without HIF-1α, SHMT1, or SHMT2 depletion were cultured under S/G-deprived conditions for 24 h, with or without glycine (1 mM) supplementation. Protein expression was examined by IB. (D) The specified cell lines with or without SHMT1 or SHMT2 depletion were maintained in S/G(-) or control media for 48 h. Apoptosis was analyzed by flow cytometry. (E) The specified cell lines with or without HIF-1α, SHMT1, or SHMT2 depletion were maintained in S/G(-) medium for 96 h in the presence or absence of Fer-1 (5 μM), and cell viability was measured. Values represent mean ± s.d. of three independent experiments (A, E). ***, P < 0.001.
Pharmacological inhibition of SHMT disrupts redox homeostasis and sensitizes GBM cells to ferroptotic stress
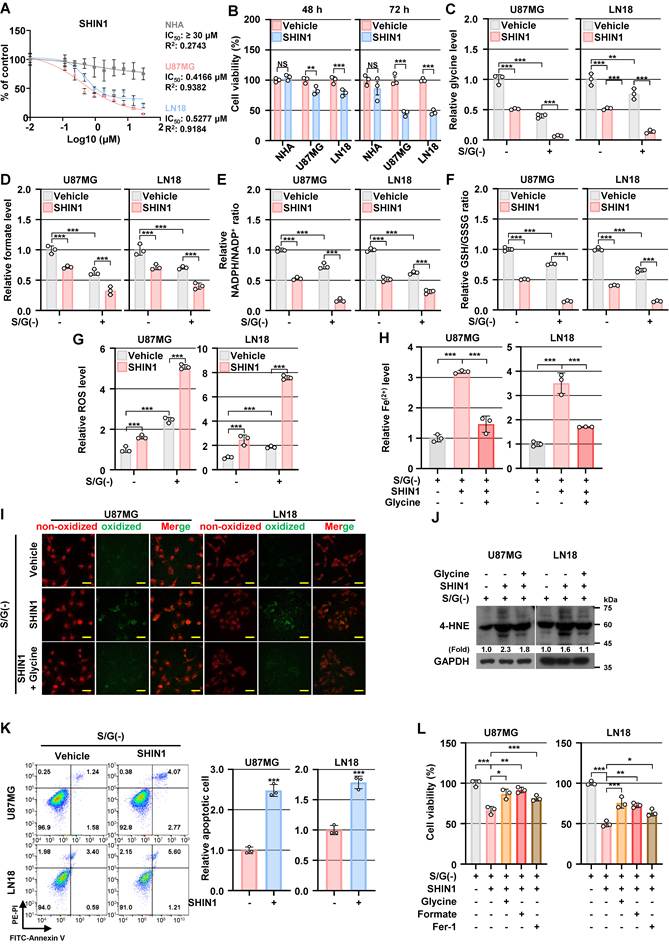
We next evaluated pharmacological SHMT inhibition using the SHMT inhibitor SHIN1 [45]. Because higher expression levels of SHMT1/2 were observed in GBM cells than in NHA cells, we determined the half-maximal inhibitory concentration (IC50) of SHIN1 on NHA and GBM cells. WST-8 assay revealed that SHIN1 reduced GBM cell viability with IC50 values of 0.4166 μM in U87MG and 0.5277 μM in LN18 cells after 72 h, whereas the IC50 exceeded 30 μM in NHA (Figure 7A). At 500 nM, SHIN1 reduced GBM cell viability at both 48 and 72 h, with substantially less effect on NHA (Figure 7B). Consistent with these results, SHIN1 also progressively reduced growth of GBM cells under both control and S/G-restricted conditions (Figure S7A). Sertraline, an FDA-approved selective serotonin reuptake inhibitor (SSRI) widely prescribed for depression, has recently been reported as a repurposed potent SHMT inhibitor [46, 47]. Sertraline similarly reduced GBM cell viability, with a greater reduction under S/G-deprived conditions (Figure S7B). The inhibitory effects of SHIN1 and sertraline on cell viability were also observed in patient-derived glioma stem cells (Figure S7C and S7D). Consistent with the SHMT1/2 silencing results, treatment with SHIN1 or sertraline significantly decreased the intracellular glycine (Figure 7C and Figure S7E), formate (Figure 7D and Figure S7F), NADPH/NADP+ ratio (Figure 7E and Figure S7G) and the GSH/GSSG ratio (Figure 7F and Figure S7H), while increasing ROS levels (Figure 7G and Figure S7I) in GBM cells, with these effects being more pronounced under S/G-deprived conditions than under basal conditions. Pharmacological SHMT inhibition also increased ferroptosis-associated phenotypes, including intracellular Fe²⁺ accumulation (Figure 7H and Figure S7J), lipid ROS (Figure 7I and Figure S7K), and 4-HNE accumulation (Figure 7J and Figure S7L), accompanied by reduced viability and limited apoptotic signaling (Figure 7K and Figure S7M) under S/G-deprived conditions in GBM cells. Notably, glycine supplementation significantly attenuated SHIN1- or sertraline-induced ferroptosis-associated phenotypes (Figure 7H-7J and Figure S7J-S7L). Moreover, supplementation with glycine or formate, as well as Fer-1 treatment, partially restored cell viability following SHIN1 or sertraline treatment under S/G-deprived conditions (Figure 7L and Figure S7N). Collectively, these pharmacological data indicate that inhibition of SHMT-mediated serine catabolism disrupts redox homeostasis and increases ferroptotic susceptibility in GBM cells under S/G-restricted conditions.
Pharmacological inhibition of SHMT disrupts redox homeostasis and sensitizes GBM cells to ferroptotic stress. (A) The specified cell lines were maintained in complete growth media with or without the indicated concentrations of SHIN1 for 72 h. Cell viability was assessed using the WST-8 assay and normalized to the untreated control. IC₅₀ values were calculated using nonlinear regression analysis. (B) The specified cell lines were maintained in complete growth media with or without SHIN1 (500 nM) for 48 or 72 h. Cell viability was assessed using the WST-8 assay and normalized to the untreated control. (C-G) The specified cell lines were maintained in S/G(-) or control media in the presence or absence of SHIN1 (500 nM) for 24 h. Glycine levels (C), formate levels (D), the NADPH/NADP+ ratio (E), the GSH/GSSG ratio (F), and ROS levels (G) were measured. (H) The specified cell lines were maintained in S/G(-) media in the presence or absence of SHIN1 (500 nM) or glycine (1 mM) for 24 h. Intracellular Fe²⁺ levels were measured. (I) The specified cell lines were maintained in S/G(-) media in the presence or absence of SHIN1 (500 nM) or glycine (1 mM) for 24 h, and stained with BODIPY C11. Representative fluorescence images showing changes in lipid ROS accumulation are shown. Scale bar, 60 μm. (J) The specified cell lines were maintained in S/G(-) media in the presence or absence of SHIN1 (500 nM) or glycine (1 mM) for 24 h. IB analyses were performed using the indicated antibodies. (K) The specified cell lines were maintained in S/G(-) media in the presence or absence of SHIN1 (500 nM) for 48 h. Apoptosis was analyzed by Annexin V/PI flow cytometry. Representative flow cytometry plots and quantification of relative apoptotic cells from three independent experiments are shown. (L) The specified cell lines were cultured under S/G-deprived conditions for 96 h, with or without SHIN1 (500 nM), glycine (0.4 mM), formate (0.5 mM), or Fer-1 (5 μM). Cell viability was assessed using the WST-8 assay. Data are presented relative to the untreated S/G(+) control group. Values represent mean ± s.d. of three independent experiments (B-H, K, L). *, P < 0.05; **, P < 0.01; ***, P < 0.001. NS, not significant.
Genetic and pharmacological suppression of SHMT inhibits intracranial GBM growth in vivo
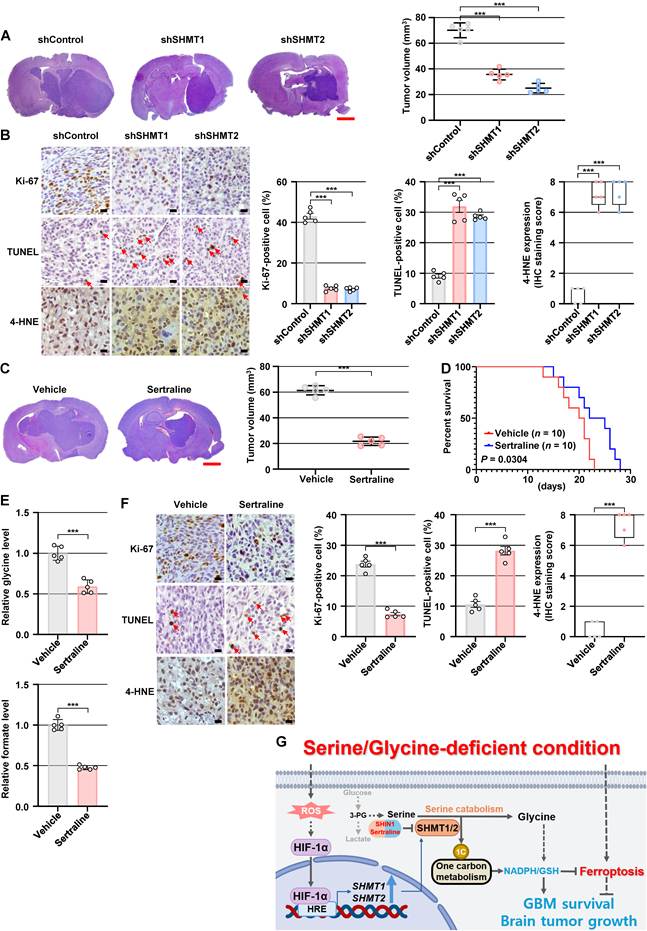
To investigate the in vivo role of SHMT1/2, we used an orthotopic GBM model generated by intracranial implantation of U87MG cells into athymic nude mice. Genetic depletion of either SHMT1 or SHMT2 significantly inhibited intracranial tumor growth (Figure 8A). SHMT1/2-depleted tumors showed increased 4-HNE staining, reduced proliferation as indicated by decreased Ki-67 positivity, and increased TUNEL-positive cells (Figure 8B). We next examined the effect of pharmacological SHMT targeting in vivo. Sertraline treatment suppressed intracranial U87MG tumor growth (Figure 8C). In an independent survival cohort, sertraline treatment significantly prolonged survival compared with vehicle treatment (Figure 8D). To determine whether sertraline treatment alters serine catabolism within tumors, we further analyzed intratumoral metabolites. Sertraline treatment significantly reduced glycine and formate levels in intracranial tumors (Figure 8E), consistent with disruption of serine catabolism in vivo. Sertraline-treated tumors similarly showed increased 4-HNE staining, decreased Ki-67 positivity, and increased TUNEL-positive cells (Figure 8F). Collectively, these in vivo data indicate that SHMT1/2 supports intracranial GBM growth and that sertraline treatment is associated with altered serine catabolism, increased lipid peroxidation–linked damage, suppressed tumor growth, and prolonged survival.
Genetic and pharmacological suppression of SHMT inhibits intracranial GBM growth in vivo. (A) A total of 1 × 10⁶ control, SHMT1-depleted, or SHMT2-depleted U87MG cells were implanted intracranially into athymic nude mice. At day 28, animals were euthanized for tumor evaluation, and coronal brain sections stained with hematoxylin and eosin (H&E) show representative xenograft lesions (left panel). Tumor length (L) and width (W) were measured from H&E-stained coronal brain sections, and tumor volume (V) was calculated as V = (L × W²)/2. Data represent the mean ± s.d. of five mice (right panel). ***, P < 0.001. Scale bar, 1 mm. (B) Tumor sections were subjected to IHC using anti-Ki-67 and anti-4-HNE antibodies and to TUNEL staining. Representative images (left panel) and quantification (right panel) are shown. Data represent the mean ± s.d. of five mice. ***, P < 0.001. Scale bar, 40 μm. (C) A total of 1 × 10⁶ U87MG cells were implanted into the brains of athymic nude mice. One week after cell injection, mice received intraperitoneal injection of sertraline (25 mg/kg) every other day. On day 28, animals were euthanized for histological tumor evaluation, and coronal brain sections stained with hematoxylin and eosin (H&E) show representative xenograft lesions (left panel). Tumor length (L) and width (W) were measured from H&E-stained coronal brain sections, and tumor volume (V) was calculated as V = (L × W²)/2. Data represent the mean ± s.d. of five mice (right panel). ***, P < 0.001. Scale bar, 1 mm. (D) Kaplan–Meier survival analysis of mice bearing orthotopic U87MG xenografts treated with vehicle or sertraline (n = 10 mice per group). Statistical significance was determined using the log-rank (Mantel–Cox) test. (E) Measurement of intratumoral glycine and formate levels in xenograft tumors from the indicated groups. Data represent the mean ± s.d. of five mice. ***, P < 0.001. (F) Tumor sections were analyzed by IHC for Ki-67 and 4-HNE, together with TUNEL staining. Representative micrographs (left panel) and the corresponding quantitative results (right panel) are presented. Data represent the mean ± s.d. of five mice. ***, P < 0.001. Scale bar, 40 μm. (G) Schematic illustrating how the HIF-1α–SHMT1/2 axis promotes serine catabolism to support redox homeostasis and ferroptosis resistance under limited S/G availability in the brain microenvironment, thereby supporting GBM cell survival and tumor growth.
Discussion
Serine biosynthesis and one-carbon metabolism are frequently rewired in cancer to support biosynthetic and redox demands [4, 48], and targeting the serine synthesis pathway can suppress tumor growth in vitro and in vivo [38, 49-56]. Notably, we previously showed that GBM specimens exhibit elevated SSP enzyme expression associated with poorer outcomes, and that HIF-1α activation promotes glucose-derived de novo serine biosynthesis by coordinately inducing SSP enzymes and glycolysis-related genes [38]. Building on these findings, the present study identifies SHMT1/2-mediated serine catabolism as an additional, coordinated adaptation in GBM under restricted S/G availability. Mechanistically, S/G restriction activated ROS-dependent HIF-1α signaling, which transcriptionally induced SHMT1/2 and supported serine catabolism linked to glycine and one-carbon metabolism, thereby sustaining NADPH/GSH-dependent redox homeostasis and ferroptosis resistance. Together, these findings support a model in which the ROS–HIF-1α–SHMT1/2 axis couples adaptation to restricted S/G availability with serine-catabolic redox defense and ferroptosis resistance, supporting GBM survival and proliferation in vitro as well as intracranial tumor growth in vivo (Figure 8G).
Prior studies have implicated multiple upstream pathways, including NRF2–activating transcription factor 4 (ATF4) signaling and c-Myc as transcriptional activators of SHMT1/2, whereas glycogen synthase kinase 3 (GSK3) has been reported to repress SHMT2 transcription [56-58]. In addition, Ye et al. demonstrated that SHMT2 expression positively correlates with HIF-1α-regulated enzymes under hypoxia and that hypoxia induces SHMT2 [59], supporting a link between HIF-1α signaling and SHMT regulation. Our data extend this framework by showing that HIF-1α transcriptionally regulates both cytosolic SHMT1 and mitochondrial SHMT2 in GBM under restricted S/G availability. HIF-1α binding to the SHMT1 and SHMT2 promoter regions, together with the attenuation of S/G deprivation-induced promoter activation by mutation of the corresponding HREs, supports direct HIF-1α-mediated transcriptional control of both SHMT isoforms. Consistent with this regulatory relationship, SHMT1/2 expression was positively associated with HIF-1α in human GBM specimens and single-cell datasets. Our findings further identify SHMT1/2-mediated serine catabolism as one component of the HIF-1α-dependent metabolic response that supports ferroptosis resistance under restricted S/G availability. Given the highly active glucose metabolism [60] and frequent HIF-1α overexpression [61] in GBM, our previous [38] and current findings together underscore the role of HIF-1α as a central metabolic coordinator. Importantly, HIF-1α functions upstream of SHMT1/2 but regulates metabolic processes beyond SHMT-mediated serine catabolism. Our previous study established HIF-1α-dependent regulation of SSP enzymes and glycolytic genes as a mechanism supporting glucose-derived serine production [38], whereas the present study identifies HIF-1α-dependent SHMT1/2 induction as an additional mechanism supporting serine catabolism. Accordingly, the stronger phenotypes observed following HIF-1α depletion may reflect disruption of multiple HIF-1α-regulated metabolic processes beyond SHMT-mediated serine catabolism. Together, these findings suggest that HIF-1α coordinates serine biosynthesis and catabolism to support metabolic adaptation and redox homeostasis in GBM.
GSH plays an essential role in maintaining redox balance and preserving cellular homeostasis [14, 62]. In particular, GSH synthesis requires glycine together with cysteine and glutamate, thereby providing a direct link between serine–glycine metabolism and cellular antioxidant capacity [62]. Reduced GSH, in turn, serves as a reducing substrate for GPX4-mediated detoxification of lipid hydroperoxides, thereby limiting lipid peroxidation and ferroptotic cell death [17, 63]. In this context, our data place SHMT1/2-mediated serine catabolism at a strategic node linking amino-acid metabolism to ferroptosis control: serine catabolism supplies glycine for GSH synthesis and generates one-carbon units that support folate-dependent NADPH production [59]. Accordingly, disruption of the HIF-1α–SHMT1/2 axis diminished NADPH and GSH redox capacity and increased ROS accumulation and ferroptosis-associated phenotypes under S/G deprivation. Conversely, glycine supplementation improved the GSH/GSSG ratio and attenuated ROS accumulation, while partially restoring intracellular formate levels and the NADPH/NADP⁺ ratio in SHMT1/2-depleted cells. This partial recovery may reflect residual one-carbon metabolic capacity within the interconnected serine–glycine/one-carbon network, including glycine-utilizing pathways such as the mitochondrial glycine cleavage system [5, 64]. However, because we did not directly trace the metabolic origin of the recovered one-carbon output, we do not interpret these findings as complete restoration of serine-derived one-carbon metabolism. Notably, S/G deprivation also induced NRF2, SLC7A11, and GPX4, which likely reflects an adaptive antioxidant response to oxidative stress. SLC7A11-mediated cystine uptake supports cysteine availability for GSH synthesis [62, 65], while GPX4 utilizes GSH to suppress lipid peroxidation [17, 63]. However, induction of these antioxidant defenses was insufficient to prevent ferroptotic stress when NADPH/GSH-dependent antioxidant capacity was compromised. Thus, increased expression of these antioxidant defenses, including GPX4, does not necessarily indicate preserved lipid peroxide detoxification when GSH-dependent redox capacity is impaired. Our single-cell RNA-seq analyses of primary and recurrent GBM specimens revealed marked intratumoral heterogeneity in ferroptosis-related gene expression (Figure 1I), indicating heterogeneous ferroptosis-associated transcriptional states across GBM cells. Consistent with the recognized involvement of ferroptosis in glioma biology [66-68], our functional analyses showed that S/G deprivation induced a mixed cell-death response in GBM cells, with ferroptosis representing a predominant, but not exclusive, component. Together, these findings indicate that SHMT1/2-mediated serine catabolism supports ferroptosis resistance by maintaining glycine- and one-carbon-linked NADPH/GSH redox homeostasis under restricted S/G availability in GBM. Given that radiotherapy imposes substantial oxidative stress in GBM and that antioxidant defenses can contribute to radioresistance [69], the SHMT1/2-dependent redox defense identified here may also have implications for cellular responses to radiation, although this possibility remains to be directly investigated.
Although SHMT1 and SHMT2 catalyze the same enzymatic reaction, they function in distinct subcellular compartments, with SHMT1 operating primarily in the cytosol and SHMT2 in the mitochondria. Despite this compartmental distinction, the two isoforms remain metabolically interconnected through serine–glycine and one-carbon metabolism. Mitochondrial serine catabolism generates one-carbon units that can be released as formate and supplied to the cytosolic one-carbon pool, thereby linking mitochondrial and cytosolic one-carbon metabolism [44, 70]. Ducker et al. further demonstrated that disruption of mitochondrial one-carbon metabolism induces reversal of cytosolic one-carbon flux, allowing extracellular serine to support cytosolic one-carbon-unit production under nutrient-replete conditions, while also increasing dependence on extracellular glycine for GSH synthesis [70]. Thus, metabolic compensation between the two compartments is possible but depends on extracellular nutrient availability. Importantly, such compensation does not imply complete functional interchangeability. Lee et al. showed that SHMT1-mediated cytosolic one-carbon flux can become predominant under physiological folate conditions and that SHMT1 depletion can impair pyrimidine biosynthesis and tumor growth despite an intact mitochondrial one-carbon pathway [71], whereas Minton et al. demonstrated that specific mitochondrial functions of SHMT2 cannot be fully replaced by cytosolic SHMT1 [72]. Consistent with this context-dependent metabolic interdependence, depletion of either SHMT1 or SHMT2 reduced glycine and formate levels, impaired NADPH/GSH-dependent redox homeostasis, and increased ferroptosis-associated phenotypes under S/G-deprived conditions. Notably, depletion of either isoform did not induce detectable upregulation of the reciprocal isoform at the protein level (Figure S5A), indicating that expression-level compensation was not evident, although compensation at the metabolic-flux level cannot be excluded. Under S/G-restricted conditions, limited extracellular serine and glycine would be expected to constrain cytosolic one-carbon production and GSH synthesis, respectively, thereby limiting the metabolic and redox flexibility required for effective compensation [70]. Accordingly, our findings suggest that the remaining SHMT pathway is insufficient to fully maintain glycine/one-carbon and redox homeostasis following depletion of the other isoform under S/G restriction. Thus, SHMT1 and SHMT2 appear to exhibit context-dependent metabolic plasticity rather than complete functional interchangeability. Because compartment-specific metabolic flux and intercompartmental metabolite exchange were not directly traced in the present study, the extent of flux-level compensation, the precise intercompartmental exchange mechanisms, and the relative quantitative contributions of SHMT1 and SHMT2 remain to be determined. Whether simultaneous depletion of both isoforms produces additive or synergistic effects also warrants further investigation.
From a translational perspective, our data suggest that SHMT-dependent serine catabolism is a context-dependent vulnerability in GBM that becomes particularly relevant under nutrient-stress conditions that are likely encountered in the S/G-limited brain microenvironment. Although human studies indicate relatively limited serine and glycine availability in the central nervous system [8-10], the absolute concentrations of these amino acids within human GBM tissues remain insufficiently characterized. Thus, the S/G-deprived condition used here should be considered an experimental model of restricted extracellular S/G availability rather than a direct representation of the nutrient concentrations within patient tumors. This implies that therapeutic benefit may depend not only on SHMT expression but also on the metabolic state of the tumor, highlighting the need for biomarkers that reflect nutrient stress and redox dependence. The preferential impact of SHMT inhibition on GBM cells compared with normal astrocytes suggests the possibility of a therapeutic window, although effective pharmacological targeting in GBM will also depend on brain exposure and target selectivity. In this regard, although SHIN1 provides a relatively selective pharmacological approach for investigating SHMT function in vitro, its negligible brain penetration following systemic administration limits its utility in orthotopic GBM models [73]. Moreover, SHIN1 has been reported to undergo rapid clearance and to have pharmacokinetic properties unsuitable for in vivo studies [74]. In contrast, previous pharmacokinetic studies have demonstrated substantial distribution of sertraline into brain tissue [75, 76], providing a rationale for its use in our orthotopic GBM model. In the present study, sertraline treatment significantly reduced intratumoral glycine and formate levels, providing metabolic evidence consistent with disruption of serine catabolism in vivo. However, sertraline has pleiotropic biological activities beyond SHMT inhibition, including effects on apoptotic signaling, redox homeostasis, autophagy, endoplasmic reticulum stress, and lysosomal function [77-81]. Thus, the antitumor activity of sertraline cannot be attributed exclusively to SHMT inhibition. Nevertheless, the concordant metabolic and ferroptosis-associated effects observed with sertraline, the more selective SHMT inhibitor SHIN1, and genetic SHMT1/2 depletion are consistent with a contribution of SHMT-associated metabolic disruption to ferroptotic stress under S/G-restricted conditions.
Beyond tumor-intrinsic metabolism, our single-cell analyses revealed that SHMT1 and SHMT2 are markedly elevated in tumor-associated macrophages (Figure 3C), the predominant immune cell population in the GBM microenvironment, raising the possibility that SHMT-dependent metabolic programs may also operate within the myeloid compartment. Further analysis revealed substantial TAM heterogeneity without restriction of SHMT expression to a specific subtype or cellular origin (Figure S3G), although the functional roles of SHMT1/2 in TAMs and their potential influence on the GBM immune microenvironment remain to be determined in immunocompetent models. Several limitations should also be acknowledged. Although our data identify ROS as an upstream mediator of HIF-1α activation under S/G deprivation, the precise cellular source of this ROS remains unclear. ROS accumulation may reflect both increased generation associated with cellular redox imbalance and reduced antioxidant capacity resulting from impaired NADPH/GSH homeostasis, warranting further investigation of mitochondrial and other cellular ROS sources. In addition, our in vivo validation was performed in a single orthotopic xenograft model, warranting validation in additional GBM models, including patient-derived and immunocompetent systems, to establish the generalizability of these findings.
Conclusions
Our study identifies the HIF-1α–SHMT1/2 axis as a key metabolic adaptation that supports GBM survival under S/G limitation relevant to the brain microenvironment. HIF-1α directly induces SHMT1 and SHMT2 to engage serine catabolism, supporting glycine and one-carbon metabolism to sustain NADPH and GSH redox capacity. This program reinforces redox homeostasis and limits ferroptotic stress. Importantly, genetic and pharmacological disruption of SHMT-mediated serine catabolism compromised redox homeostasis, increased ferroptosis-associated phenotypes, and suppressed GBM growth in vitro and in vivo. Collectively, these findings identify HIF-1α-mediated SHMT-dependent serine catabolism as a context-dependent metabolic vulnerability that contributes to redox homeostasis and ferroptosis resistance in GBM.
Abbreviations
GBM: glioblastoma; SHMT: serine hydroxymethyltransferase; HIF: hypoxia-inducible factor; S/G: serine/glycine; SSP: serine synthesis pathway; 3-PG: 3-phosphoglycerate; PHGDH: phosphoglycerate dehydrogenase; PSAT1: phosphoserine aminotransferase 1; PSPH: phosphoserine phosphatase; NADPH/NADP+: reduced/oxidized nicotinamide adenine dinucleotide phosphate; GSH: glutathione; GPX4: glutathione peroxidase 4; ROS: reactive oxygen species; GEO: Gene Expression Omnibus; TCGA: The Cancer Genome Atlas; CGGA: Chinese Glioma Genome Atlas; scRNA-seq: single-cell RNA sequencing; IHC: immunohistochemistry; PCR: polymerase chain reaction; NHA: normal human astrocytes; GSC: glioblastoma stem-like cell; GSEA: gene set enrichment analysis; NRF2: nuclear factor-erythroid 2-related factor 2; SLC7A11: solute carrier family 7 member 11; SOD2: superoxide dismutase 2; NAC: N-acetyl-L-cysteine; H2O2: hydrogen peroxide; HRE: hypoxia-responsive element; ChIP: chromatin immunoprecipitation; siRNA: small interfering RNA; CoCl2: cobalt (II) chloride; shRNA: short hairpin RNA; GSSG: glutathione disulfide; DEGs: differentially expressed genes; Fer-1: ferrostatin-1; Lip-1: liproxstatin-1; Z-VAD: Z-VAD-FMK; Nec-1: necrostatin-1; 4-HNE: 4-hydroxynonenal; FTH1: ferritin heavy chain 1; CHAC1: glutathione-specific gamma-glutamylcyclotransferase 1; PTGS2: prostaglandin-endoperoxide synthase 2; PARP: poly(ADP-ribose) polymerase; IC50: half-maximal inhibitory concentration; TUNEL: terminal deoxynucleotidyl transferase dUTP nick end labeling; ATF4: activating transcription factor 4; GSK3: glycogen synthase kinase 3; FBS: fetal bovine serum; dFBS: dialyzed fetal bovine serum; RT: room temperature; PI: propidium iodide; qPCR: quantitative real-time PCR; CT: cycle threshold; IB: immunoblotting; SDS: sodium dodecyl sulfate; PAGE: polyacrylamide gel electrophoresis; MEC: medial entorhinal cortex; MTG: middle temporal gyrus; M1C: primary motor cortex; STG: superior temporal gyrus; UMAP: uniform manifold approximation and projection; GO: gene ontology; H&E: hematoxylin and eosin; DAB: 3,3’-diaminobenzidine; TdT: terminal deoxynucleotidyl transferase; SD: standard deviation; TAM: tumor-associated macrophage; SSRI: selective serotonin reuptake inhibitor.
Supplementary Material
Supplementary figures and tables.

Supplementary data file 1.
Supplementary data file 2.
Supplementary data file 3.
Acknowledgements
We thank Dr. Hyunggee Kim (Korea University, Seoul, Republic of Korea) for providing LN18, T98G, A172, and LN229 cells and normal human astrocytes (NHA), and Dr. In Ah Kim (Seoul National University, Seoul, Republic of Korea) for providing U251 cells.
During the preparation of this work, the authors used ChatGPT (OpenAI) solely for English language polishing, including grammar correction and improvements in clarity and readability. No AI tools were used for data collection, data analysis, image generation or manipulation, or interpretation of the results. The authors reviewed and verified the AI-assisted revisions and take full responsibility for the content and integrity of the manuscript.
Funding
This work was supported by the National Research Foundation of Korea (NRF) grants funded by the Korean government (MSIT; RS-2026-25485153 to J-HL and RS-2024-00411767 to HJY), the Dongnam Institute of Radiological & Medical Sciences (DIRAMS) grant funded by the Korean government (50702-2026 to KH), the National Natural Science Foundation of China (82202615 to SW), the Research Scholar Grant (RSG-19-185-01-MPC) from the American Cancer Society (JYY), and R21NS123685 and R01CA276942 from the National Institutes of Health (NIH) (JYY).
Authorship contributions
Study conception: HJY, JYY, Y-YP, SW, and J-HL; Experimental Design: HJY, BK, KH, JYY, Y-YP, SW, and J-HL; Performed experiments: HJY, BK, EBL, SHP, EHK, RL, Y-YP, and SW; Data interpretation and analysis: HJY, BK, SE, KH, JYY, Y-YP, SW, and J-HL; Manuscript writing: HJY, BK, JYY, Y-YP, SW, and J-HL. All authors reviewed and approved the final version of the manuscript.
Availability of data and materials
The data supporting the findings of this study are provided in the main text, Supplementary Information, and accompanying Data Files S1–S3. The RNA-seq dataset (GSE235422) used for the transcriptomic reanalysis was previously generated and deposited in the NCBI Gene Expression Omnibus (GEO) as part of our earlier study [38].
Ethics approval and consent to participate
The Clinical Research Ethics Committee of the First Affiliated Hospital of Wenzhou Medical University approved the collection of human specimens (2023-R262), with written informed consent obtained from all participants. Animal experiments were conducted at Dong-A University in compliance with applicable institutional and national animal welfare guidelines. The experimental procedures and animal housing conditions were approved by the Institutional Animal Care and Use Committee of Dong-A University (DIACUC-26-07).
Competing Interests
The authors have declared that no competing interest exists.
References
1. Hanahan D, Weinberg RA. Hallmarks of cancer: the next generation. Cell. 2011;144:646-74
2. DeBerardinis RJ, Lum JJ, Hatzivassiliou G, Thompson CB. The biology of cancer: metabolic reprogramming fuels cell growth and proliferation. Cell Metab. 2008;7:11-20
3. Cairns RA, Harris IS, Mak TW. Regulation of cancer cell metabolism. Nat Rev Cancer. 2011;11:85-95
4. Yang M, Vousden KH. Serine and one-carbon metabolism in cancer. Nat Rev Cancer. 2016;16:650-62
5. Amelio I, Cutruzzola F, Antonov A, Agostini M, Melino G. Serine and glycine metabolism in cancer. Trends Biochem Sci. 2014;39:191-8
6. Ducker GS, Rabinowitz JD. One-Carbon Metabolism in Health and Disease. Cell Metab. 2017;25:27-42
7. Ostrom QT, Gittleman H, Truitt G, Boscia A, Kruchko C, Barnholtz-Sloan JS. CBTRUS Statistical Report: Primary Brain and Other Central Nervous System Tumors Diagnosed in the United States in 2011-2015. Neuro Oncol. 2018;20:iv1-iv86
8. Perry TL, Hansen S, Kennedy J. CSF amino acids and plasma-CSF amino acid ratios in adults. J Neurochem. 1975;24:587-9
9. Martinez M, Arnalich F, Vazquez JJ, Hernanz A. Altered cerebrospinal fluid amino acid pattern in the anorexia of aging: relationship with biogenic amine metabolism. Life Sci. 1993;53:1643-50
10. Jones CM, Smith M, Henderson MJ. Reference data for cerebrospinal fluid and the utility of amino acid measurement for the diagnosis of inborn errors of metabolism. Ann Clin Biochem. 2006;43:63-6
11. Dolgodilina E, Imobersteg S, Laczko E, Welt T, Verrey F, Makrides V. Brain interstitial fluid glutamine homeostasis is controlled by blood-brain barrier SLC7A5/LAT1 amino acid transporter. J Cereb Blood Flow Metab. 2016;36:1929-41
12. Ngo B, Kim E, Osorio-Vasquez V, Doll S, Bustraan S, Liang RJ. et al. Limited Environmental Serine and Glycine Confer Brain Metastasis Sensitivity to PHGDH Inhibition. Cancer Discov. 2020;10:1352-73
13. Jiang X, Stockwell BR, Conrad M. Ferroptosis: mechanisms, biology and role in disease. Nat Rev Mol Cell Biol. 2021;22:266-82
14. Yang WS, Stockwell BR. Ferroptosis: Death by Lipid Peroxidation. Trends Cell Biol. 2016;26:165-76
15. Dixon SJ, Lemberg KM, Lamprecht MR, Skouta R, Zaitsev EM, Gleason CE. et al. Ferroptosis: an iron-dependent form of nonapoptotic cell death. Cell. 2012;149:1060-72
16. Stockwell BR, Jiang X, Gu W. Emerging Mechanisms and Disease Relevance of Ferroptosis. Trends Cell Biol. 2020;30:478-90
17. Yang WS, SriRamaratnam R, Welsch ME, Shimada K, Skouta R, Viswanathan VS. et al. Regulation of ferroptotic cancer cell death by GPX4. Cell. 2014;156:317-31
18. Friedmann Angeli JP, Schneider M, Proneth B, Tyurina YY, Tyurin VA, Hammond VJ. et al. Inactivation of the ferroptosis regulator Gpx4 triggers acute renal failure in mice. Nat Cell Biol. 2014;16:1180-91
19. Conrad M, Pratt DA. The chemical basis of ferroptosis. Nat Chem Biol. 2019;15:1137-47
20. Zheng J, Conrad M. The Metabolic Underpinnings of Ferroptosis. Cell Metab. 2020;32:920-37
21. Wei G, Huang Y, Li W, Xie Y, Zhang D, Niu Y. et al. SREBF1-based metabolic reprogramming in prostate cancer promotes tumor ferroptosis resistance. Cell Death Discov. 2025;11:75
22. Liu J, Lu X, Zeng S, Fu R, Wang X, Luo L. et al. ATF3-CBS signaling axis coordinates ferroptosis and tumorigenesis in colorectal cancer. Redox Biol. 2024;71:103118
23. Tarangelo A, Magtanong L, Bieging-Rolett KT, Li Y, Ye J, Attardi LD. et al. p53 Suppresses Metabolic Stress-Induced Ferroptosis in Cancer Cells. Cell Rep. 2018;22:569-75
24. Xue Y, Lu F, Chang Z, Li J, Gao Y, Zhou J. et al. Intermittent dietary methionine deprivation facilitates tumoral ferroptosis and synergizes with checkpoint blockade. Nat Commun. 2023;14:4758
25. Zheng H, Chen H, Cai Y, Shen M, Li X, Han Y. et al. Hydrogen sulfide-mediated persulfidation regulates homocysteine metabolism and enhances ferroptosis in non-small cell lung cancer. Mol Cell. 2024;84:4016-30 e6
26. Nie Z, Chen M, Gao Y, Huang D, Cao H, Peng Y. et al. Ferroptosis and Tumor Drug Resistance: Current Status and Major Challenges. Front Pharmacol. 2022;13:879317
27. Rao X, Huang X, Zhou Z, Lin X. An improvement of the 2^(-delta delta CT) method for quantitative real-time polymerase chain reaction data analysis. Biostat Bioinforma Biomath. 2013;3:71-85
28. Siletti K, Hodge R, Mossi Albiach A, Lee KW, Ding SL, Hu L. et al. Transcriptomic diversity of cell types across the adult human brain. Science. 2023;382:eadd7046
29. Wang L, Jung J, Babikir H, Shamardani K, Jain S, Feng X. et al. A single-cell atlas of glioblastoma evolution under therapy reveals cell-intrinsic and cell-extrinsic therapeutic targets. Nat Cancer. 2022;3:1534-52
30. Oh S, Abdelnabi J, Al-Dulaimi R, Aggarwal A, Ramos M, Davis S. et al. HGNChelper: identification and correction of invalid gene symbols for human and mouse. F1000Res. 2020;9:1493
31. Germain PL, Lun A, Garcia Meixide C, Macnair W, Robinson MD. Doublet identification in single-cell sequencing data using scDblFinder. F1000Res. 2021;10:979
32. Hao Y, Stuart T, Kowalski MH, Choudhary S, Hoffman P, Hartman A. et al. Dictionary learning for integrative, multimodal and scalable single-cell analysis. Nat Biotechnol. 2024;42:293-304
33. Korsunsky I, Millard N, Fan J, Slowikowski K, Zhang F, Wei K. et al. Fast, sensitive and accurate integration of single-cell data with Harmony. Nat Methods. 2019;16:1289-96
34. Liberzon A, Birger C, Thorvaldsdóttir H, Ghandi M, Mesirov JP, Tamayo P. The Molecular Signatures Database (MSigDB) hallmark gene set collection. Cell Syst. 2015;1:417-25
35. Gavish A, Tyler M, Greenwald AC, Hoefflin R, Simkin D, Tschernichovsky R. et al. Hallmarks of transcriptional intratumour heterogeneity across a thousand tumours. Nature. 2023;618:598-606
36. Zhou N, Yuan X, Du Q, Zhang Z, Shi X, Bao J. et al. FerrDb V2: update of the manually curated database of ferroptosis regulators and ferroptosis-disease associations. Nucleic Acids Res. 2023;51:D571-d82
37. Miller HE, Bishop AJR. Correlation AnalyzeR: functional predictions from gene co-expression correlations. BMC Bioinformatics. 2021;22:206
38. Yun HJ, Li M, Guo D, Jeon SM, Park SH, Lim JS. et al. AMPK-HIF-1alpha signaling enhances glucose-derived de novo serine biosynthesis to promote glioblastoma growth. J Exp Clin Cancer Res. 2023;42:340
39. Subramanian A, Tamayo P, Mootha VK, Mukherjee S, Ebert BL, Gillette MA. et al. Gene set enrichment analysis: a knowledge-based approach for interpreting genome-wide expression profiles. Proc Natl Acad Sci U S A. 2005;102:15545-50
40. Xie Z, Bailey A, Kuleshov MV, Clarke DJB, Evangelista JE, Jenkins SL. et al. Gene Set Knowledge Discovery with Enrichr. Curr Protoc. 2021;1:e90
41. Rojo de la Vega M, Chapman E, Zhang DD. NRF2 and the Hallmarks of Cancer. Cancer Cell. 2018;34:21-43
42. Feng L, Zhao K, Sun L, Yin X, Zhang J, Liu C. et al. SLC7A11 regulated by NRF2 modulates esophageal squamous cell carcinoma radiosensitivity by inhibiting ferroptosis. J Transl Med. 2021;19:367
43. Su IC, Su YK, Setiawan SA, Yadav VK, Fong IH, Yeh CT. et al. NADPH Oxidase Subunit CYBB Confers Chemotherapy and Ferroptosis Resistance in Mesenchymal Glioblastoma via Nrf2/SOD2 Modulation. Int J Mol Sci. 2023 24
44. Meiser J, Tumanov S, Maddocks O, Labuschagne CF, Athineos D, Van Den Broek N. et al. Serine one-carbon catabolism with formate overflow. Sci Adv. 2016;2:e1601273
45. Ducker GS, Ghergurovich JM, Mainolfi N, Suri V, Jeong SK, Hsin-Jung Li S. et al. Human SHMT inhibitors reveal defective glycine import as a targetable metabolic vulnerability of diffuse large B-cell lymphoma. Proc Natl Acad Sci U S A. 2017;114:11404-9
46. DeVane CL, Liston HL, Markowitz JS. Clinical pharmacokinetics of sertraline. Clin Pharmacokinet. 2002;41:1247-66
47. Geeraerts SL, Kampen KR, Rinaldi G, Gupta P, Planque M, Louros N. et al. Repurposing the Antidepressant Sertraline as SHMT Inhibitor to Suppress Serine/Glycine Synthesis-Addicted Breast Tumor Growth. Mol Cancer Ther. 2021;20:50-63
48. Rosenzweig A, Blenis J, Gomes AP. Beyond the Warburg Effect: How Do Cancer Cells Regulate One-Carbon Metabolism? Front Cell Dev Biol. 2018;6:90
49. Possemato R, Marks KM, Shaul YD, Pacold ME, Kim D, Birsoy K. et al. Functional genomics reveal that the serine synthesis pathway is essential in breast cancer. Nature. 2011;476:346-50
50. Locasale JW, Grassian AR, Melman T, Lyssiotis CA, Mattaini KR, Bass AJ. et al. Phosphoglycerate dehydrogenase diverts glycolytic flux and contributes to oncogenesis. Nat Genet. 2011;43:869-74
51. Sullivan MR, Mattaini KR, Dennstedt EA, Nguyen AA, Sivanand S, Reilly MF. et al. Increased Serine Synthesis Provides an Advantage for Tumors Arising in Tissues Where Serine Levels Are Limiting. Cell Metab. 2019;29:1410-21 e4
52. Jeong S, Savino AM, Chirayil R, Barin E, Cheng Y, Park SM. et al. High Fructose Drives the Serine Synthesis Pathway in Acute Myeloid Leukemic Cells. Cell Metab. 2021;33:145-59 e6
53. Tajan M, Hennequart M, Cheung EC, Zani F, Hock AK, Legrave N. et al. Serine synthesis pathway inhibition cooperates with dietary serine and glycine limitation for cancer therapy. Nat Commun. 2021;12:366
54. Ding J, Li T, Wang X, Zhao E, Choi JH, Yang L. et al. The histone H3 methyltransferase G9A epigenetically activates the serine-glycine synthesis pathway to sustain cancer cell survival and proliferation. Cell Metab. 2013;18:896-907
55. Barnabas GD, Lee JS, Shami T, Harel M, Beck L, Selitrennik M. et al. Serine Biosynthesis Is a Metabolic Vulnerability in IDH2-Driven Breast Cancer Progression. Cancer Res. 2021;81:1443-56
56. Sun L, Song L, Wan Q, Wu G, Li X, Wang Y. et al. cMyc-mediated activation of serine biosynthesis pathway is critical for cancer progression under nutrient deprivation conditions. Cell Res. 2015;25:429-44
57. DeNicola GM, Chen PH, Mullarky E, Sudderth JA, Hu Z, Wu D. et al. NRF2 regulates serine biosynthesis in non-small cell lung cancer. Nat Genet. 2015;47:1475-81
58. He L, Endress J, Cho S, Li Z, Zheng Y, Asara JM. et al. Suppression of nuclear GSK3 signaling promotes serine/one-carbon metabolism and confers metabolic vulnerability in lung cancer cells. Sci Adv. 2022;8:eabm8786
59. Ye J, Fan J, Venneti S, Wan YW, Pawel BR, Zhang J. et al. Serine catabolism regulates mitochondrial redox control during hypoxia. Cancer Discov. 2014;4:1406-17
60. Strickland M, Stoll EA. Metabolic Reprogramming in Glioma. Front Cell Dev Biol. 2017;5:43
61. Liu Q, Cao P. Clinical and prognostic significance of HIF-1alpha in glioma patients: a meta-analysis. Int J Clin Exp Med. 2015;8:22073-83
62. Xue X, Wang M, Cui J, Yang M, Ma L, Kang R. et al. Glutathione metabolism in ferroptosis and cancer therapy. Cancer Lett. 2025;621:217697
63. Ye L, Wen X, Qin J, Zhang X, Wang Y, Wang Z. et al. Metabolism-regulated ferroptosis in cancer progression and therapy. Cell Death Dis. 2024;15:196
64. Kim D, Fiske BP, Birsoy K, Freinkman E, Kami K, Possemato RL. et al. SHMT2 drives glioma cell survival in ischaemia but imposes a dependence on glycine clearance. Nature. 2015;520:363-7
65. Jyotsana N, Ta KT, DelGiorno KE. The Role of Cystine/Glutamate Antiporter SLC7A11/xCT in the Pathophysiology of Cancer. Front Oncol. 2022;12:858462
66. Liu T, Zhu C, Chen X, Guan G, Zou C, Shen S. et al. Ferroptosis, as the most enriched programmed cell death process in glioma, induces immunosuppression and immunotherapy resistance. Neuro Oncol. 2022;24:1113-25
67. Meng X, Wang Z, Yang Q, Liu Y, Gao Y, Chen H. et al. Intracellular C5aR1 inhibits ferroptosis in glioblastoma through METTL3-dependent m6A methylation of GPX4. Cell Death Dis. 2024;15:729
68. Luo Y, Tian G, Fang X, Bai S, Yuan G, Pan Y. Ferroptosis and Its Potential Role in Glioma: From Molecular Mechanisms to Therapeutic Opportunities. Antioxidants (Basel). 2022 11
69. Godoy P, Pour Khavari A, Rizzo M, Sakamoto-Hojo ET, Haghdoost S. Targeting NRF2, Regulator of Antioxidant System, to Sensitize Glioblastoma Neurosphere Cells to Radiation-Induced Oxidative Stress. Oxid Med Cell Longev. 2020;2020:2534643
70. Ducker GS, Chen L, Morscher RJ, Ghergurovich JM, Esposito M, Teng X. et al. Reversal of Cytosolic One-Carbon Flux Compensates for Loss of the Mitochondrial Folate Pathway. Cell Metab. 2016;23:1140-53
71. Lee WD, Pirona AC, Sarvin B, Stern A, Nevo-Dinur K, Besser E. et al. Tumor Reliance on Cytosolic versus Mitochondrial One-Carbon Flux Depends on Folate Availability. Cell Metab. 2021;33:190-8 e6
72. Minton DR, Nam M, McLaughlin DJ, Shin J, Bayraktar EC, Alvarez SW. et al. Serine Catabolism by SHMT2 Is Required for Proper Mitochondrial Translation Initiation and Maintenance of Formylmethionyl-tRNAs. Mol Cell. 2018;69:610-21 e5
73. Radzishevsky I, Odeh M, Bodner O, Zubedat S, Shaulov L, Litvak M. et al. Impairment of serine transport across the blood-brain barrier by deletion of Slc38a5 causes developmental delay and motor dysfunction. Proc Natl Acad Sci U S A. 2023;120:e2302780120
74. Garcia-Canaveras JC, Lancho O, Ducker GS, Ghergurovich JM, Xu X, da Silva-Diz V. et al. SHMT inhibition is effective and synergizes with methotrexate in T-cell acute lymphoblastic leukemia. Leukemia. 2021;35:377-88
75. Peng Q, Masuda N, Jiang M, Li Q, Zhao M, Ross CA. et al. The antidepressant sertraline improves the phenotype, promotes neurogenesis and increases BDNF levels in the R6/2 Huntington's disease mouse model. Exp Neurol. 2008;210:154-63
76. Tremaine LM, Welch WM, Ronfeld RA. Metabolism and disposition of the 5-hydroxytryptamine uptake blocker sertraline in the rat and dog. Drug Metab Dispos. 1989;17:542-50
77. Chen S, Xuan J, Wan L, Lin H, Couch L, Mei N. et al. Sertraline, an antidepressant, induces apoptosis in hepatic cells through the mitogen-activated protein kinase pathway. Toxicol Sci. 2014;137:404-15
78. Kuwahara J, Yamada T, Egashira N, Ueda M, Zukeyama N, Ushio S. et al. Comparison of the Anti-tumor Effects of Selective Serotonin Reuptake Inhibitors as Well as Serotonin and Norepinephrine Reuptake Inhibitors in Human Hepatocellular Carcinoma Cells. Biol Pharm Bull. 2015;38:1410-4
79. Chinnapaka S, Bakthavachalam V, Munirathinam G. Repurposing antidepressant sertraline as a pharmacological drug to target prostate cancer stem cells: dual activation of apoptosis and autophagy signaling by deregulating redox balance. Am J Cancer Res. 2020;10:2043-65
80. Chen S, Xuan J, Couch L, Iyer A, Wu Y, Li QZ. et al. Sertraline induces endoplasmic reticulum stress in hepatic cells. Toxicology. 2014;322:78-88
81. Alvarez-Valadez K, Sauvat A, Diharce J, Leduc M, Stoll G, Guittat L. et al. Lysosomal damage due to cholesterol accumulation triggers immunogenic cell death. Autophagy. 2025;21:934-56
Author contact
Corresponding authors: Jong-Ho Lee, topljh19ac.kr; Silu Wang: wangsilu2008com; Yun-Yong Park, yunyongparkac.kr; Ji Young Yoo, Ji.Young.Yootmc.edu.