Impact Factor




Theranostics 2027; 17(1):697-715. doi:10.7150/thno.139060 This issue Cite
Research Paper
Arachidonic acid expands tolerogenic CD86-CPT1A⁺ dendritic cells to alleviate liver allograft rejection
Yizhang Chen1#, Hongrui Yue2#, Zanmei Bai2, Xinqiang Li3, Shanyi Zhou1, Dongdong Wu1, Yifan Ren1, Xuejun Zhao1, Hezhao Zhang1, Rui Zhang1, Zhijun Zhu4, Wei Wang5  , Jun Xu1 , Yan Wang1
1. Shanxi Provincial Key Laboratory of Digestive Diseases and Organ Transplantation, Department of Hepatobiliary Surgery and Liver Transplantation Center, The First Clinical Medical College of Shanxi Medical University, No. 85 Jiefang South Road, Yingze District, Taiyuan 030001, Shanxi, China.
2. School of Basic Medical Sciences, Shanxi Medical University, No. 56 Xinjian South Road, Yingze District, Taiyuan 030001, Shanxi, China.
3. Organ Transplantation Center, The Affiliated Hospital of Qingdao University, No. 59 Haier Road, Laoshan District, Qingdao 266100, Shandong, China.
4. Beijing Friendship Hospital, Capital Medical University, No. 95 Yong’an Road, Xicheng District, Beijing 100050, China.
5. School of Basic Medical Sciences, Peking University, No. 38 Xueyuan Road, Haidian District, Beijing 100191, China.
#These authors contributed equally.
Received 2026-6-8; Accepted 2026-10-19; Published 2027-1-1
Abstract
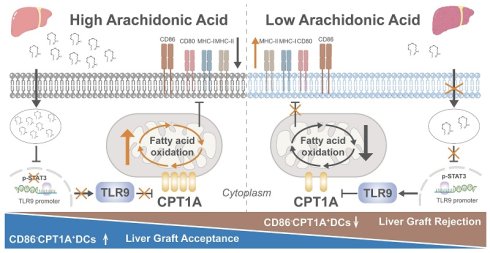
Rationale: Liver transplantation (LT) remains the only curative therapy for end-stage liver disease. Dendritic cells (DCs) are widely regarded as the principal antigen-presenting cells that drive allograft rejection. However, given the heterogeneity of DCs, the specific subsets driving liver allograft rejection remain uncharacterized, and the endogenous cues governing their functional polarization are poorly understood.
Methods: Through integrated single-cell RNA sequencing, metabolic assays, flow cytometry, and multiplex immunofluorescence in human samples, we investigated DC heterogeneity, metabolic features, and functional polarization in liver transplant recipients. Experimental models were further used to examine the role of arachidonic acid (ARA) and Toll-like receptor 9 (TLR9) signaling in DC differentiation and liver allograft rejection.
Results: We identified a previously unrecognized CD86-CPT1A+ DC subset enriched in non-rejection recipients that primarily dominated the tolerance of LT. This CD86-CPT1A+ DC subset was associated with ARA levels, and peripheral blood ARA discriminated rejection from non-rejection. Mechanistically, ARA suppresses TLR9 expression through transcriptional regulation, thereby enhancing fatty acid oxidation, which in turn promotes the formation of tolerogenic CD86⁻CPT1A⁺ DCs. In vivo, both ARA treatment and TLR9 knockdown promoted the CD86⁻CPT1A⁺ DC subset and alleviated liver allograft rejection, whereas TLR9 overexpression attenuated the effects of ARA.
Conclusions: Our findings reveal an ARA-TLR9 signaling axis that orchestrates CD86-CPT1A+ DC differentiation and highlight peripheral ARA as a potential noninvasive biomarker for liver transplant rejection.
Keywords: liver allograft rejection, dendritic cells, arachidonic acid, fatty acid oxidation, TLR9.
Introduction
With the increasing incidence of end-stage liver disease, liver transplantation (LT) has become the only effective treatment for these patients, underscoring its growing clinical importance [1]. However, transplant rejection remains a common and clinically challenging complication [2]. Acute rejection still occurs in approximately 10-30% of liver transplant recipients, whereas subclinical rejection may be detected in up to 64% of protocol biopsy cohorts, significantly compromising graft function, long-term graft survival, and patient quality of life [1]. Although conventional immunosuppressants are widely used to manage rejection, their efficacy remains limited in some patients, and long-term treatment is associated with substantial adverse effects [3]. Therefore, elucidating the immune mechanisms underlying liver allograft rejection is important to develop more effective and safer therapeutic strategies [4].
Previous studies on liver allograft rejection have largely focused on T-cell-mediated effector responses, whereas the role of dendritic cells (DCs), professional antigen-presenting cells that initiate and shape these responses, has received relatively little attention [5]. DCs are highly heterogeneous and include conventional DCs (cDCs), plasmacytoid DCs (pDCs), monocyte-derived DCs (moDCs), and tolerogenic dendritic cells (tolDCs), which differ in their developmental origin, antigen-processing capacity, cytokine secretion profile, migratory behavior, and immunoregulatory potential [6-8]. cDCs are classical DCs with strong antigen-presenting capacity; moDCs arise from monocytes under inflammatory conditions and share similar functions with cDCs; pDCs have weaker antigen presentation but produce abundant type I interferons, especially IFN-α [5, 9, 10]. In general, tolDCs tend to display an immature or semi-mature phenotype, characterized by low levels of maturation molecules such as CD80, CD86, and MHC-II, along with increased quantities of immunosuppressive factors like PD-L1, IL-10, TGF-β, and IDO [11]. Functionally, tolDCs can suppress effector T-cell activation, induce T-cell anergy or apoptosis, and promote regulatory T-cell (Treg) differentiation, suggesting a potential role in graft protection [12]. However, the mechanisms that determine the fate of DCs toward immunogenic or tolerogenic states after liver transplantation remain incompletely understood. Emerging evidence indicates that lipid metabolism is a critical regulator of DC differentiation and function, influencing DC maturation, antigen-presenting capacity, and immunogenic or tolerogenic polarization [13]. Considering that the liver plays a crucial role in lipid metabolism, its capacity to create, process, and release lipids forms a distinct lipid-dense microenvironment that can significantly influence DC remodeling following LT [13-16]. Therefore, identifying hepatic lipid mediators that regulate DC fate may provide important insights into immune homeostasis and the control of rejection after LT.
Arachidonic acid (ARA) is a major polyunsaturated fatty acid and an essential component of membrane phospholipids that plays important roles in lipid metabolism, energy homeostasis, and immune regulation [17]. Previous studies have shown that ARA can enhance fatty acid oxidation (FAO) and regulate systemic metabolic homeostasis, whereas tumor-derived ARA can remodel the immune microenvironment and suppress antitumor immune responses [18-20]. Moreover, ARA can be metabolized through the cyclooxygenase (COX) pathway to generate prostaglandins, including PGE2 and TXA2, thereby modulating inflammatory signaling and immune cell recruitment [21]. Notably, our metabolomic analysis revealed elevated ARA levels in the microenvironment of non-rejection grafts, suggesting that ARA may contribute to DC-mediated immune homeostasis after liver transplantation. However, how ARA regulates DC function in this context remains unclear.
Toll-like receptors (TLRs) are central regulators of innate immune activation in DCs. By sensing pathogen-associated molecular patterns (PAMPs), TLRs initiate signaling cascades that promote DC maturation and functional activation [10, 22]. In cDCs and moDCs, TLR signaling not only regulates DC function through the sensing of PAMPs but also suppresses FAO to support anabolic demands during immune activation [23]. Toll-like receptor-9 (TLR9) recognizes free DNA as a PAMP and activates pDCs. Its activation promotes glycolysis but has relatively modest effects on FAO and the oxygen consumption rate (OCR) [24, 25]. After LT, the extent to which the lipid-rich hepatic microenvironment shapes TLR9-FAO regulation in DCs and affects transplant outcomes remains unclear [26].
To address these gaps, in this study, we analyzed single-cell RNA sequencing data to characterize DC subsets and their metabolic phenotypes in human liver transplant recipients. We further analyzed liver homogenate and peripheral blood lipid components to explore their associations with rejection status. The functional role of the candidate metabolite ARA was examined using DC induction assays, and bulk RNA sequencing was used to identify downstream mediators. Finally, the therapeutic potential of inhibiting the identified ARA-TLR9 axis was evaluated in a murine liver transplantation model.
Materials and Methods
The study did not take sex as a biological variable into account. Thorough information regarding all antibodies and reagents utilized in this research, encompassing details about the manufacturers, catalogue numbers, and the working concentrations or dilution ratios, along with the sequences applied in this study, can be found in Table S1.
Human subjects
Samples of human liver tissue and peripheral blood were collected from 35 R and 44 NR recipients who had liver transplants at Beijing Friendship Hospital, Capital Medical University. Liver samples were collected for further histological and immunological examinations. All human research involving participants was carried out in compliance with the Declaration of Helsinki and received approval from the Institutional Ethics Committee of Beijing Friendship Hospital, Capital Medical University (Ethical No. BFHHZMP20240003). All clinical characteristics of the recipients were summarized in Table S2.
Animals
Experimental animals were obtained from Beijing Vital River. The animal experiments followed the standards set by the Animal Welfare and Ethics Committee of Shanxi Medical University (Ethical No. DWLL-2025-010).
Mouse liver transplantation and in vivo interventions
Liver transplantation was conducted utilizing the cuff technique as outlined earlier. Donor and recipient models of rejection (R) and non-rejection (NR) were created using male C57BL/6 and C3H mice aged 6 to 8 weeks. C57BL/6→C3H transplantation served as the allogeneic rejection model, whereas C3H→C3H transplantation served as the syngeneic non-rejection model.
In the AAV9 intervention experiment, allogeneic recipient mice were divided into five groups: AAV9-null, ARA + AAV9-null, AAV9-CD11c-Tlr9, ARA + AAV9-CD11c-Tlr9, and AAV9-CD11c-shTlr9. The mice received a single intravenous injection of the corresponding AAV9 vector at a dose of 2.0 × 10¹¹ vector genomes per mouse three weeks before transplantation. In the ARA-treated groups, ARA (50 mg/kg) was administered intraperitoneally 1 d before transplantation and every other d from postoperative d (POD) 2 through POD 12.
The separate hydroxychloroquine (HCQ) treatment groups included NR, R, and R + HCQ groups. The mice in the R + HCQ group received HCQ (50 mg/kg) intraperitoneally 1 d before LT and every other d from POD 2 through POD 12.
Isolation of hepatic non-parenchymal cells
After anesthetizing the mice with isoflurane, we performed a midline laparotomy through the rectus abdominis and perfused the portal vein with 5-10 mL of pre-chilled Phosphate Buffered Saline (PBS). The liver was collected, washed with PBS, minced, and transferred to gentleMACS C Tubes containing 10 mL of digestion buffer supplemented with 1 mg collagenase IV, 2 mg BSA, and 0.1 mg DNase I. Liver tissue was processed using the A01 program of a gentleMACS dissociator, gently shaken and incubated at 37 °C for 30 min, followed by the B01 program. The addition of MACS buffer stopped the digestion process. Following that, filter the gathered cell suspension using a 70 μm cell strainer, then centrifuge it at 500 × g for 5 min at 4 °C. After using 30% Percoll for gradient centrifugation of the cells, proceed with red blood cell lysis. Wash the cells with PBS, then resuspend to obtain non-parenchymal liver cells.
Isolation of hepatic CD11c⁺ cells
After obtaining the liver non-parenchymal cells using the method mentioned above, the cells were incubated with anti-CD11c magnetic beads, and CD11c+ cells were collected using a magnetic separation column according to the manufacturer's instructions. Cell purity was confirmed to be > 95% by flow cytometry.
Bone marrow dendritic cells (BMDCs) generation and treatments
Bone marrow cells were isolated from the femurs and tibias of mice, filtered through a 70-μm cell strainer, and subjected to red blood cell lysis for differentiation into DCs. Cells were cultured in complete medium supplemented with IL-4 (20 ng/mL) and GM-CSF (20 ng/mL) on day 0. On days 3 and 5, half of the medium was replaced, and the cytokines were renewed. On day 7, loosely adhered cells were gathered and assessed through flow cytometry to evaluate the percentage of DCs.
ARA was added at 100 μM throughout BMDC differentiation unless otherwise indicated. Etomoxir (ETO) was added 6 h before the assays to inhibit CPT1A-dependent FAO. For TLR9 activation, agatolimod sodium (ODN) was added on day 5. Celecoxib was coadministered with ARA to inhibit cyclooxygenase-2 activity.
For TLR9 knockdown, BMDCs were transfected with TLR9-targeting siRNA or control siRNA (GenePharma, China) using Lipofectamine 2000 and follow-up experiments were carried out 48 h after transfection. To achieve overexpression of TLR9 and CPT1A, BMDCs were transduced using lentiviral vectors that carried either TLR9 or CPT1A, or with a control lentivirus (GenePharma, China), following the guidelines provided by the manufacturer. Assessments were carried out 48 h post-transduction. The siRNA sequences used for TLR9 knockdown and the sequences used for TLR9 and CPT1A overexpression were provided in Table S1.
Culturing HEK293T cells and performing plasmid transfection
The HEK293T cell line derived from human embryonic kidney was cultured in Dulbecco's Modified Eagle Medium (DMEM) (Gibco) with added 10% fetal bovine serum (FBS) (Gibco) and 100 U/mL of penicillin-streptomycin. For plasmid transfection, it is done when 293T cells reach 70% confluence, using Lipofectamine 2000 (Invitrogen, USA) as the transfection reagent. For a 24-well plate, 200 ng of plasmid DNA was used per well.
Isolation of OT-1 CD8+ T cells
The lymph nodes from the armpits, under the jaw, and groin of OT-1 transgenic mice were extracted for the purpose of isolating CD8 T cells. Once the lymph nodes were collected, they were gently ground and passed through a 40-µm mesh to create a single-cell suspension. After obtaining the cells and lysing the red blood cells, CD8 magnetic beads were utilized for negative selection to isolate the CD8 cells. Cell purity was confirmed to be >95% by flow cytometry.
OVA antigen loading and DC-OT-1 CD8+ T-cell co-culture
BMDCs were generated as described above. On day 5 of culture, lipopolysaccharide (LPS) was added to induce maturation. On day 7, ovalbumin (OVA257-264) was introduced for the purpose of antigen loading. Following the antigen loading, the DCs were rinsed to eliminate any remaining unbound OVA257-264 and then placed into 96-well plates at a density of 1 × 10⁵ cells per well. Isolated OT-1 CD8+ T cells were subsequently introduced at a concentration of 2 × 10⁵ cells per well and co-cultured with DCs for 72 h In the ARA+ETO group, ETO was introduced on day 5 alongside ARA to suppress CPT1A-dependent FAO. For the ARA + ODN group, the TLR9 agonist ODN was added on day 5 of culture.
Untargeted metabolomics
For an untargeted metabolite analysis, we used ultra-high-performance liquid chromatography in conjunction with high-resolution mass spectrometry (UHPLC-HRMS). The samples were examined individually in both positive and negative electrospray ionization (ESI) modes. Metabolites were separated using a reverse-phase C18 column with a gradient elution program. Full-scan MS1 spectra were collected over an m/z range of 70 to 1000, and data-dependent MS/MS fragmentation was performed to help identify metabolites.
To maintain analytical consistency and reduce instrumental drift, pooled quality control (QC) samples were introduced at consistent intervals (every 10 injections), and the study samples were evaluated in a randomized sequence. Prior to being input into the statistical analysis procedure, the raw data were standardized following peak detection, retention time alignment, and feature quantification. Metabolites were annotated by matching m/z values and MS/MS spectra against public databases, including HMDB and METLIN.
RNA sequencing and gene signature analysis
Single-cell RNA sequencing (scRNA-seq) data from individuals who received liver transplants were retrieved from a published dataset available in the NGDC GSA-Human database (HRA002091 and HRA007802) [27]. Based on clinical annotations, the samples were divided into non-rejection and rejection categories. The analyses were conducted in R (version 4.3.2) utilizing Seurat (version 5.3.0). Cells underwent screening following the standard protocol. The important criteria included nFeature_RNA exceeding 200, nCount_RNA greater than 500, a percentage of mitochondrial genes below 10%, with 2000 highly variable genes selected, utilizing the first 20 principal components for subsequent analysis, and clustering analysis configured at a resolution of 0.5.
For bulk RNA sequencing, mRNA was isolated from BMDCs treated with vehicle or ARA (n = 3 per group) and sequenced on an Illumina platform. Clean reads were mapped to the mouse reference genome GRCm38 (mm10) utilizing STAR, and gene-level counts were produced using featureCounts.
Differential expression analysis was conducted using DESeq2 in R, applying the Benjamini-Hochberg method for adjusting P values. Genes with an adjusted P-value < 0.05 and | log2 fold change | > 1.5 were classified as differentially expressed. Transcription factor activity was inferred using the mouse DoRothEA regulons with confidence levels A, B, and C. DESeq2 Wald statistics from genes with valid and finite values were used as inputs for the univariate linear model implemented in the decoupleR package, with a minimum regulon size of five target genes. Kyoto Encyclopedia of Genes and Genomes (KEGG) enrichment analysis and gene set enrichment analysis (GSEA) were subsequently conducted, and the results were visualized using ggplot2 and pheatmap in R.
Prediction of STAT3 binding sites in the TLR9 promoter
Potential STAT3 binding sites within the TLR9 promoter region were predicted using the JASPAR database.
Flow cytometry
Single-cell suspensions (2 × 10⁶ cells per sample) were prepared for flow cytometric analysis. The cells were first incubated with TruStain FcX™ PLUS at room temperature for 15 min in the dark to block Fc receptors. The cells were subsequently subjected to surface staining with fluorophore-conjugated antibodies against CD45, CD11c, CD86, CD80, MHC-I, MHC-II, CD4, and CD8 at 4 ºC for 30 min in the dark. A fixable viability dye was incorporated during the surface staining process to eliminate dead cells from the analysis. Intracellular neutral lipid accumulation and mitochondrial membrane potential were assessed using BODIPY 493/503 and tetramethylrhodamine ethyl ester (TMRE), respectively, following incubation at 37 ℃ for 30 min. Similarly, ARA antibody staining was performed before fixation and permeabilization to minimize lipid loss.
For intracellular staining, cells were treated with the fixation/permeabilization buffer at 4 °C for 40 min, followed by washing and incubation in 1 x permeabilization buffer at 4 °C for 15 min. Intracellular staining was then conducted at 4 °C for 30 min in the dark with antibodies against TLR9, CPT1A, IFN-γ, and granzyme B.
Cells were washed and resuspended in 500 µL of PBS. Flow cytometric data were collected using a BD FACSAria III flow cytometer and analyzed with Kaluza software.
Immunofluorescence
Liver biopsy samples collected from recipients of liver transplants and mouse orthotopic liver graft tissues were fixed in 4% paraformaldehyde, embedded in paraffin, and sectioned at 4 μm.
Tissue sections were deparaffinized, rehydrated, subjected to antigen retrieval, and treated with 0.3% hydrogen peroxide to block endogenous peroxidase activity. Multiplex immunofluorescence staining was performed using the Opal™ multiplex immunofluorescence system (Akoya Biosciences, USA). Each staining cycle included incubation with primary antibodies against CD11c, CD86, TLR9, CPT1A, or ARA, followed by an HRP-conjugated secondary antibody and TSA-mediated fluorophore deposition. Antibody complexes were removed by antigen retrieval between staining cycles. Finally, sections were counterstained with DAPI, and fluorescence images were acquired using a Zeiss LSM 880 confocal microscope.
Individual cells were defined as regions of interest (ROIs) based on DAPI staining. Mean fluorescence intensity and integrated density were relatively quantified using SaiViewer (SAI Technology) software after background subtraction using adjacent cell-free regions.
Dual luciferase reporter assay
HEK293T cells underwent transfection using the specified plasmids based on the transfection protocol mentioned earlier. The four transfection groups were as follows: wild-type TLR9 promoter reporter plasmid + empty vector, wild-type TLR9 promoter reporter plasmid + STAT3 overexpression plasmid, mutant TLR9 promoter reporter plasmid + empty vector, and mutant TLR9 promoter reporter plasmid + STAT3 overexpression plasmid. A Renilla luciferase plasmid was co-transfected into all groups as an internal control. After transfection for 24 h, cells were lysed following the guidelines provided in the dual luciferase reporter assay kit. The activities of firefly and Renilla luciferase were measured in succession after the appropriate detection reagents were introduced. The relative activity of the TLR9 promoter was determined by calculating the ratio of firefly luciferase activity to that of Renilla luciferase.
Real-time quantitative PCR (RT-qPCR)
In line with the manufacturer's guidelines, total RNA was isolated from tissue samples or cultured cells utilizing TRIzol reagent (Invitrogen). Briefly, samples were homogenized on ice and lysed with TRIzol, followed by chloroform-induced phase separation and isopropanol precipitation. RNA pellets were washed with 75% ethanol, air-dried, and dissolved in RNase-free water. RNA concentration and purity were assessed using a spectrophotometer, and only samples with A260/A280 ratios of 1.8–2.0 were used for subsequent analyses. cDNA was produced through reverse transcription utilizing a kit following the instructions provided by the manufacturer. The resulting cDNA was diluted 2- to 10-fold and utilized for quantitative PCR. RT-qPCR was performed in a 20 μL reaction volume using SYBR Green Master Mix according to the manufacturer's instructions. The expression levels of genes associated with FAO (Cpt1a, Acadl, Acsl1, and Acat1) as well as those from the Toll-like receptor family (Tlr9, Tlr4, Tlr6, Tlr7, Tlr8, Tlr11, Tlr12, Tnf-α, and Il-6) were analyzed. Relative mRNA expression was determined utilizing the 2-ΔΔCt method, with normalization made against an internal reference gene.
Western blot
Cells were collected and lysed using radioimmunoprecipitation assay (RIPA) lysis buffer supplemented with protease and phosphatase inhibitors. The lysate was kept on ice and vortexed intermittently, followed by centrifugation at 16,000 rpm for 10 min at 4 °C. The supernatants were collected for protein quantification analysis.
The concentration of protein was determined using the BCA Protein Assay Kit (Solarbio). Protein samples were adjusted to a final concentration of 2 μg/μL using RIPA lysis buffer and 5× SDS loading buffer, followed by denaturation at 95 °C for 10 min. Proteins were then subjected to SDS-PAGE at 80 V for 30 min, followed by 120 V for 60 min, and subsequently transferred onto a PVDF membrane activated with methanol. The membrane was treated with TBST containing 5% nonfat milk and allowed to incubate overnight at 4 °C with primary antibodies specific to CPT1A, TLR4, TLR9, MYD88, p-STAT3, STAT3, and β-actin. Following incubation with HRP-conjugated secondary antibodies, protein bands were detected using enhanced chemiluminescence (ECL) and imaged with a ChemiDoc imaging system (Bio-Rad). The intensity of the bands was analyzed through densitometry and normalized against the intensity of the β-actin band.
Oxygen consumption rate assay
The cellular OCR was measured using a fluorescence-based OCR assay kit (Elabscience, Wuhan, China; Cat. No. E-BC-F068) according to the manufacturer's instructions. This assay is based on an oxygen-sensitive fluorescent probe that remains extracellular and exhibits increased fluorescence intensity as the oxygen concentration decreases, thereby allowing real-time monitoring of cellular oxygen consumption. Cells from the respective experimental groups were collected and resuspended in complete culture medium containing reagent 1 at 4 × 10⁴ cells per well, followed by incubation at 37 °C for 30 min. Subsequently, 80 μL of sealing solution (reagent 2) was added to each well to prevent oxygen exchange with the surrounding air. Fluorescence was measured kinetically from the bottom of the plate at 37 °C using a microplate reader, with excitation and emission wavelengths of 405 and 650 nm, respectively. Readings were taken every 3 min for 90 min. The steadily increasing portion of each fluorescence–time curve was selected to calculate ΔF/ΔT, expressed as fluorescence units/min. Each condition was analyzed in triplicate technical wells.
ELISA for ARA
ARA concentrations in mouse serum, mouse liver tissue, and human serum samples were measured using a commercial ELISA kit (Elabscience, Wuhan, China; Cat. No. E-EL-0051) following the manufacturer's instructions.
Statistics
Statistical testing was conducted with GraphPad Prism version 9.5. Date are reported as the mean ± SD unless otherwise indicated. Each data point in the figures represents an independent biological replicate (n as indicated). For comparisons between two groups, an unpaired two-tailed Student’s t-test (or Welch’s t-test for unequal variances) was used for normally distributed data, and Mann-Whitney U test for non-normally distributed data. For analyses that involve three or more groups, one-way ANOVA was utilized along with Tukey's multiple-comparisons test (parametric) or the Kruskal-Wallis test paired with Dunn's multiple-comparisons test (nonparametric), depending on the characteristics of the data. Correlation analyses were performed using Pearson's or Spearman's correlation coefficients. ROC curve analyses were executed, and the AUC along with 95% confidence intervals was computed. All statistical analyses were conducted as two-tailed tests, considering a P value lower than 0.05 to be statistically significant. Statistical significance levels were indicated as P < 0.05 (*), P < 0.01 (**), P < 0.001 (***), and P < 0.0001 (****).
Results
CD86⁻CPT1A⁺ DC subset correlates with graft non-rejection status
To elucidate the functional heterogeneity of DCs within the posttransplantation microenvironment, we performed an integrative analysis of single-cell RNA sequencing datasets from 13 human liver allografts. Unsupervised clustering based on canonical markers revealed five discrete DC subpopulations: C1QA+ DCs (cluster 0), CD68+ DCs (cluster 1), CPT1A+ DCs (cluster 2), pDCs (cluster 3), and moDCs (cluster 4) (Figure 1A-B). The list of differentially expressed genes is provided in Table S3. Given that the liver is a metabolic hub and that metabolic rewiring profoundly shapes DC functionality [28, 29], we profiled the metabolic landscapes of these five clusters. Notably, FAO was significantly enriched in cluster 2, whereas other major metabolic pathways remained comparable across clusters (Figure 1C, Figure S1A-B). Concurrently, cluster 2 displayed an immature, tolerogenic phenotype characterized by compromised antigen presentation and dampened immune responsiveness. This functional state was evidenced by the striking downregulation of maturation and costimulatory markers (e.g., CD86, CD83, HLA-A/B/C, HLA-DPA1, HLA-DQB1, and PSMB9) and the upregulation of CPT1A, RGCC, IDO1, and LGALS2, as well as the marked suppression of pathways regulating immune effector processes (Figure 1D-F, Figure S1C). The differential pathways identified through KEGG and Gene Ontology (GO) enrichment analyses are listed in Table S4. Crucially, this CD86⁻CPT1A+ DC subset was particularly overrepresented in NR liver tissues (Figure 1G-H, Figure S1D).
A CD86⁻CPT1A⁺ DC subset is enriched in non-rejective liver allografts. (A) UMAP plots of single-cell RNA-seq data from 13 human liver allografts (non-rejection NR, n = 6; rejection R, n = 7) showing five dendritic cell (DC) subpopulations. (B) Heatmap displaying the top 5 genes of each DC type. (C) AUCell analysis of fatty acid oxidation (FAO) activity across DC clusters. (D) Violin plots showing the expression of maturation, costimulatory, and antigen-presentation markers across DC clusters. (E-F) Kyoto Encyclopedia of Genes and Genomes enrichment analysis (KEGG) (E) and Gene Ontology (GO) (F) enrichment analysis of cluster 2-related differentially expressed genes. (G) Bar plot showing the proportion of cluster 2 DCs in each sample from the NR and R groups. (H) Boxplots showing CD86 and CPT1A expression in cluster 2 DCs from the NR and R groups. (I) BODIPY 493/503 staining showing lipid accumulation in peripheral DCs from the NR and R groups. (J) Immunofluorescence staining and quantification of CD11c, CPT1A, and CD86 in liver allografts from the NR and R groups (n = 20 per group). Scale bars, 50 μm.
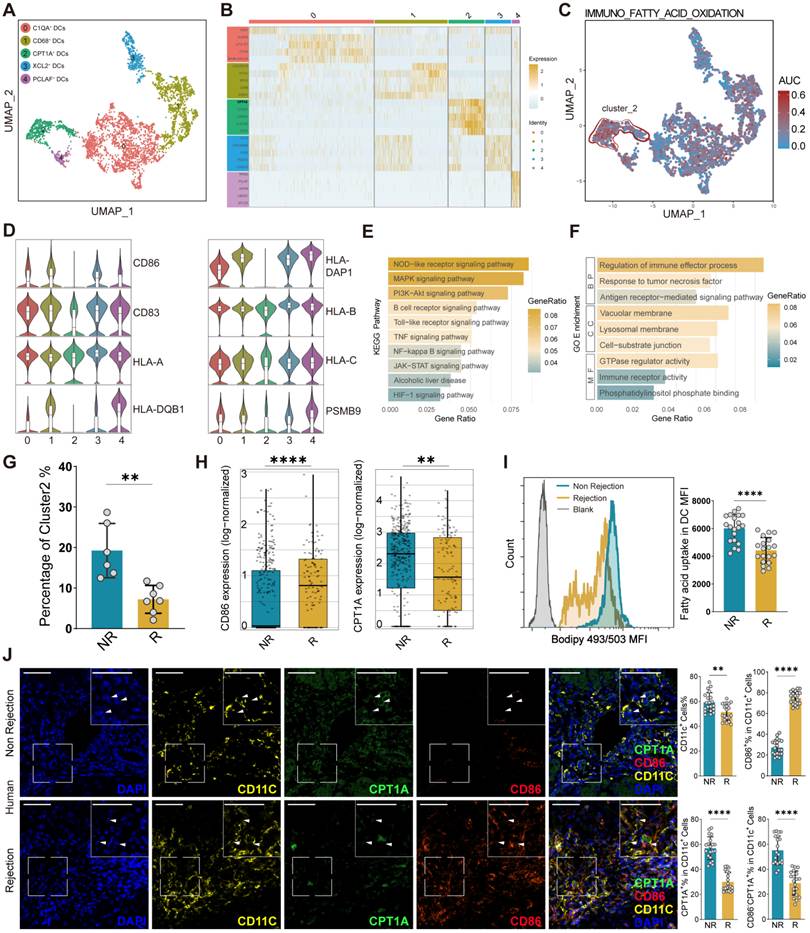
To further validate the presence of the CD86⁻CPT1A+ DC population, we evaluated both human clinical specimens and murine LT models (Figure S1E-F). In patients, BODIPY 493/503 staining revealed significantly increased lipid accumulation in peripheral DCs from NR patients (Figure 1I). Consistently, in situ immunofluorescence of human liver allografts (n = 20 per group) confirmed a marked enrichment of CD86⁻CPT1A+ DCs in the NR group (Figure 1J). Consistent with our findings in humans, DCs from murine NR grafts similarly exhibited diminished maturation, a compromised antigen-presenting capacity, and substantial lipid accumulation, characterized by a distinct enrichment of CD86⁻CPT1A+ DCs within the grafts (Figure S1G-I). Representative flow cytometry gating strategies and isotype controls are shown in Figure S2. Recent evidence has indicated that CD86⁻CPT1A+ DCs represent a tolerogenic cell population that plays a pivotal role in maintaining the non-rejection state.
Elevated ARA levels in the NR state are positively correlated with the proportion of CD86⁻CPT1A⁺ DCs
To explore the microenvironmental factors driving the expansion of CD86⁻CPT1A+ DCs, we performed untargeted metabolomic profiling on liver tissues from a murine LT model. Principal component and volcano plot analyses revealed distinct separation of hepatic metabolic trajectories among the normal, NR, and R groups (Figure 2A, Figure S3A). Concurrently, a core signature of nine metabolites was consistently upregulated in the NR groups compared with both the normal and R groups (Figure 2B), among which ARA emerged as the most abundant and dominant constituent (Figure 2C). This hepatic ARA enrichment was further validated across multiple compartments with complementary techniques. ELISA confirmed significantly elevated ARA concentrations in murine liver tissue and serum from the NR group, whereas flow cytometry and immunofluorescence consistently revealed increased ARA-associated staining signals within intrahepatic DCs of NR grafts (Figure S3B-D). Crucially, on the basis of these immunofluorescence profiles, Spearman correlation analyses demonstrated that the abundance of ARA+CD11c+ DCs was positively and significantly correlated with that of both the CD86⁻CD11c+ and CPT1A+CD11c+ DC subsets (Figure S3E), suggesting a potential regulatory link between local ARA accumulation and the phenotypic shift of DCs. Functionally, DCs isolated from non-rejected livers displayed increased FAO-associated oxygen consumption, which was accompanied by an increase in the mitochondrial membrane potential (MMP) (Figure S3F-G).
Arachidonic acid links the hepatic metabolic milieu to CD86⁻CPT1A⁺ DC enrichment and predicts graft rejection. (A) Principal component analysis (PCA) plot of the metabolomic profiles in liver tissues from normal, non-rejection (NR) and rejection (R) mice. (B) Venn diagram showing overlapping upregulated metabolites in the NR group compared with those in the normal and R groups. (C) Heatmap of nine upregulated metabolites in liver tissues from the murine NR and R groups. (D) Multiplex immunofluorescence staining of arachidonic acid (ARA), CD11c, CPT1A, and CD86 in human NR and R group liver allografts (NR, n = 20; R, n = 20). Scale bars, 50 μm. (E) Spearman correlation analysis of ARA+CD11c+ DCs with CD86-CD11c+ and CPT1A+CD11c+ DCs in the human groups (NR, n = 20; R, n = 20). (F) Serum ARA levels in the control, NR, and R groups (NR, n = 44; R, n = 35). (G) Analysis of the correlation between serum and liver ARA levels (NR, n = 10; R, n = 10). (H) Spearman correlation analysis of the rejection activity index (RAI) with serum ALT, AST, ARA, and T-Bil levels (NR, n = 44; R, n = 35). (I-J) Spearman correlation analyses of serum ARA levels with ALT and AST levels (NR, n = 44; R, n = 35). (K) ROC curve analysis of serum ARA for rejection prediction (NR, n = 44; R, n = 35). (L) Flow cytometry analysis of ARA in peripheral DCs from the NR and R groups (NR, n = 15; R, n = 15). (M) Analysis of the correlation between the number of ARA+ peripheral DCs and the RAI score (NR, n = 15; R, n = 15).
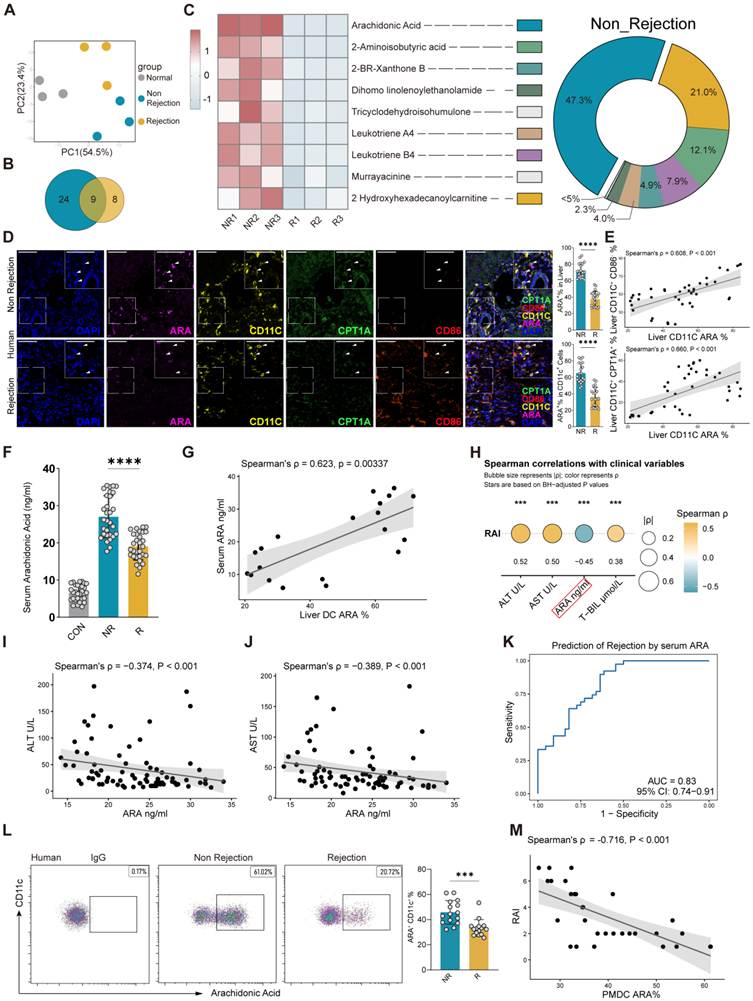
To validate these findings, we analyzed a relatively large cohort of human liver allografts (n = 20 per group). Multiplex immunofluorescence revealed relative enrichment of the hepatic ARA-associated signal in NR patients (Figure 2D), which was positively correlated with the abundance of CD86⁻CPT1A⁺ DCs (Figure 2E). Although ARA upregulation appeared to be partly stress-induced postsurgery, its elevation was markedly more pronounced in the NR group (n = 44) than in the R group (n = 35), closely linking it to the tolerogenic state (Figure 2F). To determine the cellular origin of this fatty acid milieu, scRNA-seq data from human LT tissues were analyzed, which revealed that ARA biosynthesis and extracellular secretion-related genes were predominantly enriched in hepatocytes and endothelial cells (Figure S3H). Crucially, serum ARA levels strongly mirrored intrahepatic ARA abundance in paired clinical samples (NR, n = 10; R, n = 10) (Figure 2G). Spearman analysis revealed that ALT, AST, and T-BIL were positively correlated with the RAI, whereas serum ARA was negatively correlated with the rejection activity index (RAI) (NR, n = 44; R, n = 35) (Figure 2H). Serum ARA levels were also negatively correlated with ALT and AST levels but not with T-BIL levels (NR, n = 44; R, n = 35) (Figures 2I-J; Figure S3I). Collectively, lower serum ARA levels were associated with greater rejection activity and hepatocellular injury. ROC analysis further demonstrated the significant discriminatory ability of serum ARA for liver allograft rejection (NR, n = 44; R, n = 35) (Figure 2K). Consistently, peripheral blood DCs from NR patients exhibited elevated intracellular ARA levels, which were inversely correlated with RAI scores (NR, n = 15; R, n = 15) (Figure 2L-M).
In brief, non-rejection grafts exhibited an ARA-enriched metabolic milieu that was positively correlated with the expansion of CD86⁻CPT1A⁺ DCs; notably, peripheral ARA levels closely reflected this intrahepatic metabolic state and showed predictive value for monitoring posttransplantation status.
ARA directly induces CD86⁻CPT1A⁺ DCs with impaired function
To investigate whether ARA orchestrates the development of the CD86⁻CPT1A⁺ DC population, we examined the metabolic and phenotypic landscapes of BMDCs. ARA treatment significantly upregulated the expression of multiple FAO-related genes and elevated CPT1A protein levels (Figure 3A-B, Figure S4A). Functional assays confirmed this metabolic shift, as evidenced by a marked increase in FAO-associated OCR and increased intracellular fatty acid accumulation and MMP in ARA-treated DCs (Figure 3C-E). Concomitant with this metabolic reprogramming, flow cytometry analysis revealed that ARA treatment shifted the DCs toward an immature and tolerogenic phenotype, characterized by downregulated expression of the maturation markers CD86, CD80, MHC-I, and MHC-II (Figure 3F). The gating strategy is shown in Figure S4B. ARA treatment also reduced the secretion of the proinflammatory cytokines TNF-α and IL-6 by DCs (Figure S4C). Notably, CD86⁻CPT1A⁺ DCs emerged as the predominant phenotypic population following ARA treatment (Figure S4D). Moreover, these phenotypic alterations were not artifacts of cytotoxicity or mediated by the COX2-PGE2 pathway, as ARA exposure affected neither DC apoptosis nor COX2 inhibition (Figure S4E-F). Importantly, CPT1A inhibition successfully rescued the expression of these maturation markers (Figure 3F), indicating that CPT1A is required for ARA-induced DC tolerogenesis.
ARA directly induces CD86⁻CPT1A⁺ DCs in vitro and suppresses their T-cell-stimulating capacity. (A) CPT1A mRNA expression in bone marrow-derived dendritic cells (BMDCs) treated with vehicle (Veh) or arachidonic acid (ARA). (B) Western blot analysis of CPT1A protein expression in BMDCs treated with Veh or ARA, with quantification normalized to that of β-actin. (C) Oxygen consumption of BMDCs treated with Veh, ARA, Veh + etomoxir (ETO), or ARA + ETO in the presence of FCCP. (D-E) BODIPY 493/503 staining of intracellular lipid accumulation (D) and assessment of mitochondrial membrane potential (MMP) (E) in BMDCs treated with Veh or ARA. (F) Flow cytometry analysis of CD80, CD86, MHC-I, and MHC-II expression in BMDCs in the groups treated with Veh, ARA, or ARA + ETO. The percentages indicate the proportions of positive cells among total live CD45+CD11c+ DCs. (G) Analysis of cell-cell communication between cluster 2 DCs and CD8+ T cells in the non-rejection (NR) and rejeciton (R) groups. (H-I) Flow cytometric analysis of CFSE-based proliferation (H) and Granzyme B and IFN-γ expression (I) in CD8+ T cells co-cultured with BMDCs treated with Veh, ARA, or ARA + ETO.
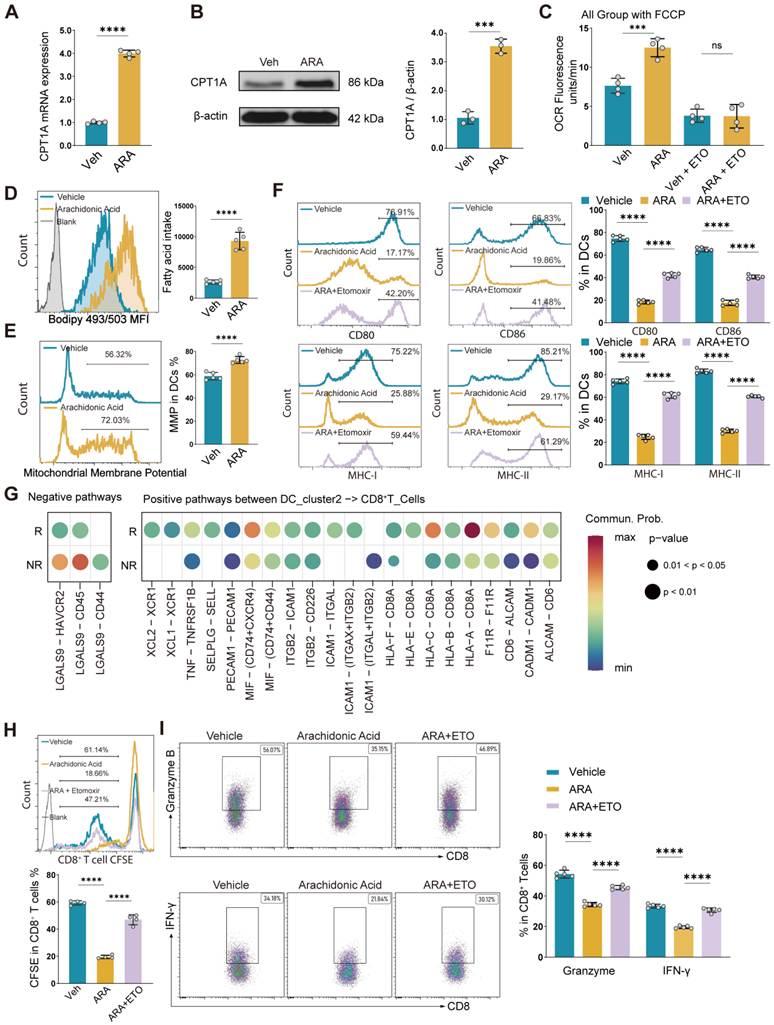
Given the tolerogenic phenotype of these CD86⁻CPT1A⁺ DCs, we next evaluated their ability to modulate T-cell responses. Cell-cell communication analysis predicted enhanced inhibitory signaling and diminished activating interactions between cluster 2 DCs and CD8+ T cells (Figure 3G). Consistently, co-culture assays demonstrated that ARA-treated DCs profoundly suppressed CD8+ T-cell proliferation and cytokine production, and these immunosuppressive effects were partially reversed by CPT1A inhibition (Figure 3H-I; gating strategy in Figure S4G).
Therefore, the data above demonstrated that ARA promoted the differentiation of CD86⁻CPT1A⁺ DCs, which displayed potent T-cell-suppressive activity.
Transcriptomic profiling revealed that ARA-induced TLR9 signaling was suppressed in DCs during LT
To elucidate the molecular mechanisms underlying ARA-induced tolerogenic CD86⁻CPT1A⁺ DC differentiation, we performed bulk RNA-seq on DCs treated with ARA in vitro. Bulk RNA-seq analysis revealed a clear separation between control and ARA-treated DCs according to PCA, which was underpinned by widespread transcriptional alterations featuring 307 upregulated and 911 downregulated genes (Figure 4A-B). Functional enrichment analysis revealed that these ARA-upregulated genes were predominantly enriched in metabolic pathways, whereas the downregulated genes were intrinsically tied to immune regulation (Figure S5A-E). This transcriptomic shift closely mirrors our prior scRNA-seq analysis of cluster 2 DCs. Specifically, KEGG pathway analysis revealed that the TLR signaling pathway was the most prominently suppressed cascade in ARA-treated DCs, along with other attenuated immune networks (Figure 4C). In alignment with these KEGG profiles, GSEA confirmed the significant suppression of the TLR-associated gene network (Figure 4D), which was further characterized by broad transcriptional downregulation of key TLR components and their downstream effectors according to heatmap analysis (Figure 4E). To validate our transcriptomic findings, we systematically evaluated the expression profiles of TLR family members in DCs. At the transcriptional level, the downregulation of TLR9 expression far exceeded that of any other TLR family member upon ARA treatment (Figure S5F). This marked reduction was further corroborated at the protein level, as evidenced by a synchronized decrease in the protein levels of TLR9 and its downstream adaptor MyD88, whereas the protein level of TLR4 remained entirely unaffected (Figure 4F-G, Figure S5G-H).
Transcriptomic profiling revealed TLR9 suppression in ARA-treated DCs. (A-G) Analyses of bone marrow-derived dendritic cells (BMDCs) treated with Vehicle (Veh) or arachidonic acid (ARA) (A) PCA of gene expression profiles. (B) Numbers and volcano plot of differentially expressed genes. (C) KEGG enrichment analysis of genes downregulated following ARA treatment. (D) GSEA of the Toll-like receptor signaling pathway. (E) Heatmap showing the expression of genes related to the Toll-like receptor signaling pathway. (F-G) Western blot (F) and flow cytometric (G) analyses of TLR9 protein expression. (H) Flow cytometry analysis of TLR9 expression in ARA+ and ARA- peripheral DCs from the human non-rejection group (non-rejection NR, n = 15). (I) Multiplex immunofluorescence staining of TLR9, CD11c, ARA, and CD86 in human NR and R groups of liver allografts, with correlation analysis based on immunofluorescence staining (NR, n = 10; R, n = 10). Scale bars, 50 μm. (J) Analysis of transcription factor activity in ARA-treated BMDCs. (K) Western blot analysis of STAT3 and p-STAT3 expression in BMDCs treated with ARA. (L) Dual-luciferase reporter assay of STAT3 binding to the wild-type or mutant TLR9 promoter. (M) Western blot analysis of TLR9 protein expression in ARA-treated DCs following STAT3 overexpression.
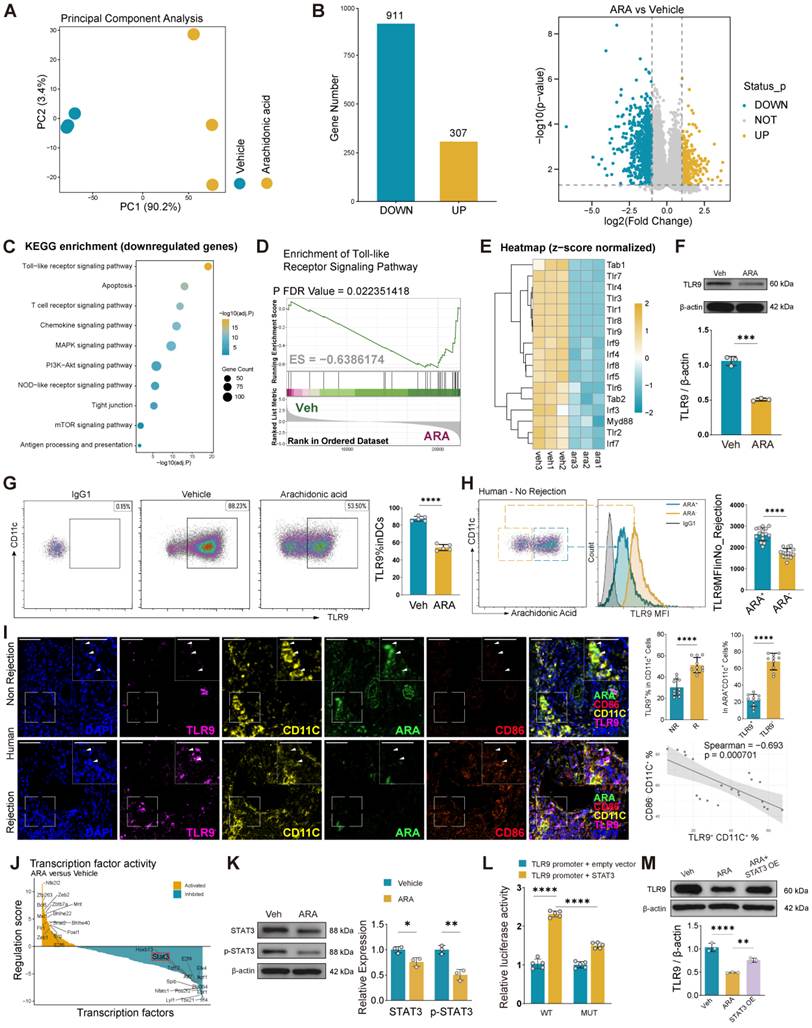
On the basis of this distinct specificity and the established link between TLR9 and lipid metabolism [30, 31], we focused our attention on this axis and sought to determine its significance in LT. In clinical LT recipients, flow cytometric analysis of peripheral blood showed that TLR9 expression was significantly lower in ARA-high DCs than in ARA-low DCs in the NR group (Figure 4H). Further analysis of liver allografts confirmed that TLR9 expression was significantly lower in ARA-enriched DCs from the NR group than in those from the R group (Figure 4I).These findings were perfectly mirrored in vivo using our murine liver transplantation model, in which ARA+ DCs harvested from NR allografts consistently displayed a marked reduction in TLR9 levels (Figures S5I-J). Importantly, scRNA-seq analysis revealed that the TLR signaling program in graft-infiltrating T cells remained entirely unaltered (Figure S5K), indicating that the ARA-TLR9 axis operates exclusively within the DC compartment to govern allograft tolerance.
Given the marked reduction in TLR9 mRNA expression after ARA treatment, we investigated its transcriptional regulation. Transcriptomic screening revealed that STAT3 expression was significantly downregulated after ARA treatment (Figure 4J). Given its reported involvement in TLR9-related signaling [32], STAT3 was selected for further investigation. Consistent with the transcriptomic data, western blotting confirmed that STAT3 and p-STAT3 levels were significantly reduced after ARA treatment (Figure 4K). JASPAR analysis further predicted a potential STAT3 binding site within the TLR9 promoter (Figure S5L). Dual-luciferase assays revealed that STAT3 enhanced TLR9 promoter activity, whereas mutation of the predicted binding site attenuated this effect (Figure 4L). Moreover, STAT3 overexpression restored TLR9 expression (Figure 4M), indicating that ARA reduces TLR9 expression, at least in part, by suppressing STAT3-mediated transcriptional regulation of TLR9.
TLR9 modulates FAO-dependent metabolism to shape DC function
We next examined whether TLR9 downregulation contributes to ARA-induced DC tolerization through FAO reprogramming. TLR9 silencing in BMDCs significantly enhanced FAO, as reflected by increased expression of FAO-related genes and CPT1A and elevated FAO-driven OCR, intracellular fatty acid accumulation, and MMP (Figure 5A-E, Figure S6A-B). Concomitantly, TLR9-deficient DCs acquired a tolerogenic phenotype characterized by reduced expression of CD80, CD86, MHC-I, and MHC-II (Figure 5F) and impaired proinflammatory cytokine production (Figure S6C). Importantly, inhibition of FAO largely reversed these phenotypic changes, restoring the expression of DC maturation markers (Figure 5F) and reducing the T-cell suppressive activity of TLR9-silenced DCs (Figure S6D). These findings indicate that increased FAO activity is a key downstream mechanism through which TLR9 deficiency promotes tolerogenic DC programming. Notably, the metabolic and functional characteristics of TLR9-silenced DCs phenocopied those of ARA-treated DCs.
TLR9 modulates FAO-dependent metabolism to shape dendritic cell function. (A-B) TLR9 (A) and CPT1A (B) mRNA and protein expression in bone marrow-derived dendritic cells (BMDCs) in the vehicle (Veh) and si-TLR9 groups. (C) Oxygen consumption rate (OCR) of BMDCs treated with Veh, si-TLR9, Veh + etomoxir (ETO), or si-TLR9 + ETO in the presence of FCCP. (D-E) BODIPY 493/503 staining of intracellular lipid accumulation (D) and assessment of mitochondrial membrane potential (MMP) (E) in Veh- and siTLR9-treated BMDCs. (F) Flow cytometry analysis of CD80, CD86, MHC-I, and MHC-II expression in BMDCs in the Veh, si-TLR9, or si-TLR9 + ETO groups. The percentages indicate the proportions of positive cells among total live CD45+CD11c+ DCs. (G) mRNA expression of CPT1A, Acadl, Acsl1, and Acat1 in BMDCs treated with Veh, arachidonic acid (ARA), or ARA + agatolimod sodium (ODN). (H) CPT1A protein expression in BMDCs treated with ARA or ARA + ODN. (I) OCR of BMDCs treated with Veh, ARA, ARA + ODN, vehicle + ETO, or ARA + ETO in the presence of FCCP. (J-L) Flow cytometric analysis of intracellular lipid accumulation using BODIPY 493/503 (J), mitochondrial membrane potential (MMP) (K), and CD80, CD86, MHC-I, and MHC-II expression (L) in BMDCs treated with Veh, ARA, or ARA + ODN. The percentages indicate the proportions of positive cells among total live CD45+CD11c+ DCs.
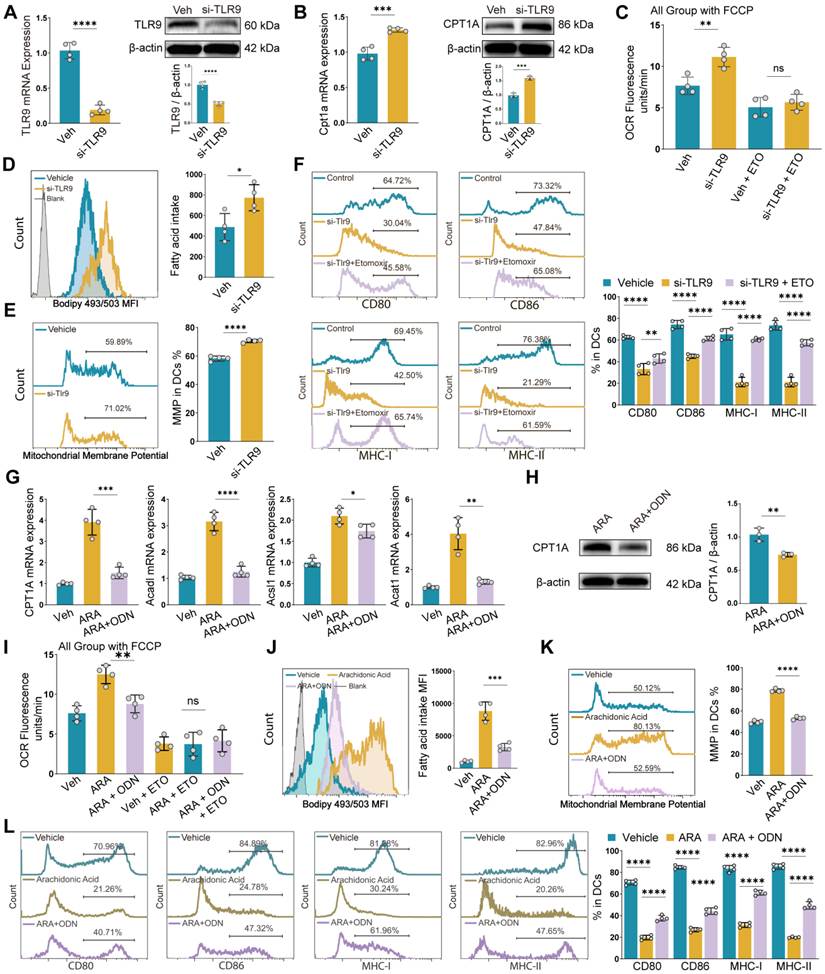
To determine whether the restoration of TLR9 signaling could reverse ARA-mediated DC tolerization, we treated ARA-conditioned DCs with a TLR9 agonist. Pharmacological activation of TLR9, despite not affecting TLR9 expression levels (Figure S6E), significantly attenuated FAO-associated metabolic reprogramming, as reflected by reduced expression of FAO-related genes and CPT1A, together with decreased FAO-driven OCR, intracellular fatty acid accumulation, and MMP (Figure 5G-K). Similarly, the tolerogenic phenotype induced by ARA was partially reversed, as evidenced by increased expression of these maturation markers (Figure 5L), restored proinflammatory cytokine production (Figure S6F), and recovered T-cell stimulatory capacity (Figure S6G). In contrast, treatment with other TLR agonists did not affect the tolerogenic phenotype induced by ARA (Figure S6H). Furthermore, TLR9 overexpression promoted DC maturation and significantly reversed the ARA-induced hyporesponsive DC phenotype (Figure S6I-J, M). When CPT1A expression was subsequently restored in TLR9-overexpressing DCs, the maturation phenotype induced by TLR9 overexpression was reversed, and the DCs again exhibited a hyporesponsive phenotype (Figure S6K-M), supporting CPT1A-mediated FAO as a downstream effector of TLR9 in the regulation of DC function.
Collectively, these findings indicate that the restoration of TLR9 signaling counteracts ARA-induced FAO remodeling and tolerogenic DC programming.
Targeting the ARA-TLR9 axis promotes FAO-associated CD86⁻CPT1A⁺ DCs and attenuates liver allograft rejection in vivo
To further validate the in vivo role of the ARA-TLR9 axis in liver allograft rejection, we used CD11c promoter-driven AAV9-Tlr9 to selectively knock down or overexpress TLR9 in DCs in a murine liver transplantation model (Figure 6A). Efficient AAV9-mediated TLR9 knockdown and overexpression in hepatic DCs were confirmed at both the mRNA and protein levels three weeks after AAV9 injection (Figure S7A-D). Compared with AAV9-null control treatment, both ARA treatment and DC-targeted TLR9 knockdown markedly attenuated liver allograft injury (Figure 6B, Figure S6E) and reduced the expression of the costimulatory molecules CD80 and CD86 and the antigen-presenting molecule MHC-II on hepatic DCs (Figure S7F-H), which is consistent with our in vitro findings. Given the critical role of DCs in regulating allogeneic T-cell responses, we further assessed T-cell infiltration within the grafts. Both ARA treatment and TLR9 knockdown significantly reduced the proportion of hepatic CD8⁺ T cells (Figure S7I).
The inhibition of TLR9 signaling alleviates liver allograft rejection. (A) Schematic representation of AAV9 administration and murine liver transplantation. (B) Banff rejection activity index scores in the indicated groups. (C) Schematic illustration of murine liver transplantation with hydroxychloroquine (HCQ) treatment to inhibit TLR9-associated signaling. (D) Banff rejection activity index scores in the murine non-rejection (NR), rejection (R), and R + TLR9 inhibitor groups. (E) Oxygen consumption rate (OCR) of liver dendritic cells (DCs) from the NR, R, R + TLR9 inhibitor, and ETO-treated groups in the presence of FCCP. (F-H) Flow cytometric analysis of intracellular lipid accumulation using BODIPY 493/503 (F), mitochondrial membrane potential (MMP) (G), and CD80, CD86, MHC-I, and MHC-II expression (H) in liver DCs from the NR, R, and R + TLR9 inhibitor groups. (I) Multiplex immunofluorescence staining of CD86, CPT1A, and CD11c in liver DCs from the NR, R, or R + TLR9 inhibitor groups, with quantification of CD86+CD11c+, CPT1A+CD11c+, and CD86-CPT1A+CD11c+ DCs. Scale bars, 50 μm.
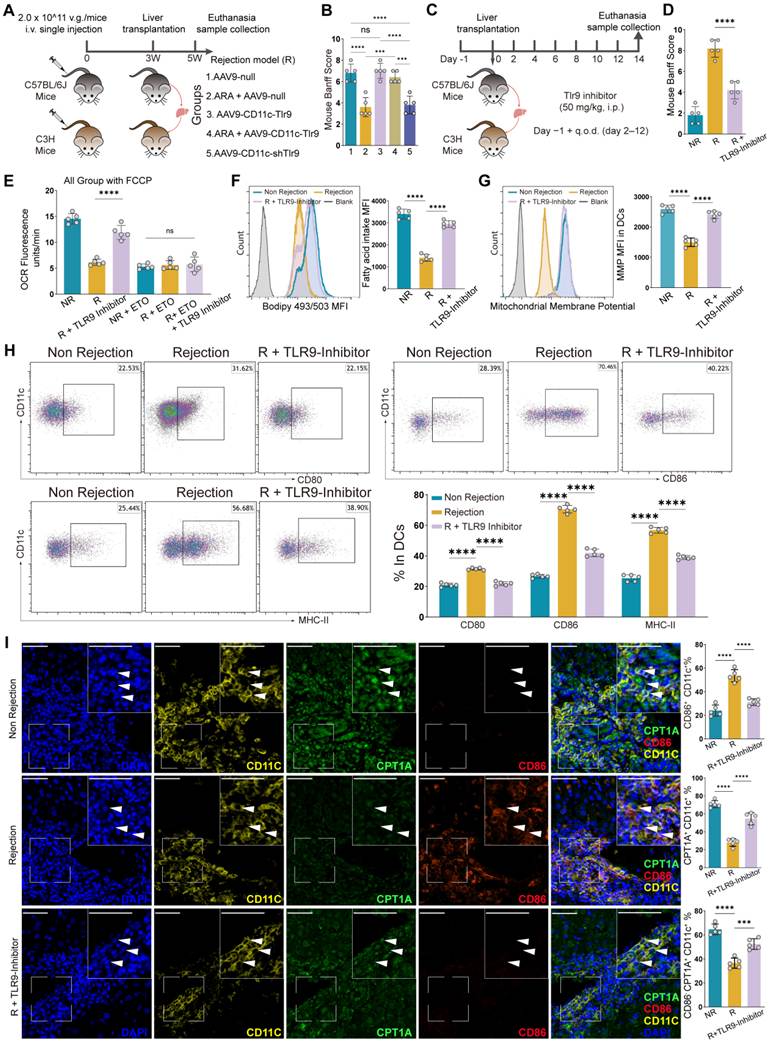
Furthermore, under ARA treatment, DC-targeted TLR9 overexpression significantly reversed the protective effect of ARA against liver allograft rejection (Figure 6B, Figure S6E-I). In contrast, compared with the AAV9-null control, TLR9 overexpression alone did not significantly alter the severity of rejection, possibly because TLR9 expression and activation were already elevated under rejection conditions. Collectively, these findings further support the role of TLR9 as an important downstream target of ARA-mediated immunoregulation and provide in vivo genetic evidence for the causal role of the ARA-TLR9 axis.
To further investigate whether pharmacological inhibition of TLR9 could alleviate allograft rejection in vivo, we administered HCQ in a murine liver transplantation model. On the basis of previous studies, we performed a pilot dose study and found no obvious changes in body weight or liver function, whereas CPT1A expression increased with increasing HCQ dose and markedly increased at 50 mg/kg (Figure S8A-F) [33, 34]. Therefore, 50 mg/kg HCQ was used for subsequent transplantation experiments. According to the treatment regimen shown, TLR9 inhibitor treatment markedly attenuated histopathological injury associated with liver allograft rejection (Figure 6D, Figure S8G). Consistent with our in vitro findings, TLR9 inhibition promoted FAO-associated metabolic reprogramming in graft-infiltrating DCs. DCs isolated from TLR9 inhibitor-treated allografts exhibited increased FAO-driven OCR (Figure 6E), accompanied by increased intracellular fatty acid accumulation and increased MMP (Figure 6F-G), indicating increased FAO activity. In parallel, these DCs displayed a more tolerogenic phenotype (Figure 6H). Multiplex immunofluorescence analysis further demonstrated an increased abundance of CD86⁻CPT1A⁺ DCs within liver allografts following pharmacological TLR9 inhibition (Figure 6I), supporting the induction of FAO-associated tolerogenic DCs in vivo. Consistently, CD8+ T-cell infiltration was markedly reduced in liver allografts from TLR9 inhibitor-treated recipients (Figure S8H-K). In the rejection model, pharmacological inhibition of TLR9 promoted the expansion of CD86-CPT1A+ DCs and mitigated graft rejection.
Discussion and Conclusions
Allograft rejection is a major immune-mediated complication that compromises graft function and prognosis after liver transplantation. In this study, we revealed a previously underappreciated role of the hepatic lipid microenvironment as a driver of the NR state after LT. We found that the fatty acid ARA suppressed hepatic DC function through the TLR9-FAO signaling axis, a phenomenon that was not observed in DCs from the R group. Further analyses revealed that in NR grafts, ARA transcriptionally downregulated TLR9 expression, thereby enhancing FAO, impairing DC maturation and antigen-presenting capacity, limiting CD8+ T-cell activation, and ultimately alleviating allograft rejection. Notably, in a murine LT rejection model, genetic and pharmacological targeting of TLR9 further supported the ARA-TLR9 axis, as DC-targeted TLR9 knockdown or pharmacological inhibition attenuated allograft rejection, whereas TLR9 overexpression reversed the protective effect of ARA. These findings further suggest that the ARA-TLR9-DC axis may represent a potential therapeutic target for liver allograft rejection.
Under non-rejection conditions following LT, DCs are generally characterized by impaired antigen-presenting capacity and the ability to suppress CD8+ T-cell activation and differentiation [35, 36]. Consistent with these findings, we identified a CD86⁻CPT1A⁺ DC subset enriched in NR grafts and confirmed its capacity to suppress CD8⁺ T cells. These findings deepen the current understanding of posttransplant DC heterogeneity and functional specialization while providing further insight into how a specific DC subset contributes to the maintenance of the NR state. However, the mechanistic and functional evidence was derived primarily from BMDC-based models and may not fully reflect the biological characteristics of this subset within liver allografts. Future studies incorporating more specific approaches, such as in vivo lineage tracing, are warranted to further define its role in immune regulation after LT.
The formation of functionally impaired DCs is regulated by multiple signaling pathways, including immunoregulatory cytokine signaling, glucocorticoid and vitamin D-related pathways, and intracellular networks such as mTOR and Wnt/β-catenin signaling [15, 37-40]. Among the metabolic programs involved, FAO provides essential substrate and energy sources for mitochondrial oxidative phosphorylation and thus represents an important mode of energy supply and metabolic regulation during DC differentiation [41-43]. In this study, we revealed that CD86-CPT1A+ DCs enriched in the NR state exhibited enhanced FAO activity, which is consistent with the metabolic features of functionally impaired DCs previously reported in tumor and infection settings [44, 45]. As a key rate-limiting enzyme in FAO, CPT1A serves as an important indicator of increased FAO activity, and its inhibition has been shown to impair the generation of this DC subset [46, 47]. Consistent with these findings, DCs derived from NR grafts also exhibited increased CPT1A expression. Together, these findings support a role for CPT1A-dependent FAO in shaping the immune phenotype of DCs and extend the current understanding of how metabolic remodeling contributes to the functional heterogeneity of DCs after liver transplantation.
Given the apparent importance of FAO in this process, an important remaining question is which upstream lipid signals drive this metabolic program. Emerging evidence suggests that lipid-related metabolites can directly regulate DC function. For example, polyunsaturated fatty acids (PUFAs), particularly ω-6 PUFAs carried by tumor-derived AFP, have been shown to reprogram DC metabolism and impair DC differentiation and stimulatory capacity [48]. In addition, short-chain fatty acids have been reported to modulate DC maturation and promote their immunoregulatory properties [49, 50]. These observations support the concept that specific lipid species can shape DC functional phenotypes through metabolic regulation. In line with this, we found that ARA was significantly enriched in NR grafts and was closely associated with the expansion of CD86-CPT1A+ DCs. These findings suggest that ARA-associated FAO remodeling may contribute to posttransplant DC heterogeneity, promote the expansion of CD86-CPT1A+ DCs, and help sustain the NR state. As a key lipid metabolic product and bioactive signaling molecule involved in immune regulation, ARA may therefore represent a previously unrecognized upstream driver of this functionally impaired DC subset.
Existing studies suggest that ARA is associated with the expression of FAO-related genes in tissues; however, this evidence remains largely limited to superficial correlations and lacks mechanistic support [18]. Several studies have preliminarily supported the immunosuppressive effects of ARA. For example, tumor-derived ARA promotes neutrophil-mediated immunosuppression and therapy resistance in triple-negative breast cancer [20], whereas enrichment of ARA in ovarian cancer activates the ASK1-p38 δ/α signaling pathway, suppresses macrophage phagocytic capacity, and is associated with adverse clinical outcomes [51]. Building on these observations, we further analyzed a retrospective clinical cohort to evaluate the relationship between ARA and NR. The results revealed that intrahepatic ARA enrichment and ARA content in DCs were significantly associated with graft acceptance, and a similar relationship was also observed in peripheral blood. Serum ARA levels were also significantly negatively correlated with ALT and AST levels. Notably, increased ARA content in DCs was accompanied by increased FAO activity, suggesting that ARA-induced FAO enhancement may be a key driver of the formation and expansion of CD86⁻CPT1A+ DCs. This finding partially fills a mechanistic gap in understanding how lipid metabolic signals shape specific TolDC subsets. In addition, posttransplant monitoring of ARA may help reflect graft status, and serum ARA levels may serve as a candidate noninvasive biomarker for predicting transplant rejection, highlighting its potential for clinical translation. Collectively, these findings provide a new explanation for how the hepatic lipid microenvironment regulates DC function and promotes the maintenance of the NR state after LT. Further validation in larger, multicenter, prospective, and independent cohorts is therefore needed to establish its diagnostic performance and clinical utility.
The close association between ARA enrichment and the expansion of CD86-CPT1A+ DCs prompted us to further investigate the molecular pathways underlying this effect. Transcriptomic analysis indicated that ARA markedly suppressed TLR signaling, leading us to focus on TLR9, a key innate immune receptor involved in DC activation and maturation. Previous studies have suggested that TLR9 deficiency or inhibition favors the generation of functionally impaired DCs [52]. Although the effects of TLR9 on FAO differ across DC subsets, evidence from BMDCs and conventional DCs indicates that TLR9 activation suppresses FAO and mitochondrial metabolism [44, 53, 54]. Given that the DC populations examined in LT more closely resemble the cDC/BMDC lineage, these findings provide a plausible basis for our observation that ARA-associated TLR9 downregulation coincides with enhanced FAO in CD86-CPT1A+ DCs. Consistent with these findings, TLR9 deficiency increased FAO activity and promoted the generation of CD86-CPT1A+ DCs, whereas TLR9 activation attenuated ARA-induced FAO enhancement and reduced this DC subset. Importantly, in vivo targeting of TLR9 further supported the functional relevance of this pathway, as DC-targeted TLR9 knockdown attenuated liver allograft rejection, whereas TLR9 overexpression markedly reversed the protective effect of ARA. Mechanistically, our findings further indicate that ARA reduces TLR9 expression, at least in part, by suppressing STAT3-mediated transcriptional regulation of TLR9. These observations further support the idea that TLR9 represents an important intermediary linking ARA signaling to the altered phenotype of CD86⁻CPT1A⁺ DCs. Nevertheless, the molecular mechanisms through which TLR9 signaling suppresses CPT1A expression and FAO remain incompletely understood and warrant further investigation.
Hydroxychloroquine (HCQ) is a clinically approved immunomodulatory drug widely used to treat autoimmune diseases and known to inhibit endosomal TLR signaling, including TLR9 [55]. Experimental studies have further demonstrated that HCQ attenuates hepatic ischemia/reperfusion injury, partly through inhibition of TLR9 signaling [56]. Consistent with these findings, our study showed that HCQ promoted the generation of CD86-CPT1A+ tolerogenic DCs and alleviated allograft rejection in a murine liver transplant model. However, given the nonselective effects of HCQ, further studies using DC-specific TLR9 conditional knockout mice are warranted to clarify the contribution of TLR9 signaling.
In summary, this study defines an ARA-TLR9-FAO immunometabolic axis that governs dendritic cell differentiation and tolerance maintenance after liver transplantation. We further identified ARA as a candidate circulating biomarker reflecting graft status, whereas TLR9 may represent a potential therapeutic target for intervention. Beyond the specific pathway, these findings establish a paradigm in which host metabolic cues, rather than alloimmune signals alone, actively shape transplant outcomes, offering a framework for biomarker development and metabolism-based immunotherapy in transplantation.
Abbreviations
LT: liver transplantation; DC: dendritic cell; tolDC: tolerogenic dendritic cell; ARA: arachidonic acid; FAO: fatty acid oxidation; BMDC: bone marrow-derived dendritic cell; CPT1A: carnitine palmitoyltransferase 1A; TLR: Toll-like receptor; OCR: oxygen consumption rate.
Supplementary Material
The Supplementary Material file contains the supplementary figures and the inclusion and exclusion criteria for clinical participants.

Table S1 provides information on the antibodies, reagents, primers, and other nucleotide sequences used in this study.
Table S2 presents the baseline clinical characteristics of the enrolled participants.
Table S3 contains the marker genes of the dendritic cell clusters identified by single-cell RNA sequencing.
Table S4 presents the functional enrichment analysis of genes associated with dendritic cell cluster 2.
Acknowledgements
The authors sincerely thank all the study participants for providing blood and liver samples. We also appreciate the technical support and helpful advice from laboratory staff and colleagues who contributed to the experiments and data collection. This work was supported by the Shanxi Province Higher Education "Billion Project" Science and Technology Guidance Project.
Funding
This work was supported by the National Natural Science Foundation of China (Grant Nos. 82470693 32200717 and 32470966), the Shanxi Provincial Key Laboratory Project (202204010931008), the Shanxi Provincial Key Research and Development Program (202302130501013) and the Science and Technology Cooperation and Exchange Special Project of Shanxi Province (202504041101036).
Authorship contribution statement
Yizhang Chen and Hongrui Yue contributed equally to this work. Yizhang Chen, Wei Wang, Jun Xu, and Yan Wang conceived and designed the study. Yizhang Chen, Hongrui Yue, Zanmei Bai, Dongdong Wu, and Yifan Ren performed the experiments. Yizhang Chen, Xinqiang Li, Shanyi Zhou, and Xuejun Zhao collected and analyzed the data. Hezhao Zhang, Rui Zhang, Zhijun Zhu, Jun Xu, and Yan Wang provided essential reagents and materials. Yizhang Chen, Wei Wang, and Yan Wang drafted the manuscript. All the authors contributed to the interpretation of the findings, critically reviewed and revised the manuscript, approved the final version, and agreed to be accountable for all aspects of the work.
Data availability
The data and analytical code that support the findings of this study are available from the corresponding author upon reasonable request.
Competing Interests
The authors have declared that no competing interest exists.
References
1. Montano-Loza AJ, Rodríguez-Perálvarez ML, Pageaux GP, Sanchez-Fueyo A, Feng S. Liver transplantation immunology: immunosuppression, rejection, and immunomodulation. J Hepatol. 2023;78:1199-215
2. Pan Q, Zhou A, Wang B, Xiao W, Gao Y, Liu H. et al. Diagnostic and predictive biomarkers of acute rejection after liver transplantation. Int J Surg. 2025;111:3908-19
3. Loupy A, Sablik M, Khush K, Reese PP. Advancing patient monitoring, diagnostics, and treatment strategies for transplant precision medicine. Lancet. 2025;406:389-402
4. Zhao S, Hu Y, Yang B, Zhang L, Xu M, Jiang K. et al. The transplant rejection response involves neutrophil and macrophage adhesion-mediated trogocytosis and is regulated by NFATc3. Cell Death Dis. 2024;15:75
5. Zhang X, McGinnis CS, Yu G, Chen S, Zheng P, Schürch CM. et al. Erythropoietin receptor on cDC1s dictates immune tolerance. Nature. 2026;650:470-80
6. Collin M, Bigley V. Human dendritic cell subsets: an update. Immunology. 2018;154:3-20
7. Du X, Li M, Huan C, Lv G. Dendritic cells in liver transplantation immune response. Front Cell Dev Biol. 2023;11:1277743
8. Jin F, Xie L, Zhang H, Fan X, Tian J, Liu W. et al. Dendritic cells: origin, classification, development, biological functions, and therapeutic potential. MedComm (2020). 2025;6:e70455
9. Ramalho T, Assis PA, Ojelabi O, Tan L, Carvalho B, Gardinassi L. et al. Itaconate impairs immune control of Plasmodium by enhancing mtDNA-mediated PD-L1 expression in monocyte-derived dendritic cells. Cell Metab. 2024;36:484-97.e6
10. Adams NM, Das A, Yun TJ, Reizis B. Ontogeny and function of plasmacytoid dendritic cells. Annu Rev Immunol. 2024;42:347-73
11. Castenmiller C, Keumatio-Doungtsop BC, van Ree R, de Jong EC, van Kooyk Y. Tolerogenic immunotherapy: targeting DC surface receptors to induce antigen-specific tolerance. Front Immunol. 2021;12:643240
12. Ochando J, Ordikhani F, Jordan S, Boros P, Thomson AW. Tolerogenic dendritic cells in organ transplantation. Transpl Int. 2020;33:113-27
13. You Z, Chi H. Lipid metabolism in dendritic cell biology. Immunol Rev. 2023;317:137-51
14. Artru F, Atkinson S, Trovato F, Tyson LD, Patel VC, Vergis N. et al. Lipidomics-based plasma signature of alcohol-related hepatitis linked to short-term mortality. JHEP Rep. 2025;7:101367
15. Sen K, Pati R, Jha A, Mishra GP, Prusty S, Chaudhary S. et al. NCoR1 controls immune tolerance in conventional dendritic cells by fine-tuning glycolysis and fatty acid oxidation. Redox Biol. 2023;59:102575
16. Yin X, Zeng W, Wu B, Wang L, Wang Z, Tian H. et al. PPARα inhibition overcomes tumor-derived exosomal lipid-induced dendritic cell dysfunction. Cell Rep. 2020;33:108278
17. Alharthi J, Bayoumi A, Thabet K, Pan Z, Gloss BS, Latchoumanin O. et al. A metabolic associated fatty liver disease risk variant in MBOAT7 regulates toll like receptor induced outcomes. Nat Commun. 2022;13:7430
18. Araújo BC, Skrzynska AK, Marques VH, Tinajero A, Del Rio-Zaragoza OB, Viana MT. et al. Dietary arachidonic acid (20:4n-6) levels and its effect on growth performance, fatty acid profile, gene expression for lipid metabolism, and health status of juvenile california yellowtail (seriola dorsalis). Fishes. 2022;7:185
19. Bayerl F, Meiser P, Donakonda S, Hirschberger A, Lacher SB, Pedde AM. et al. Tumor-derived prostaglandin E2 programs cDC1 dysfunction to impair intratumoral orchestration of anti-cancer T cell responses. Immunity. 2023;56:1341-58.e11
20. Yu L, Liebenberg K, Shen Y, Liu F, Xu Z, Hao X. et al. Tumor-derived arachidonic acid reprograms neutrophils to promote immune suppression and therapy resistance in triple-negative breast cancer. Immunity. 2025;58:909-25.e7
21. Du R, Pan T, Wang Y, Fan Y, Liu Q, Tao X. et al. Thromboxane receptor activation in dendritic cells mitigates sepsis by suppressing S100a8/a9-mediated neutrophil recruitment. Signal Transduct Target Ther. 2026;11:75
22. Gerber-Tichet E, Blanchet FP, Majzoub K, Kremer EJ. Toll-like receptor 4 - a multifunctional virus recognition receptor. Trends Microbiol. 2025;33:34-47
23. Krawczyk CM, Holowka T, Sun J, Blagih J, Amiel E, DeBerardinis RJ. et al. Toll-like receptor-induced changes in glycolytic metabolism regulate dendritic cell activation. Blood. 2010;115:4742-9
24. Yun TJ, Igarashi S, Zhao H, Perez OA, Pereira MR, Zorn E. et al. Human plasmacytoid dendritic cells mount a distinct antiviral response to virus-infected cells. Sci Immunol. 2021;6:eabc7302
25. Wu D, Sanin DE, Everts B, Chen Q, Qiu J, Buck MD. et al. Type 1 interferons induce changes in core metabolism that are critical for immune function. Immunity. 2016;44:1325-36
26. Thomson AW, Vionnet J, Sanchez-Fueyo A. Understanding, predicting and achieving liver transplant tolerance: from bench to bedside. Nat Rev Gastroenterol Hepatol. 2020;17:719-39
27. Li X, Li S, Wang Y, Zhou X, Wang F, Muhammad I. et al. Single cell RNA-sequencing delineates CD8(+) tissue resident memory T cells maintaining rejection in liver transplantation. Theranostics. 2024;14:4844-60
28. Steinberg GR, Valvano CM, De Nardo W, Watt MJ. Integrative metabolism in MASLD and MASH: Pathophysiology and emerging mechanisms. J Hepatol. 2025;83:584-95
29. Heeren J, Scheja L. Metabolic-associated fatty liver disease and lipoprotein metabolism. Mol Metab. 2021;50:101238
30. Nielsen M, Nishizaki D, Kato S, Kurzrock R. TLR9: a double-dealing toll-like receptor. Immunotargets Ther. 2025;14:1531-54
31. Giordano L, Ware SA, Lagranha CJ, Kaufman BA. Mitochondrial DNA signals driving immune responses: why, how, where? Cell Commun Signal. 2025;23:192
32. Alcantara MB, Tang WS, Wang D, Kaniowski D, Kang E, Dizman N. et al. Targeting STAT3 in tumor-associated antigen-presenting cells as a strategy for kidney and bladder cancer immunotherapy. Front Immunol. 2023;14:1274781
33. Gómez-Guzmán M, Jiménez R, Romero M, Sánchez M, Zarzuelo MJ, Gómez-Morales M. et al. Chronic hydroxychloroquine improves endothelial dysfunction and protects kidney in a mouse model of systemic lupus erythematosus. Hypertension. 2014;64:330-7
34. Ruiz A, Rockfield S, Taran N, Haller E, Engelman RW, Flores I. et al. Effect of hydroxychloroquine and characterization of autophagy in a mouse model of endometriosis. Cell Death Dis. 2016;7:e2059
35. Levitsky J, Burrell BE, Kanaparthi S, Turka LA, Kurian S, Sanchez-Fueyo A. et al. Immunosuppression withdrawal in liver transplant recipients on sirolimus. Hepatology. 2020;72:569-83
36. Peng Y, Ye Y, Jia J, He Y, Yang Z, Zhu X. et al. Galectin-1-induced tolerogenic dendritic cells combined with apoptotic lymphocytes prolong liver allograft survival. Int Immunopharmacol. 2018;65:470-82
37. Deak P, Knight HR, Esser-Kahn A. Robust tolerogenic dendritic cells via push/pull pairing of toll-like-receptor agonists and immunomodulators reduces EAE. Biomaterials. 2022;286:121571
38. Morali K, Steuten J, Russo F, Romana Santoni de Sio F, Menage C, Consoli V. et al. Antigen-specific B cell response regulation by IL-10-producing tolerogenic dendritic cells. Sci Adv. 2025;11:eadu3624
39. Wang LT, Lin MH, Liu KY, Chiou SS, Wang SN, Chai CY. et al. WLS/wntless is essential in controlling dendritic cell homeostasis via a WNT signaling-independent mechanism. Autophagy. 2021;17:4202-17
40. Tran LM, Macedo C, Zahorchak AF, Gu X, Elinoff B, Singhi AD. et al. Donor-derived regulatory dendritic cell infusion modulates effector CD8(+) T cell and NK cell responses after liver transplantation. Sci Transl Med. 2023;15:eadf4287
41. Qu Q, Zeng F, Liu X, Wang QJ, Deng F. Fatty acid oxidation and carnitine palmitoyltransferase I: emerging therapeutic targets in cancer. Cell Death Dis. 2016;7:e2226
42. Yang L, Chu Z, Liu M, Zou Q, Li J, Liu Q. et al. Amino acid metabolism in immune cells: essential regulators of the effector functions, and promising opportunities to enhance cancer immunotherapy. J Hematol Oncol. 2023;16:59
43. Huang C, Lyu C, Mok HL, Xu Y, Cheng KW, Zhang C. et al. Tolerogenic dendritic cell-mediated regulatory T cell differentiation by Chinese herbal formulation attenuates colitis progression. J Adv Res. 2025;70:499-513
44. Adamik J, Munson PV, Hartmann FJ, Combes AJ, Pierre P, Krummel MF. et al. Distinct metabolic states guide maturation of inflammatory and tolerogenic dendritic cells. Nat Commun. 2022;13:5184
45. Ritprajak P, Kaewraemruaen C, Hirankarn N. Current paradigms of tolerogenic dendritic cells and clinical implications for systemic lupus erythematosus. Cells. 2019;8:1291
46. Ma L, Chen C, Zhao C, Li T, Ma L, Jiang J. et al. Targeting carnitine palmitoyl transferase 1A (CPT1A) induces ferroptosis and synergizes with immunotherapy in lung cancer. Signal Transduct Target Ther. 2024;9:64
47. Hossain F, Al-Khami AA, Wyczechowska D, Hernandez C, Zheng L, Reiss K. et al. Inhibition of fatty acid oxidation modulates immunosuppressive functions of myeloid-derived suppressor cells and enhances cancer therapies. Cancer Immunol Res. 2015;3:1236-47
48. Munson PV, Adamik J, Hartmann FJ, Favaro PMB, Ho D, Bendall SC. et al. Polyunsaturated fatty acid-bound α-fetoprotein promotes immune suppression by altering human dendritic cell metabolism. Cancer Res. 2023;83:1543-57
49. Kaisar MMM, Pelgrom LR, van der Ham AJ, Yazdanbakhsh M, Everts B. Butyrate conditions human dendritic cells to prime type 1 regulatory t cells via both histone deacetylase inhibition and g protein-coupled receptor 109A signaling. Front Immunol. 2017;8:1429
50. Nastasi C, Candela M, Bonefeld CM, Geisler C, Hansen M, Krejsgaard T. et al. The effect of short-chain fatty acids on human monocyte-derived dendritic cells. Sci Rep. 2015;5:16148
51. Dietze R, Hammoud MK, Gómez-Serrano M, Unger A, Bieringer T, Finkernagel F. et al. Phosphoproteomics identify arachidonic-acid-regulated signal transduction pathways modulating macrophage functions with implications for ovarian cancer. Theranostics. 2021;11:1377-95
52. Lv Z, Guo X, Zhang R, Yao Y, Shao L, Li S. et al. Dynamic DNA-Based nanoadjuvants for TLR9 clustering and innate immune activation in dendritic cells. J Am Chem Soc. 2025;147:13545-55
53. Fekete T, Sütö MI, Bencze D, Mázló A, Szabo A, Biro T. et al. Human plasmacytoid and monocyte-derived dendritic cells display distinct metabolic profile upon RIG-I activation. Front Immunol. 2018;9:3070
54. Humbert M, Guery L, Brighouse D, Lemeille S, Hugues S. Intratumoral CpG-B promotes antitumoral neutrophil, cDC, and t-cell cooperation without reprograming tolerogenic pDC. Cancer Res. 2018;78:3280-92
55. Lamphier M, Zheng W, Latz E, Spyvee M, Hansen H, Rose J. et al. Novel small molecule inhibitors of TLR7 and TLR9: mechanism of action and efficacy in vivo. Mol Pharmacol. 2014;85:429-40
56. Zhang S, Zhang Q, Wang F, Guo X, Liu T, Zhao Y. et al. Hydroxychloroquine inhibiting neutrophil extracellular trap formation alleviates hepatic ischemia/reperfusion injury by blocking TLR9 in mice. Clin Immunol. 2020;216:108461
Author contact
Corresponding author: Yan Wang, address: The First Clinical Medical College of Shanxi Medical University, 85 Jiefang South Road, Taiyuan, 030001, Shanxi, China; E-mail: wangyan0328edu.cn. Jun Xu, address: The First Clinical Medical College of Shanxi Medical University, 85 Jiefang South Road, Taiyuan, 030001, Shanxi, China; E-mail: junxutycom. Wei Wang, address: Peking University, Beijing, 100191, China; E-mail: wangwei83427pku.edu.cn.