Impact Factor




Theranostics 2027; 17(2):845-860. doi:10.7150/thno.142783 This issue Cite
Research Paper
GPR84-PET imaging visualizes tumor-associated myeloid cells in brain metastases
Renesmee C. Kuo1,2, Samantha T. Reyes2, Rohit Verma3, Piper Mahn2, Sydney C. Nagy2, Mausam Kalita2, Bo Zhang2, Andrew Setiadi2, Shreya Kumar3, Gianna Tuffley2, Amirreza Ehsani3, Samuel Aubert4, Josué Ballesteros-Álvarez4, Pedro Machado Almeida4, Pauline Chu5, Israt S. Alam2,6, Gayatri Gowrishankar2, Graeme Milligan7, Hannes Vogel5, Michael Lim3, Melanie H. Gephart3, Michelle L. James2,8 
1. Department of Electrical Engineering, Stanford University, Stanford, CA 94305, USA.
2. Molecular Imaging Program at Stanford, Department of Radiology, Stanford University, Stanford, CA 94305, USA.
3. Department of Neurosurgery, Stanford University, Stanford, CA 94305, USA.
4. Lunaphore Technologies, Tolochenaz, Switzerland.
5. Department of Pathology, Stanford University, Stanford, CA 94305, USA.
6. Department of Radiology, University of Michigan, Ann Arbor, MI 48109, USA.
7. Centre for Translational Pharmacology, School of Molecular Biosciences, College of Medical, Veterinary and Life Sciences, University of Glasgow, Glasgow G12 8QQ, Scotland, U.K.
8. Department of Neurology and Neurological Sciences, Stanford University, Stanford, CA 94305, USA.
Received 2026-8-19; Accepted 2026-10-24; Published 2027-1-1
Abstract
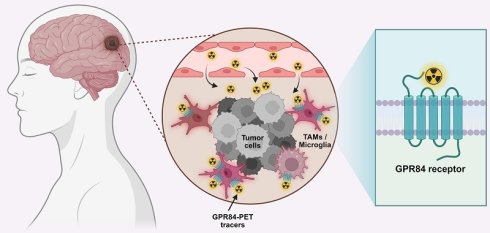
Rationale: Brain metastases are the most prevalent intracranial tumors in adults and have been shown to contain large numbers of tumor-associated myeloid cells (TAMCs) that facilitate immune suppression and treatment resistance. Current imaging approaches cannot distinguish myeloid cell-associated signal from tumor cell involvement in the central nervous system (CNS). We identified G protein-coupled receptor 84 (GPR84) as a highly specific marker of myeloid cells in human brain metastases and evaluated two CNS-penetrant, GPR84-targeted positron emission tomography (PET) tracers to detect myeloid cell activation and treatment-associated remodeling.
Methods: GPR84 expression and cellular specificity were characterized in human brain metastases using single-cell RNA sequencing (scRNA-seq) and spatial multiomic profiling. Two GPR84-PET tracers, [11C]MGX-38 and [18F]MGX-110S, were evaluated in a murine model with an intracranial melanoma implant and a separate extracranial tumor, with mice treated with combined anti-PD-1/anti-CTLA-4 immunotherapy or vehicle control. The translational relevance of this imaging approach was further evaluated using in vitro autoradiography and histopathologic analysis of human brain metastasis tissue.
Results: In human melanoma brain metastases, GPR84 expression was highly upregulated in activated and inflammatory myeloid cells. Both [11C]MGX-38 and [18F]MGX-110S enabled in vivo visualization of GPR84-expressing myeloid cells in mouse intracranial and extracranial tumors. Combined anti-PD-1/anti-CTLA-4 therapy in tumor-bearing mice decreased GPR84-PET signal in association with reduced tumor-associated myeloid infiltration. [18F]MGX-110S demonstrated superior tumor-to-healthy brain contrast compared with [11C]MGX-38. In human brain metastasis tissues, GPR84-PET tracer binding spatially corresponded with GPR84+ CD163+ macrophage-associated regions.
Conclusions: GPR84 is a highly specific imaging biomarker of activated TAMCs in brain metastases. GPR84-PET tracers enable noninvasive quantification of GPR84-expressing myeloid cells in tumor bearing mice and detection of treatment-associated remodeling of the tumor microenvironment. Importantly, in vitro autoradiography of human brain metastasis tissues further demonstrated colocalization of GPR84-PET tracer binding with TAMCs. These findings highlight the translational potential of GPR84-PET imaging as an imaging strategy to characterize TAMC biology and monitor responses to immunotherapy in patients with brain metastases.
Keywords: brain metastases, immunotherapy, PET imaging, GPR84, tumor-associated myeloid cells
Introduction
Brain metastases are the most common intracranial neoplasm in adults. Up to 40% of patients with advanced cancer develop brain metastases over the course of their disease, with the highest prevalence in melanoma, non-small cell lung cancer (NSCLC), and breast cancer [1]. Although targeted therapies and immune checkpoint inhibitors (ICIs) have improved outcomes for some patients, intracranial responses remain variable and are often not durable [2]. These limitations are shaped in part by the brain tumor microenvironment (TME), where metastatic cancer cells interact with resident and infiltrating immune and stromal populations within the constraints of the blood-brain barrier (BBB) [3]. This heterogeneous niche frequently promotes immunosuppression, disease progression, and therapeutic resistance [4,5].
Tumor-associated myeloid cells (TAMCs) are among the most abundant immune populations in brain metastases and regulate intracranial tumor growth and therapeutic response. TAMCs include tumor-associated macrophages (TAMs), resident microglia, tumor-infiltrating monocytes, tumor-associated neutrophils, dendritic cells, and myeloid-derived suppressor cells [6]. In response to tumor-derived and tissue-specific cues, these cells adopt diverse inflammatory, phagocytic, lipid-associated, interferon-responsive, and immunoregulatory phenotypes. TAMCs can promote immune evasion, angiogenesis, extracellular matrix remodeling, and tumor cell survival while suppressing antitumor immunity through cytokine secretion, immune checkpoint ligand expression, inhibition of cytotoxic CD8+ T cells, and expansion of regulatory T cells. The abundance and functional state of TAMCs may contribute to heterogeneous responses to ICIs targeting programmed cell death 1 (PD-1) and cytotoxic T lymphocyte-associated protein 4 (CTLA-4), and elevated TAMC burden is associated with advanced disease and unfavorable outcomes across multiple malignancies [7,8]. TAMCs therefore represent both a potential therapeutic and an attractive imaging target for evaluating biological responses to immunotherapy.
Magnetic resonance imaging (MRI) is the current standard of care for the detection and anatomical characterization of brain metastases [9], but classical MRI does not directly capture molecular markers that define specific immune cells or their functional phenotypes in the TME. Ferumoxytol-enhanced MRI has shown promise for imaging TAMCs, although interpretation of the resulting images is complicated by nonspecific uptake in myeloid cells, astrocytes, endothelial cells, and tumor-associated regions with increased vascular permeability, limiting cellular specificity and functional resolution [10-12]. Positron emission tomography (PET) offers a complementary, highly sensitive molecular imaging approach for noninvasively monitoring cellular and biochemical processes in vivo [13,14]. Myeloid cell-specific PET imaging could enable spatially resolved, whole-body assessment of innate immune responses across intracranial and extracranial tumors, as well as longitudinal monitoring of therapy-induced changes.
A wide range of PET tracers targeting myeloid cell markers, including CSF1R [15], P2X7R [16], CCR2 [17], CD11b [18], CD163 [19,20], CD206 [21], folate receptor [22], and arginase [23], have been developed, but many lack true specificity for myeloid cells and do not readily cross the BBB; the majority have not been evaluated in human brain tumors. The most widely studied and clinically available PET tracers for myeloid cell imaging target the 18-kDa translocator protein (TSPO), which is unfortunately broadly expressed by TAMCs, cancer cells, astrocytes, and endothelial cells, confounding interpretation of signal in the brain metastatic niche. Thus, CNS-penetrant PET tracers targeting functionally relevant, highly specific biomarkers for TAMCs have the potential to provide mechanistic insight into myeloid dynamics and support patient stratification and therapeutic monitoring.
To address this unmet need, we identified G protein-coupled receptor 84 (GPR84), a seven-transmembrane G protein-coupled receptor (GPCR), as a promising biomarker predominantly expressed on activated myeloid cells. GPR84 is increasingly being recognized as a regulator of inflammatory and immunoregulatory myeloid programs in the context of cancer [24,25]. While its role in cancer is highly context-dependent, elevated GPR84 expression has been detected in multiple human malignancies, including glioma, colorectal, liver, and prostate cancers [26-30]. In solid tumors characterized by chronic inflammation and myeloid-mediated immune suppression, GPR84 signaling has been shown to promote PD-L1 expression through inhibition of lysosomal degradation and reinforcing CD8+ T cell dysfunction [31]. Genetic or pharmacologic inhibition of GPR84 can alleviate myeloid-mediated immune suppression, restore cytotoxic T cell activity, and enhance responses to anti-PD-1 therapy in preclinical models [31], supporting GPR84 as both a functionally relevant immunoregulatory target and a compelling candidate biomarker for highly specific molecular imaging of activated tumor-associated myeloid populations.
We recently developed two small-molecule PET tracers targeting GPR84—[11C]MGX-38 and [18F]MGX-110S—and demonstrated their specificity for GPR84, ability to cross the intact BBB in mice, and selective binding to activated myeloid cells in preclinical models of innate immune activation (Figure S1) [32,33]. Here, we reanalyzed publicly available single-cell RNA sequencing (scRNA-seq) data from human melanoma brain metastases to investigate the immune populations expressing GPR84 in the human disease setting. We then evaluated GPR84-PET in a murine model consisting of an intracranial melanoma tumor and a separate extracranial tumor and assessed its ability to monitor treatment-associated myeloid changes following combined PD-1 and CTLA-4 blockade. Finally, we examined the broader translational relevance of GPR84-PET across brain metastases of different primary origins through spatial multiomic profiling of a prostate adenocarcinoma brain metastasis and in vitro autoradiography of human lung and prostate adenocarcinoma brain metastases.
Materials and Methods
Single-cell RNA sequencing analysis: Single-cell RNA sequencing data from five treatment-naïve human melanoma brain metastases (MBM01_sc – MBM05_sc) were obtained from the publicly available dataset GSE200218 [34] and reanalyzed using Scanpy (v1.10) in Python. CellBender-filtered 10x Genomics expression matrices from the available CD45-positive and CD45-negative fractions were annotated by patient sample and combined for downstream analysis.
Cells with fewer than 200 or more than 8,000 detected genes, fewer than 500 total counts, or greater than 20% mitochondrial transcripts were excluded. Counts were normalized to 10,000 transcripts per cell and log transformed. The 3,000 most highly variable genes were identified using the Seurat method, scaled, and analyzed using principal component analysis (PCA). Neighborhood graphs were constructed using the first 30 principal components and 15 nearest neighbors. Cells were clustered using the Leiden algorithm at a resolution of 0.6 and visualized by t-distributed stochastic neighbor embedding (t-SNE).
Major cell lineages were annotated at the cluster level using curated canonical marker signatures for malignant melanoma cells, myeloid cells, T cells, NK cells, B cells, plasma cells, endothelial cells, fibroblast/MSC-like cells, pericytes/vSMC, and oligodendrocytes. Cluster-level signature scores and canonical marker expression were used to assign lineage identities.
Myeloid cells were subsequently subsetted and reanalyzed using 2,500 highly variable genes, PCA, a 15-nearest-neighbor graph based on 30 principal components, and Leiden clustering (resolution = 0.45). Cluster-specific marker genes were identified using the Wilcoxon rank-sum test and ranked by effect size and statistical significance. Myeloid clusters were grouped into six phenotypes based on their transcriptional profiles: resident-like macrophages, antigen-presenting TAMs, infiltrating monocyte-like TAMs, activated microglia, cycling myeloid cells, and dendritic cells. Resident-like macrophages were identified by FOLR2, MRC1, STAB1, F13A1, and SELENOP; antigen-presenting TAMs by increased MHC class II genes and CD74; monocyte-like TAMs by FCN1, VCAN, TREM1, and related inflammatory/monocytic genes; activated microglia by retention of microglial lineage markers together with activation-associated genes; cycling myeloid cells by proliferation-associated genes including MKI67 and TOP2A; and dendritic cells by canonical dendritic cell markers including CD1C, CLEC9A, XCR1, and LAMP3.
Myeloid phenotype abundance was quantified for each patient as both absolute cell number and relative proportion. GPR84 expression was evaluated in the normalized myeloid cell dataset, and cells with detectable GPR84 expression greater than zero were classified as GPR84-expressing cells. The number and proportion of GPR84+ cells were calculated for each myeloid phenotype, and their distribution was visualized on the myeloid t-SNE embedding.
Animals: All animal experiments were conducted under Stanford University Institutional Animal Care and Use Committee approval (protocol 32577; institutional assurance A3213-01). Six- to eight-week-old female C57BL/6J mice (Jackson Laboratory, strain 000664) were housed in groups of 5 under a 12-hour light/dark schedule with ad libitum access to food and water. Experimental group sizes varied across studies because only a limited number of animals could be imaged from a single radiotracer production batch while maintaining adequate molar activity. Accordingly, animals not included in PET imaging were included in ex vivo gamma counting studies.
Cell culture: B16F1-luc murine melanoma cells (American Type Culture Collection, ATCC, Manassas, VA) were grown in Dulbecco’s Modified Eagle Medium (DMEM; Gibco, Billings, MT) containing 10% fetal bovine serum (FBS; Sigma-Aldrich, St. Louis, MO) and 1% penicillin-streptomycin (Sigma-Aldrich). Cells were cultured at 37 °C in a humidified incubator with 5% CO2.
Tumor implantation: For extracranial tumors, 2.5 105 B16F1 cells were suspended in 100 µL sterile PBS and mixed with Matrigel (1:1; Corning, #356234, Corning, NY) and subcutaneously injected into the right flank. Seven days after subcutaneous implantation, the same researcher measured tumor dimensions daily using a caliper. Tumor volume was calculated using the following equation: volume = (π/6)
 height
 width
 length. Two days after extracranial tumor implantation, mice were anesthetized with ketamine-xylazine for intracranial implantation. 5
 103 B16F1-luc cells in 2 µL phosphate-buffered saline (PBS) were implanted in the right brain hemisphere, 2 mm anterior and 2 mm lateral to lambda, with mice held in place using a stereotaxic unit. Melanoma cells were injected to a depth of 3 mm over 1 min with an AS blunt-ended Hamilton syringe. Sham-operated controls received 2 µL PBS only. Five days after intracranial tumor implantation, mice were imaged using bioluminescence imaging to assess tumor establishment. Animals with either negligible or excessively high intracranial signal were excluded before assignment to vehicle or treatment groups for subsequent PET imaging studies.
Drug treatments: Mice received treatment on days 5, 7, and 9 after intracranial tumor implantation. Those in the ICI treatment group received intraperitoneal (i.p.) injections of 200 µL total volume containing 100 µg anti-PD-1 (#BE0146) and 100 µg anti-CTLA-4 (#BE0164) antibodies (Bio X Cell, Lebanon, NH). Vehicle controls received 200 µL sterile saline intraperitoneally on the same schedule.
Bioluminescent imaging: Five days after intracranial tumor implantation, mice received 150 µL luciferin (15 mg/mL in PBS) by i.p. injection immediately before imaging on an In Vivo Imaging System (IVIS; PerkinElmer, Waltham, MA).
RNA extraction, cDNA synthesis, and qPCR: Immediately after dissection, whole brains were immersed in TRIzol (Thermo Fisher Scientific, Waltham, MA), snap-frozen on dry ice, and stored at -80 °C until processing. RNA was isolated following the Thermo Fisher Scientific protocol. Complementary deoxyribonucleic acid (cDNA) was synthesized using the RT2 First Strand Kit (Qiagen, Redwood City, CA). QuantStudio system (Thermo Fisher Scientific) was used to perform qPCR with Qiagen primers for Gpr84 and Tspo. Gapdh was used as the reference gene for normalization. Each sample was run in triplicate.
Automated spatial multiomic imaging using COMET: FFPE sections were baked at 60 °C for 1 hour, deparaffinized in Histoclear, rehydrated in ethanol, and subjected to heat-induced epitope retrieval at 99 °C for 1 hour. After equilibration in 1x Multistaining Buffer (MSB, BU06, Lunaphore Technologies), slides were transferred to the COMET system (Lunaphore Technologies, Tolochenaz, Switzerland) for automated processing.
RNA detection was performed using the automated RNAscope HiPlex Pro Assay (Advanced Cell Diagnostics, Inc., Newark, CA), followed by seqIF [35] to detect protein on the same tissue section. Samples were pretreated for 30 min at 40 °C and hybridized with pooled RNA probes for 2 hours at 40 °C. Probe signals were amplified sequentially with AMP1, AMP2, and AMP3 oligos for 30 min each at 37 °C.
RNA targets were visualized through iterative cycles of fluorescent probe hybridization, image acquisition in the FITC, TRITC, Cy5, and Cy7 channels, and fluorophore cleavage. These cycles were repeated until all RNA targets were imaged, followed by acquisition of a tissue-background image. For seqIF, primary antibodies were incubated for 8 min and secondary antibodies for 2 min, followed by a 2-min DAPI nuclear stain. Images were acquired using exposure times of 50 ms for DAPI, 250 ms for TRITC, and 400 ms for Cy5. Between staining cycles, antibodies were eluted for 2 min at 37 °C and residual fluorescence was quenched for 30 s. Images from all cycles were subsequently stitched and registered, then exported as multilayer OME-TIFF files for visualization and analysis in HORIZON software (Lunaphore Technologies).
Flow cytometry: Mice were euthanized under 3% isoflurane and transcardially perfused with PBS to remove circulating blood. Whole brains were removed to isolate brain tumors, which were mechanically dissociated in ice-cold CNS buffer (2.5% HEPES in HBSS without Ca/Mg; Gibco). Cells were resuspended in FACS buffer containing 2% FBS (Thermo Fisher Scientific, #A5670701) and stained with the following antibodies and viability dye: AF488 anti-CD45 (BioLegend, San Diego, CA, #160305), BUV395 anti-CD3 (BD Biosciences, #569614), RB705 anti-F4/80 (BD Biosciences, #570289), PB anti-CD11b (BioLegend, #101223), BV510 anti-Ly6G (BioLegend, #127633), PE anti-GPR84 (Alomone Labs, Jerusalem, Israel, #AGR-052-PE), SparkRed718 anti-Ly6C (BioLegend, #128057), Zombie NIR Fixable Viability Dye (BioLegend, #423105). Cells were washed and fixed in 2% paraformaldehyde (Thermo Fisher Scientific, J19943.K2) for 20 min at room temperature. Flow data were acquired using a Cytek Aurora (Cytek Biosciences, Fremont, CA) and analyzed using FlowJo v.11.1.1 (Waters Biosciences).
[11C]MGX-38 radiosynthesis: [11C]MGX-38 was synthesized via methylation of the phenolic precursor using [11C]methyl iodide ([11C]MeI) as previously described [36]. Briefly, the precursor (1.0-1.25 mg) was dissolved in 0.5 mL anhydrous dimethylformamide, and 1.2 µL of 5.0 M aqueous KOH was added immediately before radiolabeling. The reaction vessel was cooled to -10 °C, [11C]MeI was added, and the mixture was heated to 70 °C for 5 min. After cooling, the crude mixture was diluted with aqueous acetonitrile and purified by semipreparative high-performance liquid chromatography (HPLC). The radioactive product was collected in water and concentrated using a C18 solid-phase extraction cartridge. [11C]MGX-38 was subsequently eluted with ethanol and formulated in sterile saline for injection. Analytical HPLC was used to assess radiochemical purity. Molar activity for [11C]MGX-38 (n = 3 syntheses) was 448.81 ± 100.27 GBq/µmol, with radiochemical and chemical purities >98%.
[18F]MGX-110S radiosynthesis: [18F]MGX-110S was synthesized by copper-mediated radiofluorination on a GE TRACERlab FXFN module as previously described [33]. In brief, [18F]fluoride was trapped on a QMA cartridge, eluted with potassium triflate/tetraethylammonium bicarbonate solution, and azeotropically dried with acetonitrile. The dried [18F]fluoride was then combined with the MGX-90S Bpin precursor (2 mg), Cu(OTf)2 (8.2 mg), and pyridine (44 µL) in DMA/1-butanol (2:1, v/v; 250 µL) and heated at 130 °C for 18 min. [18F]MGX-110S was isolated by semipreparative HPLC, collected on a C18 cartridge, eluted with ethanol, and formulated in sterile saline. Analytical HPLC was used to assess radiochemical purity. Molar activity for [18F]MGX-110S (n = 3 syntheses) was 89.17 ± 8.51 GBq/µmol, with radiochemical and chemical purities >98%.
Imaging studies: PET data for each tracer were pooled from three independent experiments. Mice were anesthetized with 2% isoflurane in oxygen and intravenously injected with [11C]MGX-38 or [18F]MGX-110S (5.55 MBq). Static scans (10 min) were acquired in list-mode format 40 min after tracer injection on a GNEXT scanner (matrix size, 240  240
 191; Sofie Biosciences, Dulles, VA). CT was performed immediately afterward for anatomical coregistration, PET attenuation, and scatter correction. Mice were imaged with MRI immediately after PET/CT imaging. MRI was performed on a 3T horizontal bore Bruker BioSpec MRI scanner (Bruker Corp, Billerica, MA), with a 120-mm actively shielded gradient insert (600 mT/m, 1,000 T/m/s), AVANCE III electronics, and ParaVision 360 v3.7 software. A multinuclear volume RF coil with an 8-channel receive configuration was used. Coronal and axial T2-weighted images were acquired using a RARE (rapid acquisition with relaxation enhancement) sequence (repetition time, 2,000 ms; echo time, 60 ms; RARE factor, 10; 8 averages; slice thickness, 1 mm; voxel size, 0.104 mm
 0.104 mm
 1 mm).
PET image analysis: PET/MR registration was performed in Inveon Research Workplace (Siemens Healthineers, Erlangen, Germany) using the CT image to align the skull. For PET analysis, intracranial tumor regions of interest (ROIs) were delineated based on T2-weighted MRI signal, whereas ROIs for extracranial tumors were defined using CT-derived tumor margins. PET images were decay-corrected and normalized to injected dose for each animal. %ID/g was calculated and normalized to injected dose for all tumor ROIs. For image visualization, a common %ID/g color scale was applied to all animals within each figure. The upper limit of the color scale was defined based on the animal with the highest tumor signal (e.g., a vehicle-treated mouse). To account for differences in injected tracer dose between animals, the corresponding maximum image intensity was individually adjusted for each animal so that all images have the same maximum %ID/g value. Imaging analyses were blinded; all mice were allocated unique ID numbers before quantification, and group identities were revealed only after analysis.
Ex vivo biodistribution and autoradiography: After PET imaging studies, each mouse underwent a cardiac puncture to obtain blood for gamma counting while under anesthesia (3% isoflurane), followed by transcardial perfusion with 20 mL of PBS. Brain, blood, spleen, liver, extracranial tumor, muscle, bone marrow, bone, and tail (for residual correction) were collected separately for gamma counting. Tissue radioactivity for all organs was decay-corrected and counted on a gamma counter (Hidex, Turku, Finland). After gamma counting, whole brains were embedded in optimal cutting temperature (OCT) compound (Sakura Finetak USA, Torrance, CA) on dry ice, and cryosectioned into thin (40 µm) coronal slices onto positively charged microscope slides. Slides were exposed to digital phosphor films for 10 half-lives at -20 ºC, then scanned on a Typhoon phosphorimager (Amersham Biosciences, Amersham, United Kingdom). Tissue sections were stained with H&E using Hematoxylin Gills 3 and Eosin-Y Richard-Allan Scientific (Thermo Fisher Scientific) using a standard protocol to provide anatomical reference.
Human biospecimen collection: The Stanford Institutional Review Board (IRB no. 62499) approved the collection and use of human specimens, and the study was conducted in accordance with the Declaration of Helsinki guidelines for ethical research conduct. Written informed consent was obtained from all participants before biospecimen collection.
In vitro autoradiography: 12-µm-thick frozen human brain metastasis tissues were cut with a cryostat and mounted onto positively charged microscope slides. The slides were subsequently incubated for 40 min with either 148 MBq of [11C]MGX-38 (4 nM) or 59.2 MBq of [18F]MGX-110S (4 nM) in 80 mL of 50 mM Tris-HCl buffer. To assess binding specificity, adjacent sections were co-incubated with a 1,000-fold excess of the GPR84 antagonist, GLPG1205. After incubation, slides were washed in ice-cold buffer, briefly rinsed in distilled water, and air-dried. Dried sections were exposed to digital phosphor films for 5 half-lives and then imaged using a Typhoon phosphorimager. Adjacent sections were stained with H&E to provide anatomical reference.
Immunohistochemistry: Frozen human brain metastases sections (12 µm) or FFPE human brain metastases sections (5 µm) were mounted on positively charged microscope slides. Fresh-frozen sections were fixed sequentially in acetone for 15 min and paraformaldehyde for 15 min before staining. FFPE sections were deparaffinized, rehydrated, and subjected to heat-induced antigen retrieval in boiling 10 mM sodium citrate buffer (pH 6.0) for 20 min. Human tissue sections were stained with mouse monoclonal anti-CD163 (1:500; Bio-Rad, MCA1853) or rabbit polyclonal anti-GPR84 (1:200; Alomone Labs, AGR-052), followed by biotinylated goat anti-mouse IgG (1:100; Vector Laboratories, BA9200) or biotinylated goat anti-rabbit IgG (1:100; Vector Laboratories, BA1000), respectively. Adjacent FFPE brain sections (5 µm) from a murine melanoma brain metastasis model used for spatial biology analyses were stained with rat monoclonal anti-F4/80 antibody (1:50; Thermo Fisher, 14-4801-82), followed by biotinylated goat anti-rat IgG (1:100; Vector Laboratories, BA9400) antibodies. Signal was amplified using the VECTASTAIN Elite avidin-biotin complex (Vector Laboratories, PK-6100) and visualized with a 3,3’-diaminobenzidine substrate (Vector Laboratories, SK-4100). Sections were counterstained with hematoxylin (Abcam), dehydrated, coverslipped using DPX mounting medium (Sigma-Aldrich), and scanned with a NanoZoomer (Hamamatsu Photonics, Shizuoka, Japan).
Multiplex immunofluorescence staining using the MACSima Imaging System: FFPE tissue sections (5 µm) were mounted on MACSwell HighRes slides (Miltenyi Biotec, Gaithersburg, MD, #130-126-799) and incubated at 60 °C for 1 h. Sections were deparaffinized in xylene, rehydrated through graded ethanol, and subjected to heat-induced epitope retrieval in TEC buffer (pH 9.0) for 20 min at 98 °C. Slides were then rinsed in nuclease-free water, mounted in MACSwell Imaging Frames (Miltenyi Biotec, #130-124-676), and hydrated in PBS containing 0.05% Tween 20.
Spatial transcript detection was performed using the RNAsky protocol according to the manufacturer’s instructions. A custom RNA panel was designed using the RNAsky Design service (Miltenyi Biotec). Briefly, oligonucleotide padlock probes were hybridized to target sequences overnight, followed by washing, probe ligation, rolling-circle amplification, and crosslinking of the resulting amplicons. Transcripts were iteratively detected on the MACSima Imaging System (Miltenyi Biotec). The same tissue sections then underwent automated iterative fluorescent antibody staining for protein detection. Multiomic imaging data were processed using MACS iQ View software. Antibodies and RNA probes are listed in Table S7.
Statistical analysis: Statistical analyses were performed using Prism v10 (GraphPad Software, San Diego, CA). Statistical significance was determined using a Mann-Whitney test or one-way analysis of variance (ANOVA) with a multiple comparisons test as indicated in the corresponding figure legends.
Results
GPR84 is a promising biomarker of myeloid cells in human melanoma brain metastases
To evaluate the clinical relevance of GPR84 as a myeloid imaging biomarker in human brain metastases, we reanalyzed a publicly available scRNA-seq dataset (GSE200218) comprising five treatment-naïve melanoma brain metastases (MBM01-MBM05) [34]. Unsupervised Leiden clustering identified 35,022 cells across 23 clusters (Figure 1A and Table S1). Annotation using canonical lineage markers identified malignant melanoma cells, myeloid cells, T cells, natural killer (NK) cells, B cells, plasma cells, oligodendrocytes, pericyte/vSMCs (vascular smooth muscle cells), endothelial cells, and fibroblast/mesenchymal stromal cell (MSC)-like populations.
GPR84 is upregulated in distinct myeloid populations in human melanoma brain metastases. (A) t-SNE projections of cells from five treatment-naïve melanoma brain metastases, colored by unsupervised Leiden clustering (left) or annotated major cell lineages (right). Total cell numbers and Leiden cluster counts are indicated. (B) Feature plots showing GPR84 and TSPO expression across all cells. Non-expressing cells are shown in gray, and expression intensity is displayed on a log-normalized scale. (C) t-SNE projection of myeloid cells after subset-specific reclustering, colored by myeloid phenotypes. Total myeloid cell number and cluster count are indicated. (D) Distribution of myeloid phenotypes across individual patient samples, shown as absolute cell numbers (left) and relative proportions (right). (E) t-SNE projection highlighting GPR84-expressing myeloid cells, colored by myeloid phenotype; non-expressing cells are shown in gray. The total number of GPR84+ myeloid cells is indicated. TAM, tumor-associated macrophage.
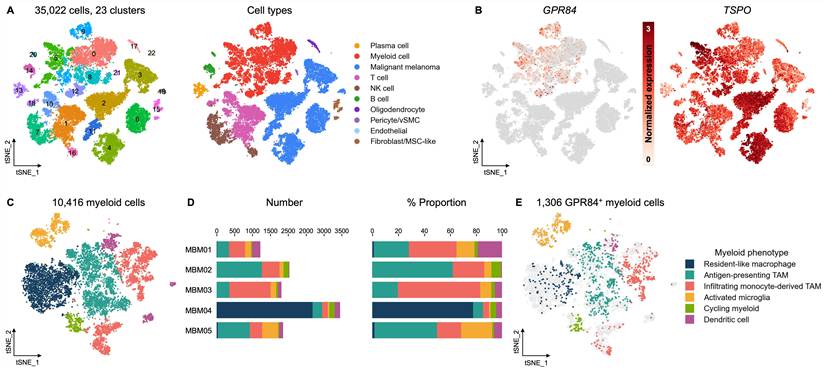
We next compared the cellular distribution of GPR84 with TSPO, the most widely used PET imaging biomarker for neuroinflammation and myeloid cell imaging in clinical research. GPR84 expression was concentrated within the myeloid compartment, with minimal or negligible expression across most malignant, lymphoid, stromal, vascular, and oligodendroglial populations (Figure 1B). In contrast, TSPO was broadly expressed across myeloid and non-myeloid compartments. Cluster-level marker analysis further supported the myeloid association of GPR84-expressing cells. GPR84 expression was enriched in Leiden clusters that also expressed canonical myeloid markers, including ITGAM, AIF1, LYZ, TYROBP, C1QA, APOE, TREM2, and MSR1 (Figure S2A).
To further characterize the GPR84-expressing myeloid cells, we subset and reanalyzed 10,416 myeloid cells across all five tumors. Secondary Leiden clustering identified 11 myeloid clusters, which were grouped into six broader marker-informed phenotypes based on cluster-specific transcriptional profiles: resident-like macrophages, antigen-presenting TAMs, infiltrating monocyte-derived TAMs, activated microglia, cycling myeloid cells, and dendritic cells (Figure 1C). The relative abundance of these populations varied substantially across individual tumors, demonstrating marked interpatient heterogeneity in the myeloid composition of melanoma brain metastases (Figure 1D).
Next, we examined GPR84 expression across these myeloid phenotypes. 12.5% of all myeloid cells (1,306 myeloid cells) showed detectable GPR84 expression, and GPR84-positive cells were distributed nonuniformly across the myeloid manifold (Figure 1E). Phenotype-based quantification showed the highest proportion of GPR84-positive cells in activated microglia, followed by cycling myeloid cells, infiltrating monocyte-derived TAMs, and antigen-presenting TAMs, whereas resident-like macrophages showed substantially lower GPR84 expression (Figure S2B).
GPR84 expression tracks tumor-associated myeloid remodeling in a murine intracranial melanoma implant model
Having established GPR84 as a highly specific marker of activated microglia and infiltrating monocyte-derived TAMs in human melanoma brain metastases, we sought to use a preclinical model that recapitulates this myeloid expression pattern to translate and evaluate our GPR84-PET tracers. We have previously optimized a B16F1 melanoma transplantation model with subcutaneous and intracranial tumors originally described by Taggart et al. [37,38]. Combined anti-PD-1 and anti-CTLA-4 therapy is an established treatment for advanced melanoma, including melanoma brain metastases, and has been shown to remodel the myeloid compartment while enhancing anti-tumor T cell responses. In the optimized mouse model, we previously demonstrated that ICOS-immunoPET detects treatment-associated T cell activation at a later imaging time point [38]. Thus, we used this treatment paradigm to assess whether GPR84-PET could capture earlier therapy-associated changes in the myeloid compartment. A subset of tumor-bearing mice received three doses of combined anti-PD-1 and anti-CTLA-4 therapy.
Extracranial tumor growth was significantly reduced in therapy-treated mice compared with vehicle controls beginning on day 8 after intracranial tumor implantation (day 8: P = 0.0016; day 9: P = 0.0009; Figure S3A). Similarly, T2-weighted MRI on day 9 showed lower intracranial tumor burden in the treatment group (P < 0.01; Figure S3B). Whole-brain quantitative polymerase chain reaction (qPCR) revealed significantly elevated Gpr84 expression in vehicle-treated mice with intracranial melanoma implants relative to sham-operated controls, whereas Gpr84 expression was significantly lower following checkpoint blockade (P = 0.0158; Figure 2A). This treatment-associated differential expression was substantially greater for Gpr84 than for Tspo (3.84-fold vs. 1.05-fold, respectively), which is the most widely assessed PET biomarker in clinical research.
GPR84 is a more specific myeloid biomarker than TSPO in a murine intracranial melanoma implant model. (A) qPCR analysis of Gpr84 and Tspo expression in whole brains of melanoma brain metastasis-bearing mice treated with vehicle or combined immune checkpoint blockade (anti-PD-1 and anti-CTLA-4; n = 5/group). Data are represented as fold change versus sham animals. The dashed line indicates the sham baseline. (B) Representative H&E and F4/80 IHC of FFPE coronal brain sections from vehicle- and therapy-treated mice. Insets (Regions 1-4) show increased mononuclear cell infiltration and F4/80+ macrophages in brain tumors (Regions 1 & 3) compared to contralateral healthy brain (Regions 2 & 4). The dark appearance of tumor regions on H&E corresponds to the known pigmentation of implanted B16 melanoma cells. (C) High-magnification (40x) multiplex images showing spatial localization of Gpr84 mRNA (white; red arrowheads) together with CD11b (green), Iba1 (magenta), and F4/80 (orange) protein in the regions defined in (B). DAPI (blue) marks nuclei. Statistical analyses were performed using Mann-Whitney tests (A). * denotes direct comparison of groups (ns, P > 0.05; *P < 0.05). Data are means ± SD (n = 5/group). Scale bars, 50 µm and 20 µm. IHC, immunohistochemistry; R1, region 1; R2, region 2; R3, region 3; R4, region 4.
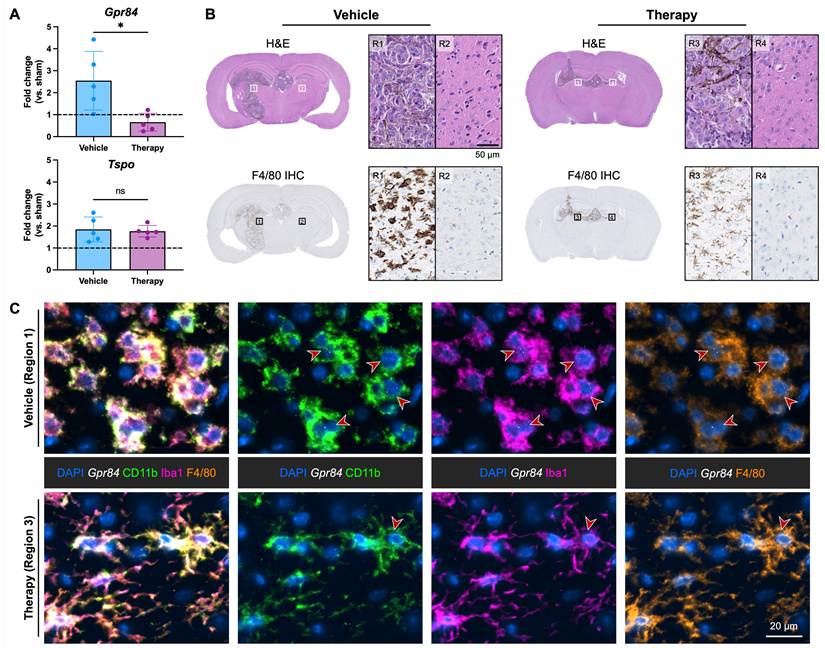
To characterize treatment-associated remodeling of the TAMCs in this model, we performed hematoxylin and eosin (H&E) staining and F4/80 immunohistochemistry on adjacent brain sections (Figure 2B). H&E staining demonstrated extensive infiltration of mononuclear inflammatory cells in intracranial tumors. F4/80 immunohistochemistry revealed dense accumulations of macrophage-rich tumor-associated myeloid cells in vehicle-treated tumors, with enlarged, amoeboid morphology characteristic of an activated macrophage-rich TME. These cells were largely confined to the tumor-bearing hemisphere, with minimal F4/80+ staining in the contralateral, healthy brain. In contrast, tumors from anti-PD-1/anti-CTLA-4-treated mice showed a marked reduction in F4/80+ cell density with a more dispersed and ramified morphology, consistent with reduced myeloid accumulation and treatment-associated remodeling of the tumor myeloid compartment.
We next investigated whether Gpr84 expression localized to these tumor-associated myeloid populations at single-cell resolution. To this end, we performed multiplexed spatial multiomics using RNAscope HiPlex Pro in situ hybridization and sequential immunofluorescence (seqIF) on formalin-fixed paraffin-embedded (FFPE) tissue sections adjacent to those used for H&E and F4/80 staining. We assessed Gpr84 at the RNA level and CD11b, F4/80, Iba1, TSPO, CD31, GFAP, and NeuN at the protein level to delineate myeloid and vascular compartments (Figures 2C and S4). This integrated RNA-protein approach enabled simultaneous visualization of Gpr84 transcripts with multiple lineage markers on the same tissue section using the COMET platform [39]. Primary antibody and RNA probe details are provided in Tables S3-5. In vehicle-treated tumors, Gpr84 RNA puncta spatially colocalized with CD11b, F4/80, and Iba1, which are widely used markers of resident and infiltrating myeloid populations. In contrast, Gpr84 showed little to no spatial correspondence with CD31+ vasculature, GFAP+ astrocytes, or NeuN+ neurons, further supporting the specific localization of Gpr84 to myeloid populations. In therapy-treated tumors, the more dispersed, ramified myeloid cells showed very few Gpr84 puncta, consistent with the overall reduction in Gpr84 expression observed by qPCR following checkpoint blockade. TSPO protein exhibited a broader cellular distribution, with signal detected in both myeloid cells and CD31+ endothelial cells.
To further characterize treatment-associated remodeling of the tumor myeloid compartment and validate the specificity of GPR84 expression at the protein level, we performed flow cytometry on brain tumor tissue from a separate cohort of mice bearing intracranial and extracranial tumors. Resident microglia (F4/80+CD45lowCD11b+) comprised 15.33% of live single cells in vehicle-treated tumors and 17.22% following combined anti-PD-1/anti-CTLA-4 therapy, whereas infiltrating macrophages (F4/80+CD45hiCD11b+) decreased from 34.26% to 18.74% after therapy (Figure S5). Notably, checkpoint blockade reduces the absolute abundance of GPR84-expressing TAMCs without reducing the proportion of GPR84+ cells in either population. Approximately 36% of microglia and 69% of infiltrating macrophages expressed GPR84 in both vehicle- and therapy-treated groups, whereas therapy reduced the absolute numbers of GPR84+ cells from 508 to 234 in microglia and from 1,750 to 412 in infiltrating macrophages. Together with the complementary RNA-level spatial data, these results support GPR84 as a marker of tumor-associated myeloid populations in this model and the use of GPR84-PET as a noninvasive readout of treatment-associated myeloid remodeling.
GPR84-PET imaging enables specific visualization of treatment-associated myeloid cell remodeling in a murine intracranial melanoma implant model
We next evaluated whether PET imaging could noninvasively detect checkpoint blockade-induced myeloid remodeling. To this end, we assessed two GPR84-PET tracers, [11C]MGX-38 and [18F]MGX-110S, for their ability to track GPR84-expressing myeloid cells in vivo. [11C]MGX-38 was synthesized via methylation of the phenolic precursor using [11C]methyl iodide, and [18F]MGX-110S was radiolabeled by copper-mediated radiofluorination (Figure 3A). Both tracers have previously been shown to cross the healthy, intact BBB in mice with favorable brain washout kinetics and metabolic stability (Figure S1C) [32,33], supporting their suitability for neuroimaging. We performed PET/computed tomography (CT) imaging (10-min static; 40-50 min post-tracer injection) on day 9 after intracranial tumor implantation in vehicle-treated mice, anti-PD-1/anti-CTLA-4-treated mice, and sham-operated controls. Imaging was conducted 40 min after injection for both [11C]MGX-38 and [18F]MGX-110S. [11C]MGX-38 PET imaging was performed in the same mice used for spatial multiomic analysis, allowing direct comparison of Gpr84 mRNA localization with in vivo tracer distribution. Whole-body maximum intensity projection (MIP) PET images showed renal and hepatobiliary clearance for both tracers (Figure S6). Although both tracers showed favorable biodistribution profiles, [18F]MGX-110S had lower overall background signal throughout the body than [11C]MGX-38.
GPR84-PET imaging enables in vivo visualization of maladaptive myeloid cells in intracranial and extracranial melanoma tumors. (A) Radiosynthetic schemes for the GPR84-PET tracers [11C]MGX-38 and [18F]MGX-110S. Radioisotopes are labeled in red. (B) Representative coronal PET/MR and PET/CT images summed over 40-50 min after tracer injection in sham, tumor-bearing (vehicle-treated), blocking, and therapy-treated (anti-PD-1 and anti-CTLA-4) mice. Both tracers demonstrate elevated signal in the brain tumors and extracranial tumors relative to sham controls. Blocking with GPR84 antagonist GLPG1205 (2 mg/kg) confirmed binding specificity. Dashed outlines indicate tumor regions. (C) Quantification of PET signal for [11C]MGX-38 and [18F]MGX-110S in ipsilateral brain tumors, contralateral healthy brain, extracranial tumors, and muscle. For [11C]MGX-38: n = 6 sham, n = 9 vehicle-treated, n = 5 vehicle-treated with blocking, and n = 7 therapy-treated. For [18F]MGX-110S: n = 5 sham, n = 20 vehicle-treated, n = 10 vehicle-treated with blocking, and n = 12 therapy-treated. Statistical analyses were performed using one-way ANOVA with Tukey’s multiple comparisons test. # versus vehicle-treated with blocking and * denotes direct comparison of groups (##P < 0.01; ###P < 0.001; ####P < 0.0001; **P < 0.01; ****P < 0.0001). Data are means ± SD. Veh, vehicle; Tx, therapy; IC, intracranial; EC, extracranial.
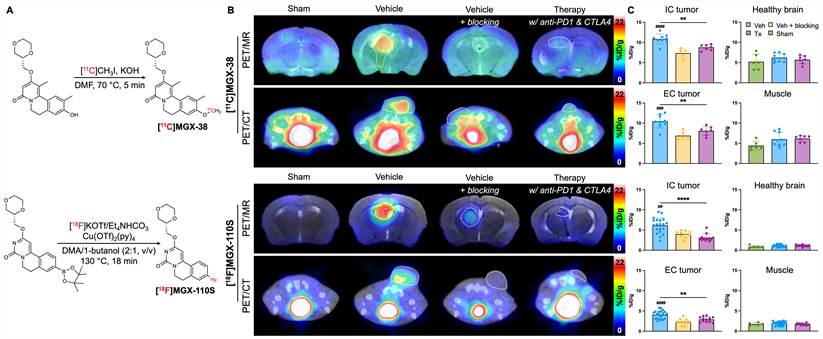
Both tracers showed significantly higher signal in brain and subcutaneous tumors than in contralateral brain tissue and healthy muscle tissue (Figures 3B-C). Tumor-to-healthy brain ratios were 1.74 for [11C]MGX-38 and 5.43 for [18F]MGX-110S, with corresponding tumor-to-muscle ratios of 1.74 and 2.14, respectively (Table S6). Notably, the representative [11C]MGX-38 PET images in Figure 3B are from the same mouse shown in Figure 2B-C. Blocking with the GPR84 antagonist GLPG1205 (2 mg/kg) markedly reduced tracer binding in both intracranial and extracranial tumors, confirming tracer specificity. Consistent with histologic and spatial multiomic evidence of reduced myeloid infiltration, anti-PD-1 and anti-CTLA-4 therapy significantly decreased tumor volume and was associated with a corresponding reduction in GPR84-PET signal relative to vehicle-treated controls.
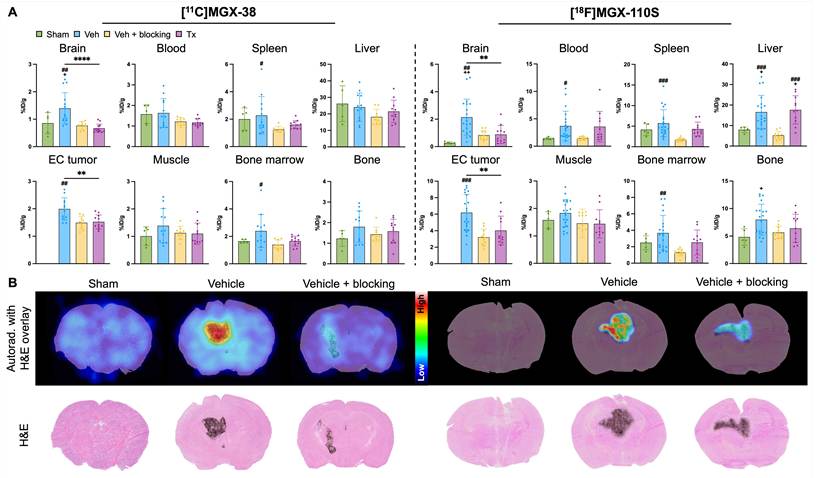
After imaging, mice were perfused to remove residual activity from the blood pool and enable more accurate quantification of tracer distribution in the brain parenchyma by gamma counting and high-resolution ex vivo autoradiography. Gamma counting revealed increased tracer signal in the whole brain and extracranial tumors, with whole-brain signal reaching 1.4-fold and 8-fold higher than sham-operated controls for [11C]MGX-38 and [18F]MGX-110S, respectively (Figure 4A). High-resolution ex vivo autoradiography further demonstrated reduced tracer binding in and around intracranial tumor regions, with reduced signal following blocking with GLPG1205 (Figure 4B).
Ex vivo biodistribution and autoradiography validate GPR84-PET imaging findings. (A) Gamma counting results in whole brains, blood, spleen, liver, extracranial tumors, muscle, bone marrow, and bone for both [11C]MGX-38 and [18F]MGX-110S. (B) Representative high-resolution ex vivo autoradiography images of coronal brain sections from sham controls, vehicle-treated tumor-bearing mice, and vehicle-treated with GLPG1205 blocking with H&E overlay. For [11C]MGX-38: n = 5 sham, n = 12 vehicle-treated, n = 9 vehicle-treated with blocking, and n = 11 therapy-treated. For [18F]MGX-110S: n = 5 sham, n = 20 vehicle-treated, n = 11 vehicle-treated with blocking, and n = 11 therapy-treated. Statistical analyses were performed using one-way ANOVA with Tukey’s multiple comparisons tests. # versus vehicle-treated with blocking, + versus sham, and * denotes direct comparison of groups (#P < 0.05; ##P < 0.01; ###P < 0.001; **P < 0.01). Data are means ± SD. Veh, vehicle; Tx, therapy; IC, intracranial; EC, extracranial.
GPR84-PET tracer binding localizes to myeloid-rich regions in human brain metastases
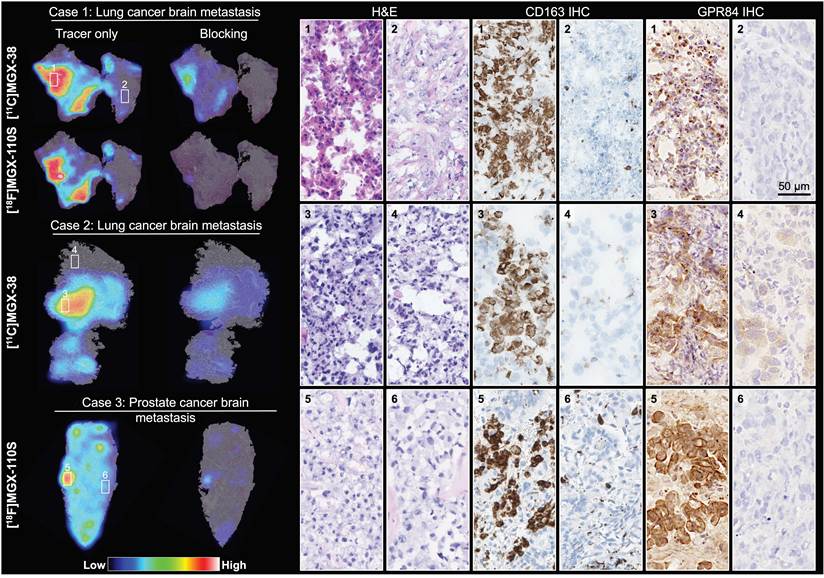
To establish the translational potential of our GPR84-PET tracers, we performed in vitro autoradiography on fresh-frozen human brain metastasis tissue obtained directly from the operating room. Three cases were evaluated: two metastatic lung adenocarcinoma (Cases 1 and 2) and one metastatic prostate adenocarcinoma (Case 3). Both [11C]MGX-38 and [18F]MGX-110S exhibited markedly elevated binding in intratumoral regions with dense perivascular presence of mononuclear inflammatory cells on adjacent H&E-stained sections (Figure 5). Areas of high tracer signal corresponded to immune cell-rich tumor regions, whereas regions with sparse inflammatory infiltrates demonstrated minimal radiotracer binding. To assess the regional distribution of GPR84 protein, we validated a polyclonal anti-GPR84 antibody that cross-reacts with mouse and human GPR84. The antibody showed high specificity for GPR84 in wild-type mice challenged with systemic lipopolysaccharide (LPS) and minimal non-specific binding in GPR84-knockout mice (Figure S7). Immunostaining of the same sections used for autoradiography demonstrated that regions of high tracer binding colocalized with GPR84+ cells and CD163+ macrophage-associated regions, whereas areas with low autoradiographic signal exhibited minimal expression of either marker. This spatial concordance among tracer binding, GPR84 and CD163 expression, and inflammatory morphology on H&E supports specific detection of GPR84-expressing tumor-associated myeloid populations by GPR84-PET in human brain metastases. To evaluate radiotracer binding specificity, adjacent tissue sections were co-incubated with 1,000-fold excess of the GPR84 antagonist GLPG1205. While blocking substantially reduced tracer binding for both compounds, there was modestly higher non-specific binding for [11C]MGX-38 compared with [18F]MGX-110S.
GPR84-PET tracers specifically bind to GPR84-expressing myeloid cells in human brain metastases. Fresh-frozen human brain metastasis tissue was obtained from patients with metastatic lung adenocarcinoma (Cases 1 and 2) and metastatic prostate adenocarcinoma (Case 3). In vitro autoradiography of tissue sections incubated with [11C]MGX-38 or [18F]MGX-110S demonstrated focal radiotracer binding in tumor regions. Co-incubation with GPR84 antagonist (GLPG1205, 1000-fold excess) markedly reduced tracer signal, confirming binding specificity. Autoradiography images were overlaid with corresponding H&E staining, which revealed dense immune cell infiltration in regions with high tracer signal. CD163 and GPR84 immunohistochemistry in adjacent tissue sections identified macrophage-associated and GPR84-expressing regions that spatially corresponded to areas of GPR84-PET tracer binding. Scale bar, 50 µm. IHC, immunohistochemistry.
GPR84 is selectively upregulated in TAMCs in human brain metastases
To further validate the cellular source of GPR84 expression in human brain metastases, we performed multiplex spatial protein profiling with RNA detection on an FFPE prostate adenocarcinoma brain metastasis specimen using the MACSima Imaging System (Figure 6). Spatial multiomics enabled simultaneous assessment of GPR84 together with multiple lineage markers within the same tissue section, allowing us to evaluate its cellular specificity. Because a well-validated antibody suitable for iterative spatial proteomic imaging was not available for GPR84, GPR84 was assessed at the RNA level, whereas lineage markers, including CD163 (TAMs), CD3 (T cells), GFAP (astrocytes), NeuN (neurons), and CD31 (vascular/endothelial cells), were detected at the protein level. At single-cell resolution, GPR84 RNA puncta predominantly localized to CD163+ TAM-rich regions, with minimal signal detected among the evaluated non-myeloid lineage populations (Figures 6 and S8). This pattern was consistent with multiplex spatial imaging findings in the murine brain metastasis model, where Gpr84 transcripts localized to CD11b+ myeloid cells and were largely absent from vascular compartments (Figure 2C). Together with the in vitro autoradiography and immunostaining findings, these data provide orthogonal evidence that GPR84 expression in the human TME is preferentially associated with myeloid populations rather than broadly distributed across lymphoid, endothelial, or neural compartments.
Multiplex spatial imaging confirms selective GPR84 expression in CD163+ TAMs in a human prostate adenocarcinoma brain metastasis. H&E and GPR84 immunohistochemistry staining of adjacent FFPE tissue sections demonstrate mononuclear inflammatory cell infiltration and enrichment of GPR84+ cells within a perivascular immune cell aggregate. The boxed regions are shown at 10x and 40x magnification. Representative multiplex spatial RNA-protein images of the same brain metastasis region showing GPR84 (white; red arrows) together with CD163 (green), CD3 (magenta), CD31 (yellow), and GFAP (brown) expression on the same tissue section. DAPI (blue) marks nuclei. A GFAP single-channel inset was omitted because no GFAP-positive staining was present in the magnified region. GFAP positivity is shown in the wider field. Scale bars, 50 µm and 10 µm. IHC, immunohistochemistry.
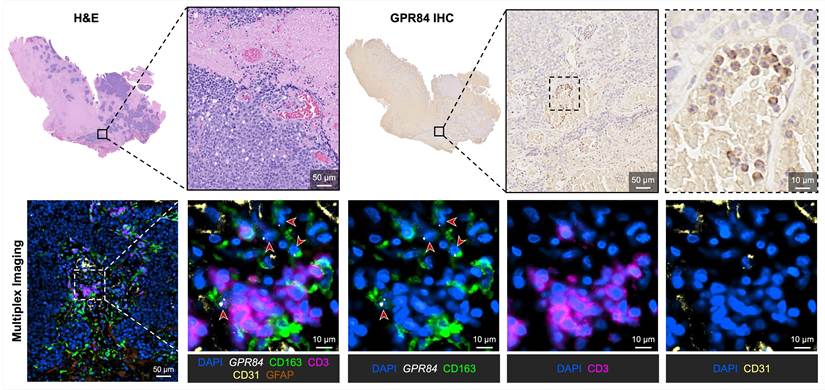
To relate the multiplex imaging findings to tissue morphology and independently assess the regional distribution of GPR84 protein, adjacent tissue sections were stained with H&E and by GPR84 immunohistochemistry. H&E staining demonstrated mononuclear inflammatory cell infiltrates within the tumor, including prominent perivascular aggregates. GPR84 immunostaining showed corresponding enrichment of GPR84+ cells in these immune cell-rich regions, consistent with the distribution of GPR84 RNA and CD163+ TAMs observed by multiplex imaging. Taken together, the concordance among GPR84 RNA localization, CD163 protein expression, GPR84 immunostaining, and histopathologic features supports specific GPR84 expression by tumor-associated myeloid cell populations in human brain metastases and further strengthens its potential as a specific imaging biomarker of activated myeloid biology.
Discussion
TAMCs are increasingly recognized as central drivers of immune evasion in brain metastases. Within the CNS, interactions among the BBB, resident microglia, and infiltrating peripheral myeloid cells create an immunosuppressive niche that impairs CD8+ T cell-mediated tumor immunity and contributes to incomplete or heterogeneous responses to immune checkpoint blockade. As immunotherapy becomes increasingly used across multiple solid tumors with brain metastatic involvement, our ability to define and noninvasively quantify tumor-associated myeloid populations is of great importance.
Recent evidence identifies GPR84 as a lipid-sensing transmembrane GPCR that regulates inflammatory signaling and myeloid cell function and has been implicated in tumor-promoting immune suppression [40]. In preclinical cancer models, GPR84 activation enhances TAMC-mediated suppression of CD8+ T cells, whereas its inhibition or deletion reduces myeloid suppression, promotes antitumor T cell activity, and improves responses to anti-PD-1 therapy [41-43]. Consistent with its established role in myeloid biology, our analysis of treatment-naïve human melanoma brain metastasis scRNA-seq data showed that GPR84 is highly upregulated in myeloid cells. Among myeloid populations, GPR84 expression was highest in activated microglia and was also enriched in infiltrating monocyte-derived TAMs and antigen-presenting TAMs, whereas resident-like macrophages showed substantially lower GPR84 expression. This distribution suggests that GPR84 does not simply reflect total macrophage abundance or a single fixed macrophage polarization state; instead, it is preferentially associated with activated and inflammatory myeloid populations. Accordingly, GPR84-PET signal may reflect the abundance of GPR84-expressing activated myeloid cell populations rather than the total TAMC burden alone.
Complementary analyses in our murine intracranial melanoma implant model supported this interpretation. Spatial multiomic profiling localized Gpr84 mRNA expression to CD11b+Iba1+F4/80+ myeloid cells, while flow cytometry demonstrated that combined anti-PD-1 and anti-CTLA-4 therapy markedly reduced the abundance of GPR84-expressing tumor-associated myeloid cells, without reducing the proportion of GPR84+ cells in either resident microglia or infiltrating macrophage populations. Thus, the treatment-associated decrease in Gpr84 expression and PET signal likely reflects, at least in part, a reduction in the abundance of GPR84-expressing myeloid cells rather than downregulation of GPR84 within individual cells. These results complement our prior work using the same anti-PD-1/anti-CTLA-4 treatment regimen in this intracranial melanoma model, in which ICOS-immunoPET demonstrated treatment-associated T cell activation at a later imaging time point (day 14 after intracranial tumor implantation) [38]. In the present study, we performed GPR84-PET on day 9, providing an earlier readout of treatment-associated changes in the tumor-associated myeloid compartment. Together, these studies show the potential for molecular imaging of innate and adaptive immune responses at different time points to characterize the evolving response to immune checkpoint blockade. Importantly, our evaluation of human brain metastases from lung and prostate cancers further demonstrated the specificity of GPR84 as a biomarker of myeloid cells in this context. These findings support GPR84-PET as a clinically translatable approach for understanding myeloid cell biology in human brain metastases of different primary origins.
We evaluated two CNS-penetrant PET radiotracers for GPR84: [11C]MGX-38 and [18F]MGX-110S. Both tracers enabled sensitive and specific in vivo detection of GPR84-associated signal. Notably, [18F]MGX-110S demonstrated rapid brain uptake followed by washout from healthy brain tissue, resulting in low background signal and superior tumor-to-brain contrast compared with [11C]MGX-38 (5.43-fold vs. 1.74-fold). Although tracer binding within tumor regions was greater with [11C]MGX-38, its lipophilicity (cLogP 2.076 vs. 0.188 for [18F]MGX-110S) may contribute to greater nonspecific retention in normal brain. The superior imaging contrast of [18F]MGX-110S, along with the longer half-life (~110 min) and the well-established clinical utility and infrastructure for 18F-labeled radiopharmaceuticals, led us to select [18F]MGX-110S as the lead candidate for clinical translation. The tumor-to-normal brain ratio for [11C]MGX-38 is comparable to that reported for [18F]FDG (~1-2) [44], whereas [18F]MGX-110S achieved ratios exceeding even amino acid PET tracers such as [18F]FDOPA and [18F]FET (~2-4) [45,46], further supporting its potential for high-contrast CNS imaging. Ex vivo autoradiography of perfused murine brain tumor sections also confirmed specific tracer binding by eliminating intravascular and unbound radioactivity.
Moreover, in vitro autoradiography of human brain metastasis tissue showed strong tracer binding in CD163+ and GPR84+ myeloid cells, supporting the translational potential of GPR84-PET for quantifying activated tumor-associated myeloid populations in patients. This cellular specificity distinguishes GPR84-PET from metabolic imaging with [18F]FDG, where signal can arise from metabolically active components of the TME such as tumor cells and activated myeloid cells. Consequently, changes in FDG uptake cannot readily be attributed to changes in tumor burden versus immune cell infiltration or activation. By selectively imaging GPR84-expressing myeloid cells, GPR84-PET could help delineate the spatial pattern and burden of activated myeloid cells and distinguish treatment-associated myeloid remodeling from changes in tumor cell metabolism. Importantly, further protein-level characterization of GPR84 in human brain metastases of diverse primary origins will be an important step toward clinical translation. Our human scRNA-seq reanalysis and preclinical flow cytometry data indicate that multiple myeloid cell subsets may contribute to the GPR84-PET signal. Defining their relative contributions in human brain metastases will help establish the cellular basis of in vivo GPR84-PET signal and strengthen interpretation of patient imaging data.
Contrast-enhanced MRI is the current clinical standard for diagnosing and assessing therapeutic response in malignant brain tumors. However, conventional MRI does not directly capture molecular changes in the TME. Treatment-related changes can also increase enhancement or apparent lesion size, making pseudoprogression difficult to distinguish from true progression. As therapies increasingly target the TME, molecular imaging tools that can resolve specific cellular populations in vivo are critically needed. By providing a myeloid-specific signal complementary to anatomical MRI and metabolic imaging, GPR84-PET could help distinguish treatment-associated changes in activated myeloid cell burden from changes in tumor burden, thereby improving interpretation of therapeutic response.
To date, TSPO-PET tracers remain the most widely assessed tools for imaging myeloid cells in clinical research. However, as evident in our human melanoma brain metastasis scRNA-seq reanalysis, TSPO is broadly expressed across multiple cell types, including myeloid cells, tumor cells, astrocytes, and endothelial cells, limiting its cellular specificity in the TME. Other approaches targeting myeloid markers such as CD11b or CSF1R have shown promise in preclinical models. Antibody-based CD11b tracers, including [89Zr]DFO-anti-CD11b and [64Cu]αCD11b, enable visualization of myeloid infiltration but rely on large biologic constructs that do not readily cross the BBB [18,47]. Similarly, CSF1R-targeted tracers such as [11C]CPPC and [11C]BLZ945 bind to microglia and macrophages; however, CSF1R is not entirely restricted to myeloid populations, and thus these tracers also bind to other cell types. Additionally, these reported CSF1R tracers exhibit high nonspecific binding in the brain [15,48]. In contrast, GPR84 is a target with many small molecule binders and is specifically expressed by activated myeloid cells and minimally expressed in healthy brain tissue, providing a potential basis for CNS imaging with improved cellular specificity. The clinical need for such specificity is particularly evident in neuro-oncology, where imaging plays a critical role in distinguishing treatment-related effects from true tumor progression. For example, amino acid PET tracers such as [18F]FET have demonstrated strong diagnostic performance in differentiating pseudoprogression from true progression [49], reflecting increased amino acid transport and metabolic activity in tumor cells. However, FET uptake is not entirely tumor-specific and can be influenced by inflammatory processes within the TME [50]. In this context, GPR84-PET could complement FET-PET and more accurately distinguish treatment-related inflammatory changes from true tumor progression.
Several limitations of our study warrant consideration. First, our in vivo studies were performed in a single murine intracranial melanoma implant model. While this model enables controlled evaluation of melanoma growth within the brain parenchyma, it does not recapitulate the full biology of spontaneous metastatic dissemination to the brain or the full diversity of tumor and myeloid cell states observed across human brain metastases. Second, the functional role of GPR84 varies across tumor types and inflammatory contexts [40]. As a result, changes in GPR84-PET signal must be interpreted carefully in specific disease and treatment settings. Our human brain metastasis analyses were also limited to a very small number of patient samples, and validation in larger cohorts will be important to capture interpatient, treatment-associated, and intertumoral heterogeneity in GPR84 expression. Although our data support GPR84 as a myeloid cell-specific imaging biomarker, our scRNA-seq reanalysis and preclinical flow cytometry data indicate that multiple myeloid subsets may contribute to the PET signal. Future studies using techniques such as radioFlow [51] could help delineate the relative contribution of individual myeloid subsets to the observed signal. Additional validation in larger, more diverse clinical cohorts will also be important to establish the cellular basis of in vivo PET signal and its generalizability across patients and tumor types. Finally, stereotaxic intracranial injection may compromise the BBB and permit passive tracer accumulation in tumor regions, while small tumors may also introduce partial volume effects on PET images. We mitigated these issues by performing gamma counting and autoradiography on mice following perfusion, which limit contributions from blood and eliminate PET spillover and partial volume effects. Although these ex vivo analyses and in vivo blocking support specific binding of both GPR84-PET tracers, validation in GPR84-knockout mice would further confirm tracer specificity. Kinetic modeling and imaging studies in nonhuman primates will also help characterize tracer kinetics, BBB permeability, and CNS specificity prior to clinical translation.
In conclusion, we identify GPR84 as a promising PET biomarker for detecting activated TAMCs in brain metastases and report the preclinical and translational evaluation of CNS-penetrant GPR84 radiotracers. In this work, we identified [18F]MGX-110S as the lead candidate for clinical translation based on its superior tumor-to-brain contrast and the favorable translational properties of fluorine-18. This study sets the foundation for the clinical translation of GPR84-PET as a noninvasive approach to complement conventional MRI and longitudinally monitor myeloid remodeling after immunotherapy, with potential to provide a more informed assessment of treatment response in patients with brain metastases.
Abbreviations
AAALAC: Association for the Assessment and Accreditation of Laboratory Animal Care; ANOVA: analysis of variance; ATCC: American Type Culture Collection; BBB: blood-brain barrier; CNS: central nervous system; CT: computed tomography; CTLA-4: cytotoxic T lymphocyte-associated protein 4; DMEM: Dulbecco’s Modified Eagle Medium; EC: extracranial; EC: extracranial; FBS: fetal bovine serum; FFPE: formalin-fixed paraffin-embedded; FITC: fluorescein isothiocyanate; GFAP: glial fibrillary acidic protein; GPCR: G protein-coupled receptor; GPR84: G protein-coupled receptor 84; H&E: hematoxylin and eosin; HPLC: high-performance liquid chromatography; IC: intracranial; ICI: immune checkpoint inhibitor; IHC: immunohistochemistry; IRB: Institutional Review Board; IVIS: In Vivo Imaging System; LPS: lipopolysaccharide; MIP: maximum intensity projection; MRI: magnetic resonance imaging; MSC: mesenchymal stromal cell; MSB: Multistaining Buffer; NK: natural killer; NSCLC: non-small cell lung cancer; OCT: optimal cutting temperature; PCA: principal component analysis; PBS: phosphate-buffered saline; PD-1: programmed cell death protein 1; PD-L1: programmed death-ligand 1; PET: positron emission tomography; qPCR: quantitative polymerase chain reaction; RARE: rapid acquisition with relaxation enhancement; ROI: region of interest; scRNA-seq: single-cell RNA sequencing; SD: standard deviation; seqIF: sequential immunofluorescence; TAM: tumor-associated macrophage; TAMC: tumor-associated myeloid cell; TME: tumor microenvironment; TSPO: 18-kDa translocator protein; t-SNE: t-distributed stochastic neighbor embedding; Tx: therapy; veh: vehicle; vSMC: vascular smooth muscle cell.
Supplementary Material
Supplementary figures and tables.

Acknowledgements
We gratefully acknowledge Dr. Emily Becker for her assistance with manuscript preparation; Drs. Laura Pisani and Frezghi Habte (Stanford Center for Innovation in In Vivo Imaging) for their support with the imaging studies; Drs. Emily Martersteck, Amy Jablonski, and Jeffrey Santoso for their contributions to spatial biology panel design and image analysis, and Colin Molloy and Margaret Nilsen for their support with the GPR84-knockout LPS studies. ChatGPT (OpenAI, San Francisco, CA, USA) was used solely to assist with language editing and to improve the clarity and flow of the manuscript. We used no AI tools for data collection, analysis, or image generation. The authors reviewed and further edited all AI-assisted edits and take full responsibility for the accuracy and integrity of the manuscript.
Funding
This project was supported by funding from NIH/NINDS U54 CA261717 (to M.H.G., M.L., M.L.J.), NIH/NIA F31 AG094229 (to R.C.K.), NSF GRFP DGE-2146755 (to R.C.K.), and Biotechnology and Biological Sciences Research Council App72799 (to G.M.).
Author contributions
R.C.K. designed and implemented the study, led data acquisition and analysis, prepared all figures and tables, and wrote the original manuscript. S.T.R., P.M., S.C.N., A.S., S.K., G.T., I.S.A., S.A., and J.B.A. helped with data acquisition. M.K. and B.Z. synthesized radiotracers. R.V. and A.E. prepared the animal model. P.M.A. and G.G. supervised spatial biology experiments. M.H.G. provided guidance on human tissue studies and data interpretation. P.C. and H.V. provided guidance on IHC staining and human tissue data interpretation. G.M. and M.L. conceptualized and designed the study. M.L.J. designed the study, assisted with data interpretation, and edited the original manuscript. All authors reviewed and approved the final manuscript.
Data availability
The publicly available scRNA-seq data reanalyzed in this study were obtained from the NCBI Gene Expression Omnibus under accession number GSE200218. All other data associated with this study are present in the paper or the Supplementary Materials.
Competing Interests
S.A., J.B.A., and P.M.A. are employed by Lunaphore Technologies.
References
1. Berghoff AS, Schur S, Füreder LM. et al. Descriptive statistical analysis of a real life cohort of 2419 patients with brain metastases of solid cancers. ESMO Open. 2016;1:e000024
2. Tawbi HA, Forsyth PA, Algazi A. et al. Combined Nivolumab and Ipilimumab in Melanoma Metastatic to the Brain. N Engl J Med. 2018;379:722-30
3. Quail DF, Joyce JA. The Microenvironmental Landscape of Brain Tumors. Cancer Cell. 2017;31:326-41
4. Mirzaei R, Yong VW. Microglia-T cell conversations in brain cancer progression. Trends Mol Med. 2022;28:951-63
5. Fischer GM, Jalali A, Kircher DA. et al. Molecular Profiling Reveals Unique Immune and Metabolic Features of Melanoma Brain Metastases. Cancer Discov. 2019;9:628-45
6. Pan Y, Yu Y, Wang X, Zhang T. Tumor-Associated Macrophages in Tumor Immunity. Front Immunol. 2020;11:583084
7. Solito S, Pinton L, Mandruzzato S. In Brief: Myeloid-derived suppressor cells in cancer. J Pathol. 2017;242:7-9
8. Yang Z, Guo J, Weng L, Tang W, Jin S, Ma W. Myeloid-derived suppressor cells-new and exciting players in lung cancer. J Hematol Oncol. 2020;13:10
9. Lee D, Riestenberg RA, Haskell-Mendoza A, Bloch O. Brain Metastasis Recurrence Versus Radiation Necrosis: Evaluation and Treatment. Neurosurg Clin N Am. 2020;31:575-87
10. Ramanathan RK, Korn RL, Raghunand N. et al. Correlation between Ferumoxytol Uptake in Tumor Lesions by MRI and Response to Nanoliposomal Irinotecan in Patients with Advanced Solid Tumors: A Pilot Study. Clin Cancer Res. 2017;23:3638-48
11. Toth GB, Varallyay CG, Horvath A. et al. Current and Potential Imaging Applications of Ferumoxytol for Magnetic Resonance Imaging. Kidney Int. 2017;92:47-66
12. McConnell HL, Schwartz DL, Richardson BE, Woltjer RL, Muldoon LL, Neuwelt EA. Ferumoxytol nanoparticle uptake in brain during acute neuroinflammation is cell-specific. Nanomedicine Nanotechnol Biol Med. 2016;12:1535-42
13. Jain P, Chaney AM, Carlson ML, Jackson IM, Rao A, James ML. Neuroinflammation PET Imaging: Current Opinion and Future Directions. J Nucl Med. 2020;61:1107-12
14. Chen W. Clinical Applications of PET in Brain Tumors. J Nucl Med. 2007;48:1468-81
15. Horti AG, Naik R, Foss CA. et al. PET imaging of microglia by targeting macrophage colony-stimulating factor 1 receptor (CSF1R). Proc Natl Acad Sci. 2019;116:1686-91
16. Zhou W, Yue Q, Yuan Y. et al. Visualization of P2X7 Receptors in Living Human Gliomas: An 18F-GSK1482160 PET Imaging and Neuropathology Study. Clin Cancer Res. 2025;31:2183-95
17. Heo GS, Bajpai G, Li W. et al. Targeted PET Imaging of Chemokine Receptor 2-Positive Monocytes and Macrophages in the Injured Heart. J Nucl Med. 2021;62:111-4
18. Nigam S, McCarl L, Kumar R. et al. Preclinical immunoPET imaging of glioblastoma-infiltrating myeloid cells using Zirconium-89-labeled anti-CD11b antibody. Mol Imaging Biol. 2020;22:685-94
19. Lauwers Y, De Groof TWM, Vincke C. et al. Imaging of tumor-associated macrophage dynamics during immunotherapy using a CD163-specific nanobody-based immunotracer. Proc Natl Acad Sci. 2024;121:e2409668121
20. Zhang X, Heo GS, Li A. et al. Development of a CD163-Targeted PET Radiotracer That Images Resident Macrophages in Atherosclerosis. J Nucl Med. 2024;65:775-80
21. Blykers A, Schoonooghe S, Xavier C. et al. PET Imaging of Macrophage Mannose Receptor-Expressing Macrophages in Tumor Stroma Using 18F-Radiolabeled Camelid Single-Domain Antibody Fragments. J Nucl Med Off Publ Soc Nucl Med. 2015;56:1265-71
22. Guzik P, Fang H-Y, Deberle LM. et al. Identification of a PET Radiotracer for Imaging of the Folate Receptor-α: A Potential Tool to Select Patients for Targeted Tumor Therapy. J Nucl Med. 2021;62:1475-81
23. Clemente GS, Antunes IF, Kurhade S. et al. Mapping Arginase Expression with 18F-Fluorinated Late-Generation Arginase Inhibitors Derived from Quaternary α-Amino Acids. J Nucl Med Off Publ Soc Nucl Med. 2021;62:1163-70
24. Suzuki M, Takaishi S, Nagasaki M. et al. Medium-chain Fatty Acid-sensing Receptor, GPR84, Is a Proinflammatory Receptor. J Biol Chem. 2013;288:10684-91
25. Zhang X, Wang Y, Supekar S. et al. Pro-phagocytic function and structural basis of GPR84 signaling. Nat Commun. 2023;14:5706
26. Deng Z, Wang J, Xu B. et al. Mining TCGA Database for Tumor Microenvironment-Related Genes of Prognostic Value in Hepatocellular Carcinoma. BioMed Res Int. 2019;2019:2408348
27. Cui D, Yuan W, Chen C, Han R. Identification of colorectal cancer-associated macrophage biomarkers by integrated bioinformatic analysis. Int J Clin Exp Pathol. 2021;14:1-8
28. Ji H, Liu Z, Wang F. et al. Novel macrophage-related gene prognostic index for glioblastoma associated with M2 macrophages and T cell dysfunction. Front Immunol. 2022;13:941556
29. Ye N, Cai J, Dong Y. et al. A multi-omic approach reveals utility of CD45 expression in prognosis and novel target discovery. Front Genet. 2022;13:928328
30. Li X, Yuan C, Yang B. et al. Caprylic Acid (FFA C8:0) promotes the progression of prostate cancer by up-regulating G protein-coupled receptor 84/ Krüppel-like factor 7. BMC Cancer. 2023;23:426
31. Qin G, Liu S, Liu J. et al. Overcoming resistance to immunotherapy by targeting GPR84 in myeloid-derived suppressor cells. Signal Transduct Target Ther. 2023;8:1-15
32. Reyes S, Kalita M, Kuo R. et al. Illuminating pro-inflammatory myeloid cells in a murine model of multiple sclerosis using a new 18F-labeled GPR84-targeted radiotracer. J Nucl Med. 2024;65:242311-242311
33. Kalita M, Kuo RC, Straniero V. et al. Illuminating proinflammatory myeloid cells with PET tracers targeting GPR84. Proc Natl Acad Sci. 2026;123:e2536372123
34. Biermann J, Melms JC, Amin AD. et al. Dissecting the treatment-naïve ecosystem of human melanoma brain metastasis. Cell. 2022;185:2591-2608.e30
35. Rivest F, Eroglu D, Pelz B. et al. Fully automated sequential immunofluorescence (seqIF) for hyperplex spatial proteomics. Sci Rep. 2023;13:16994
36. Jackson IM. Development of novel CNS PET radiotracers for shedding light on neuroinflammation. Stanford University. 2025 Available at: https://searchworks.stanford.edu/view/in00000451272
37. Taggart D, Andreou T, Scott KJ. et al. Anti-PD-1/anti-CTLA-4 efficacy in melanoma brain metastases depends on extracranial disease and augmentation of CD8+ T cell trafficking. Proc Natl Acad Sci U S A. 2018;115:E1540-9
38. Kuo RC, Verma R, Nagy SC. et al. ICOS-ImmunoPET Monitors T Cell Activation After Combination Immune Checkpoint Blockade in a Mouse Model of Melanoma Brain Metastasis. Adv Sci. 2026;13:e76803
39. Navikas V, Kowal J, Rodriguez D. et al. Semi-automated approaches for interrogating spatial heterogeneity of tissue samples. Sci Rep. 2024;14:5025
40. Xue B, Xiao Y, Hu W, Zhou F, Zhang B, Zhang Y. Small-molecule drug discovery targeting the orphan G protein-coupled receptor GPR84 as potential therapeutics. Eur J Med Chem. 2026;305:118561
41. Liu J, Liu J, Qin G. et al. MDSCs-derived GPR84 induces CD8+ T-cell senescence via p53 activation to suppress the antitumor response. J Immunother Cancer. 2023;11:e007802
42. Li J, Ma A, Zhang R. et al. Targeting metabolic sensing switch GPR84 on macrophages for cancer immunotherapy. Cancer Immunol Immunother CII. 2024;73:52
43. Philbrook P, Dean MJ, Sanchez-Pino MD. et al. Medium-Chain Fatty Acid Receptor GPR84 Modulates Cytotoxic CD8 T-cell Antitumor Immunity through Metabolic Reprogramming. Cancer Immunol Res. 2026;14:640-57
44. Binneboese A, Covington MF, Horn KP. et al. Correlation between FDG-PET uptake and survival in patients with primary brain tumors. Am J Nucl Med Mol Imaging. 2021;11:196-206
45. Fuenfgeld B, Mächler P, Fischer DR. et al. Reference values of physiological 18F-FET uptake: Implications for brain tumor discrimination. PLOS ONE. 2020;15:e0230618
46. Somme F, Bender L, Namer IJ, Noël G, Bund C. Usefulness of 18F-FDOPA PET for the management of primary brain tumors: a systematic review of the literature. Cancer Imaging. 2020;20:70
47. Cao Q, Huang Q, Mohan C, Li C. Small-Animal PET/CT Imaging of Local and Systemic Immune Response Using 64Cu-αCD11b. J Nucl Med Off Publ Soc Nucl Med. 2019;60:1317-24
48. van der Wildt B, Miao Z, Reyes ST. et al. BLZ945 derivatives for PET imaging of colony stimulating factor-1 receptors in the brain. Nucl Med Biol. 2021;100-101:44-51
49. Akhoundova D, Hiltbrunner S, Mader C. et al. 18F-FET PET for Diagnosis of Pseudoprogression of Brain Metastases in Patients With Non-Small Cell Lung Cancer. Clin Nucl Med. 2020;45:113-7
50. Hutterer M, Nowosielski M, Putzer D. et al. [18F]-fluoro-ethyl-l-tyrosine PET: a valuable diagnostic tool in neuro-oncology, but not all that glitters is glioma. Neuro-Oncol. 2013;15:341-51
51. Vraka C, Homolya M, Özer Ö. et al. RadioFlow Cytometry Reveals That [18F]FDG Uptake in K-RAS Lung Cancer Is Driven by Immune Cells: An Analysis on a Single-Cell Level. J Nucl Med. 2025;66:215-22
Author contact
Corresponding author: Michelle L. James, 3172 Porter Drive, Room 273, Palo Alto, CA 94304; E-mail: mljamesedu.