Impact Factor
- Issue 14; 2026
- Issue 13; 2026
- Issue 12; 2026
- Issue 11; 2026
- Issue 10; 2026
- Volume 16; 2026
- Advance Articles
- Past Issues
- Cover Images
- Cover Suggestion
- Index & Coverage
- Special Issues
Introduction
Results
Discussion
Material and Methods
Abbreviations
Supplementary Material
Acknowledgements
References
International Journal of Biological Sciences
International Journal of Medical Sciences
 Global reach, higher impact

Theranostics 2018; 8(5):1376-1388. doi:10.7150/thno.22717 This issue Cite
Research Paper
Cancer-associated fibroblasts enhance tumor 18F-FDG uptake and contribute to the intratumor heterogeneity of PET-CT
Chengfang Shangguan1,#, Guifang Gan2,#, Jieying Zhang2,#, Jinliang Wu2, Ying Miao1, Miao Zhang1, Biao Li1, ![]() , Jun Mi2,
, Jun Mi2, ![]()
1. Department of Nuclear Medicine & Department of Oncology, Rui Jin Hospital, Shanghai Jiao Tong University School of Medicine
2. Department of Biochemistry and Molecular Cell Biology; Key Laboratory of Cell Differentiation and Apoptosis of Chinese Ministry of Education, Shanghai Jiao Tong University School of Medicine
# these authors equally contribute to this paper
Received 2017-9-6; Accepted 2017-12-5; Published 2018-2-2
Abstract

Purpose: Elevated glucose uptake is a hallmark of cancer. Fluorodeoxyglucose (FDG) uptake was believed to indicate the aggressiveness of tumors and the standardized uptake value (SUV) is a well-known measurement for FDG uptake in positron emission tomography-computed tomography (PET/CT). However, the SUV is variable due to the heterogeneity of tumors. Methods: 126 patients with colorectal cancer underwent 18F-FDG PET/CT scanning before surgery between Jan 2011 and April 2016. Cancer-associated fibroblast (CAF) densities were calculated with the inForm Advanced image analysis software and were comparatively analyzed between patients with high and low maximum SUV (SUVmax-high and SUVmax-low). Glucose uptake was evaluated in induced and isolated CAFs and CAF-cocultured colon cancer HCT116 cells. Moreover, micro-PET/CT was performed on xenografted tumors and autoradiography was performed in the AOM/DSS induced colon cancer model. Results: CAFs were glycolytic, evidenced by glucose uptake and upregulated HK2 expression. Compared to non-activated fibroblasts (NAFs), CAFs were more dependent on glucose and sensitive to a glycolysis inhibitor. CAFs increased the SUVmax in xenograft tumors and spontaneous colon cancers. Moreover, multivariate analysis revealed that the SUVmax was only associated with tumor size among conventional parameters in colon cancer patients (126 cases, p = 0.009). Besides tumor size, the CAF density was the critical factor associated with SUVmax and outcome, which was 2.27 ± 0.74 and 1.68 ± 0.45 in the SUVmax-high and the SUVmax-low groups, respectively (p = 0.014). Conclusion: CAFs promote tumor progression and increase SUVmax of 18F-FDG, suggesting CAFs lead to the intratumor heterogeneity of the SUV and the SUVmax is a prognostic marker for cancer patients.
Keywords: Cancer associated fibroblast, PET/CT, SUVmax, intratumor heterogeneity
Introduction
Metabolic reprogramming is a hallmark of cancer and glucose uptake is dramatically elevated in most tumor cells, if not all. 2-deoxy-2-[18F] glucose (18F-FDG) is an analog of glucose with the positron-emitting radionuclide fluorine-18 substituting for the normal hydroxyl group at the C-2 position in the glucose molecule. 18F-FDG is applied in the medical imaging modality positron emission tomography (PET) and is used as a nontoxic tracer for neuroimaging and cancer diagnosis [1].
Positron emission tomography-computed tomography (PET/CT) is an important method for malignant tumor diagnosis and staging, and is also a useful tool for monitoring tumor response to therapy [2-4]. The standardized uptake value (SUV) is a well-known measurement for 18F-FDG uptake in PET-CT imaging. The SUV provides a semi-quantitative analysis and description of the radio-activity in a lesion [5]. The 18F-FDG uptake is generally represented by two parameters, SUVmean and SUVmax. SUVmean represents the mean value of the SUVs within the selected region of interest in the trans-axial PET image, while SUVmax is the largest value among the SUVs in the selected region of interest.
The SUV was believed to indicate the aggressiveness of tumors [6-8]. Clinical studies showed that the SUV could be used as a prognosis marker for multiple cancers, such as nasopharyngeal carcinoma, hepatocellular carcinoma, NSCLC, gastric cancer and colorectal cancer [8-12]. However, a meta-analysis of the prognostic value of pretreatment SUVmean in patients with gastric cancer found that the pooled hazard ratio (HR) for overall survival (OS) of six studies including 672 patients was 1.34 (95% CI, 0.69-2.60, p = 0.39) [11], suggesting the SUVmean might not be a perfect prognostic marker for cancer patients due to the intratumoral heterogeneity of SUVs.
Glucose metabolism is regulated by multiple factors including glycolysis-related molecules and oncoproteins. Glucose uptake depends on glucose transporters, which are located on the cytoplasmic membrane. The glucose transporter 1 (GLUT1) is commonly expressed in all tissues [13, 14] and is overexpressed in tumor cells. The hexokinase 2 (HK2) converts glucose into glucose-6-phosphate and is also overproduced in various malignant cells [15]. Nevertheless, the expressions of both GLUT1 and HK2 were reported to be regulated by hypoxia-inducible factor 1 (HIF1), p53 and RAS signaling [16, 17]. Clinical observations have also shown that 18F-FDG uptake was closely correlated with the expression levels of GLUT1, HK2 and HIF1 in many malignant tumors including breast cancer [18], thymic epithelial tumor [16], extrahepatic bile duct (EHD) cancer [19], hepatocellular carcinoma [20], gastric cancer [21] and colorectal cancer [17].
In addition, tumor is a pathological complex comprised of tumor cells, stromal cells, and tumor stromal cells. Tumor stromal cells include cancer-associated fibroblasts (CAFs), endothelial cells, pericytes and inflammation cells, and comprise about half of the cell population in tumors. Among them, CAF is a major component. It has been reported that CAFs are significantly correlated with poor survival. The Toi group showed that tumor cells combined with Cav1 (-) stromal cells was significantly correlated with unfavorable prognostic outcomes in primary breast cancer (p < 0.001). Multivariate analysis demonstrated that this combined status is an independent prognostic factor (p = 0.002) [22]. Moreover, CAFs in oral cancers and esophageal adenocarcinomas were strongly associated with poor outcome regardless of disease stage [23, 24]. Recent studies showed that FDG uptake might also be increased in non-cancerous stromal cells in tumors [25, 26]. To distinguish this metabolic change from tumor cells, the concept of the reverse Warburg effect was proposed by Lisanti's group [27, 28]. However, it is not very clear whether CAFs increase the SUV and lead to heterogeneity of FDG uptake in tumors.
Recent data showed that glucose uptake is dramatically increased in CAFs to generate more lactate and ketone bodies to fuel adjacent cancer cells for cancer growth [29] and metastasis [30-32], suggesting that CAFs may influence 18F-FDG uptake in PET/CT imaging. In this study, we assessed the 18F-FDG uptake in CAFs and analyzed the association of CAF population with 18F-FDG uptake in colon cancer. Collectively, our data demonstrates that CAFs are an important cell population closely associated with the SUVmax, which is a useful indicator for prognosis.
Results
CAFs enhance 18F-FDG uptake in patient tumors and is associated with poor prognosis
To investigate which clinicopathologic factor influences tumor glucose uptake in the clinic, multiple logistic regression analysis was performed. A retrospective study was executed on the clinical data of 126 cases of colorectal cancer who were examined by 18F-FDG PET/CT before curative or palliative surgery. The correlation between various characteristics and the SUVmax are listed in Table 1. As shown in Table 1, there was no correlation between the SUVmax and gender, age, tumor location, differentiation or clinical staging. Only the tumor size was found to be positively associated with SUVmax. When the tumor size was ≥5 cm, the corresponding SUVmax was 16.48 ± 6.86 (mean ± SD). In contrast, when the tumor size was <5 cm, the corresponding SUVmax was 12.15 ± 4.17. The difference between the two groups was significant (p = 0.0001). In the multiple logistic regression analysis, tumor size was also a significant factor adjusted by gender, age, tumor location, differentiation or clinical staging (p = 0.009, OR (95%CI) = 3.067 (1.316-7.146)).
Analysis of multiple factors associated with PET SUVmax
| Variables | N(%) | SUVmax | P value |
|---|---|---|---|
| Gender | 0.216 | ||
| Male | 85(67.5) | 14.65±5.61 | |
| Female | 41(32.5) | 13.52±6.86 | |
| Age | 0.379 | ||
| ≥60 years | 47(37.3) | 14.95±7.01 | |
| <60 years | 79(62.7) | 13.89±5.32 | |
| Tumor Location | 0.792 | ||
| Proximal colon | 48(38.1) | 14.59±6.17 | |
| Distal colon | 48(38.1) | 14.38±6.30 | |
| rectum | 30(23.8) | 13.64±5.53 | |
| Differentiation | 0.488 | ||
| good | 2(1.6) | 9.45±3.32 | |
| moderate | 70(55.5) | 14.54±6.42 | |
| poor | 54(42.9) | 14.12±5.58 | |
| Clinical Staging | 0.222 | ||
| I | 7(5.6) | 9.93±3.47 | |
| II | 36(28.6) | 14.95±7.11 | |
| III | 32(25.4) | 13.89±5.41 | |
| IV | 51(40.4) | 14.65±5.75 | |
| T staging | 0.334 | ||
| 1 | 3(2.4) | 8.90±1.91 | |
| 2 | 6(4.7) | 12.32±3.84 | |
| 3 | 39(31.0) | 14.90±7.28 | |
| 4 | 78(61.9) | 14.33±5.51 | |
| N staging | 0.581 | ||
| Negative(N0) | 53(42.1) | 14.64±6.86 | |
| Positive(N1-3) | 73(57.9) | 14.02±5.40 | |
| M staging | 0.546 | ||
| Negative(M0) | 75(59.5) | 14.03±6.25 | |
| Positive(M1) | 51(40.5) | 14.65±5.75 | |
| Tumor Size | 0.0001* | ||
| <5cm | 64(50.8) | 12.15±4.17 | |
| ≥5cm | 62(49.2) | 16.48±6.86 |
Note: 126 colorectal cancer patients were analyzed. *: P < 0.05
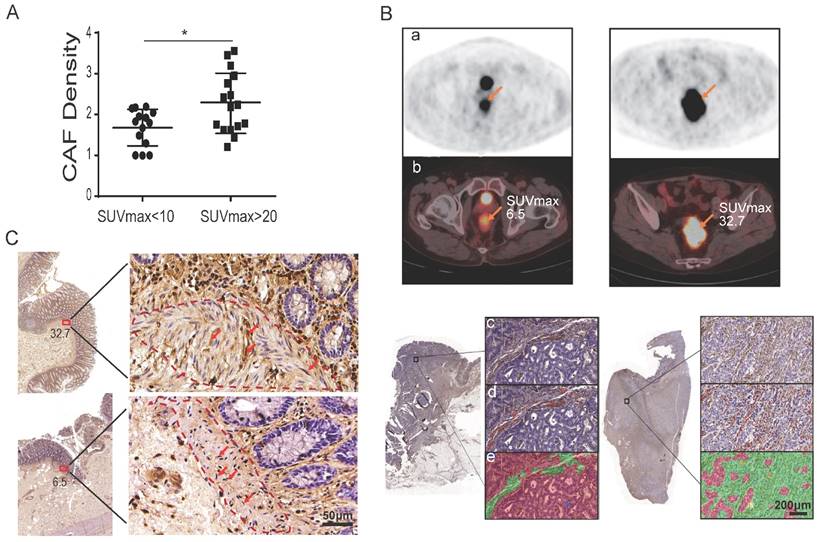
To further investigate whether CAFs influence tumor glucose uptake, patients were divided into two groups by their SUVmax of 18F-FDG: 16 patients were in the SUVmax-high group with SUVmax > 20, while 14 patients were in the SUVmax-low group with SUVmax < 10 (Table 2). The two groups were well balanced for other clinicopathologic factors (Table 2). CAFs were detected by immunohistochemistry (IHC) staining of fibroblast-specific protein 1 (FSP1) on all 30 tumor specimens. Utilizing the inForm Tissue Finder software, the density of CAF was calculated as the number of FSP1-positive fibroblasts divided by the total tissue area per slice. As shown in Figure 1A and Table 2, the CAF density was significantly higher in the SUVmax-high group compared to the SUVmax-low group: the CAF density was 2.27 ± 0.74 and 1.68 ± 0.45, respectively. The difference between the two groups was significant (p = 0.014) (Figure 1A). Figure 1B and Figure S1 show representative PET-CT images and IHC images with/without CAFs labeled. CAFs were also detected by IHC of FSP1 at the surgical incisal margins, which were more than 5 cm away from the tumor lesion. As shown in Figure 1C, CAFs were enriched at the incisal margins of SUVmax-high clinical colon cancers, but were rare at the incisal margins of SUVmax-low samples. These results suggested that CAFs are closely associated with high SUVmax in colon cancers.
Analysis of multiple factors associated with PET SUVmax
| SUVmax<10 | SUVmax>20 | P value | |
|---|---|---|---|
| Gender(N) | 0.765 | ||
| Male | 8 | 10 | |
| Female | 6 | 6 | |
| Age(N) | 0.261 | ||
| ≥60 years | 9 | 7 | |
| <60 years | 5 | 9 | |
| Differentiation(N) | 0.553 | ||
| good | 0 | 1 | |
| moderate | 8 | 10 | |
| poor | 6 | 5 | |
| Clinical Staging(N) | 0.724 | ||
| I | 2 | 1 | |
| II | 2 | 4 | |
| III | 3 | 2 | |
| IV | 7 | 9 | |
| T staging(N) | 0.195 | ||
| 1 | 0 | 1 | |
| 2 | 2 | 0 | |
| 3 | 5 | 3 | |
| 4 | 7 | 12 | |
| N staging(N) | 0.143 | ||
| Negative(N0) | 5 | 10 | |
| Positive(N1-3) | 9 | 6 | |
| M staging(N) | 0.732 | ||
| Negative(M0) | 7 | 7 | |
| Positive(M1) | 7 | 9 | |
| Size(cm)/Mean±SD | 5.39 ± 3.68 | 5.52 ± 2.03 | 0.911 |
| CAF density/Mean±SD | 1.68 ± 0.45 | 2.27 ± 0.74 | 0.014* |
Note: 30 colorectal cancer patients were analyzed. The values of size and CAF density are Mean ± SD, *: P < 0.05.
CAFs enhance tumor glucose uptake in patients. A) The density of CAFs in the SUVmax-high group was significantly higher than that of the SUVmax-low group. B) Representative images of PET, PET/CT and IHC of FSP1. a: PET images; b: PET images merged with CT images; c: IHC images; d: CAFs labeled in IHC images; e: calculated regions (green) recognized by the inForm software. C) CAF detection at the surgical incisal margin. CAFs were enriched at the incisal margins of SUVmax-high colon cancers, but were rare at the incisal margins of SUVmax-low samples.
To investigate whether CAFs determine the recurrence of colorectal cancer patients post curative surgery, 14 among the above patients (7 in the SUVmax-high group; 7 in the SUVmax-low group) who underwent a curative surgery were further analyzed for prognosis. With a median of 40.2 months post-surgery follow-up (range, 9-82 months), 3/7 patients in the SUVmax-high group died due to cancer recurrence. In contrast, only 1/7 patients in the SUVmax-low group had pelvic recurrence and none have died yet. Thus, the recurrence rates of the two groups were 43% vs. 14%. The survival rates of the two groups were 57% vs. 100%. These observations suggested that glycolytic CAFs enhance the SUVmax of 18F-FDG PET, and correlate with poor prognosis.
CAFs are prone to glycolysis and promote tumor growth
To understand the mechanism by which CAFs enhance 18F-FDG uptake in tumors, glucose metabolism was analyzed in CAFs. Based on our previous experiences that tumor-conditioned media (CM) or specific cytokine PDGF/TGF-β transforms fibroblasts into CAFs [29, 33-35], PDGF-induced CAFs or HCT116 colon cancer cell CM-induced CAFs were first subjected to glycolysis analysis to determine their metabolic alterations, which were further verified in the clinical colon cancer-isolated CAFs.
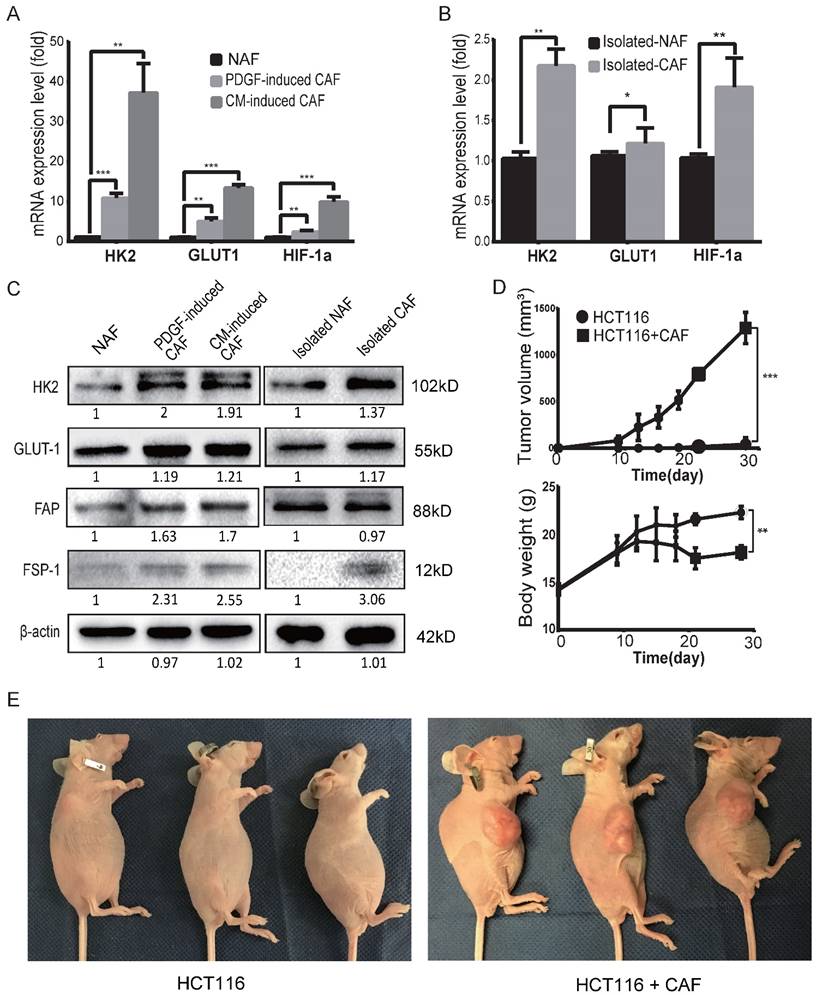
To determine the glycolysis status of CAFs, the mRNA expression levels of glycolysis-related proteins/enzymes were analyzed by qPCR. As shown in Figure 2A, the mRNA expression levels of glycolysis-related genes were increased in both PDGF-induced CAFs and CM-induced CAFs. The upregulated genes include glucose transporter1 (GLUT1), hexokinase 2 (HK2) and hypoxia inducible factor-1α (HIF-1α). The mRNA levels of HK2, GLUT1 and HIF-1α were also increased in clinical colon cancer-isolated CAFs compared to para-colon cancer tissue-isolated non-activated fibroblasts (NAFs) (Figure 2B). Furthermore, the protein levels of GLUT1 and HK2 were also found to be increased in the induced and isolated CAFs compared to NAFs (Figure 2C).
CAFs are prone to glycolysis and promote tumor growth. A) The expression levels of GLUT1, HK2 and HIF-1α were upregulated in induced CAFs. Expression was analyzed by qPCR in non-activated fibroblasts (NAFs) and induced CAFs; CM: HCT116-conditioned medium. **: p < 0.01, ***: p < 0.001. B) The expression levels of GLUT1 and HK2 were upregulated in isolated CAFs. Expression was analyzed by qPCR in isolated NAFs and isolated CAFs. *: p < 0.05, **: p < 0.01. C) Expression analysis of glycolysis-related proteins/enzymes by Western blot. FSP1 and FAP were used as specific markers for CAF. The protein levels of GLUT1 and HK2 were increased in the induced and isolated CAFs compared to NAFs. D) CAFs promoted tumor growth in vivo. *: p < 0.05. E) Representative photos of mice with xenograft tumors. Tumor xenografts were generated by subcutaneous inoculation of colon cancer HCT116 cells or by co-injecting HCT116 with PDGF-induced CAFs (the ratio of CAFs to HCT116 cells was 6:1; the number of HCT116 cells in each injection was 1 × 10⁶.
Next, to investigate the effect of CAFs on tumor cell metabolism, the glycolysis-related enzymes were analyzed in colon cancer HCT116 cells co-cultured with CAF-conditioned medium. As shown in Figure S2, both the mRNA and protein levels of HK2 were reduced in HCT116 cells cocultured with CAF-conditioned medium (Figure S2A,B). Of note, 18F-FDG uptake was also decreased in these HCT116 cells (Figure S2C).
To evaluate the tumor-promoting effects of CAFs, tumor xenografts were generated by subcutaneous inoculation of colon cancer HCT116 cells alone or by co-injecting HCT116 cells with PDGF-induced CAFs as previously described [29, 35-37]. As shown in Figure 2D, CAFs markedly promoted tumor growth in mice and the body weight of mice decreased in the group with CAFs compared to the control. By the end of 4 weeks post-injection, the volumes of tumor xenografts in the CAF group reached 1290 ± 96.52 mm3, while only one of the three mice with HCT116 cells alone formed one small xenograft (Figure 2E). These results demonstrated that CAFs were prone to glycolysis and enhanced tumor growth/formation in vivo.
Glucose uptake is increased in CAFs
To determine the difference in glucose uptake between CAFs and NAFs, 18F-FDG (a common glucose analog in clinic) was applied as a radiotracer. As shown in Figure 3A, the cellular 18F-FDG concentration and the media glucose consumption were increased in both PDGF-induced and HCT116-CM-induced CAFs, which was further confirmed by the data from isolated CAFs (Figure 3B). Moreover, FDG uptake was also analyzed in CAFs mixed with colon cancer HCT116 cells at a ratio of 5:1, and non-induced fibroblasts mixed with HCT116 cells at the same number and ratio served as control. As shown in Figure 3C, the cellular 18F-FDG concentration and medium glucose consumption were also increased in the CAF group. These results suggested that glucose uptake is enhanced in CAFs compared to NAFs, even when co-cultured with cancer cells.
Glucose uptake and consumption are increased in CAFs. A) The cellular 18F-FDG concentration and the media glucose consumption were increased in both PDGF-induced and HCT116-CM-induced CAFs. Fibroblasts were cultured in glucose-free medium with 18F-FDG at a concentration of 1 μCi/mL. B) The cellular 18F-FDG concentration and the media glucose consumption were increased in isolated CAFs C) The cellular 18F-FDG concentration and the media glucose consumption were increased in the mixed populations of colon cancer HCT116 cells with NAFs or induced CAFs. HCT116 cells and fibroblasts for each injection were 3 × 10⁵ and 1.5 × 10⁶. D) The CAFs were more sensitive to a glycolysis inhibitor (3-brodomopyruvate, 3-BrPA) than the NAFs were. The cells were treated for 24 h. E) Representative cell images after 3-BrPA treatment. The fibroblasts were treated with 3-BrPA (50 μM) for 8 h. F) Representative cell images of colon cancer HCT116 cells co-cultured with NAFs or induced CAFs treated with 3-BrPA (50 μM) for 8 h. Red arrows point to fibroblasts, blue arrows point to cancer cells. **: p < 0.01, ***: p < 0.001.
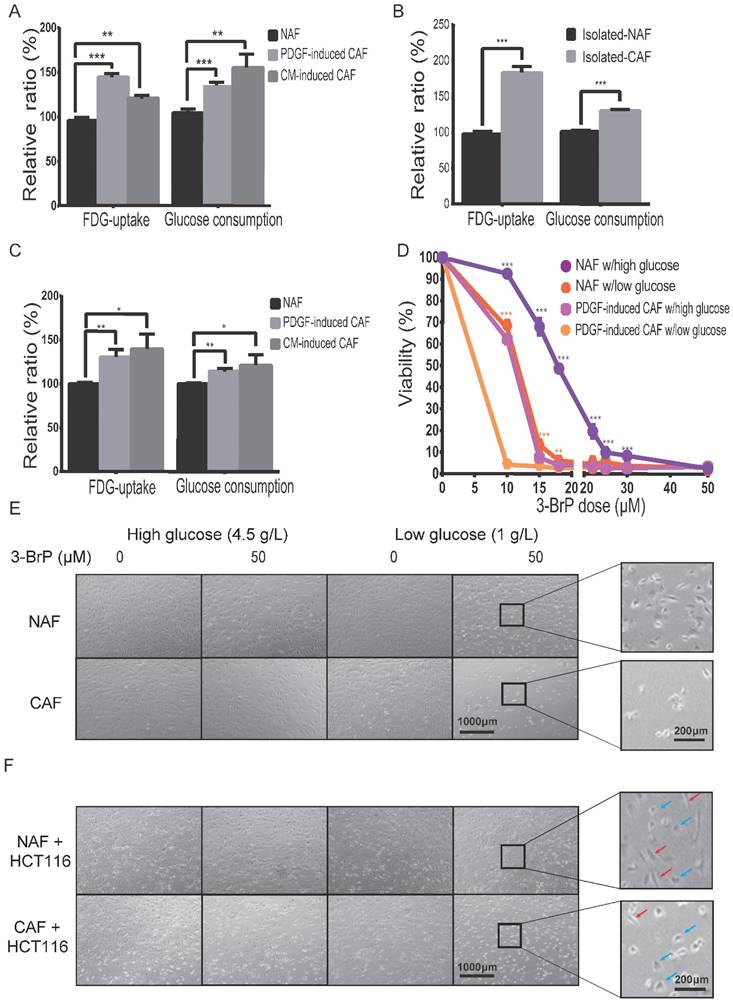
To determine whether CAF viability depends on glucose uptake, cell numbers were counted 24 h after treatment at the indicated dose of hexokinase inhibitor, 3-bromopyruvate (3-BrPA). As shown in Figure 3D,E, the CAFs were more sensitive to 3-BrPA than NAFs, no matter the concentration of glucose. The IC50 values of NAFs and PDGF-induced CAFs to 3-BrPA in high glucose were 12.64 μM and 3.59 μM, respectively. Similarly, the IC50 values of the two cells to 3-BrPA were 4.35 μM and 0.56 μM in low glucose. Moreover, CAFs, but not NAFs, were even more sensitive to 3-BrPA than co-cultured colon cancer HCT116 cells were (Figure 3F). The above data suggested that glucose metabolism is critical for CAF growth.
CAFs enhance 18F-FDG uptake in tumor models
To determine whether CAFs increase glucose uptake in tumors, xenografted tumors were first analyzed by 18F-FDG micro-PET/CT in vivo. To eliminate the effect of tumor size on the SUV of micro-PET, xenografts were generated by subcutaneous inoculation of HCT116 cells (2 × 10⁶) or co-injection of HCT116 cells with NAFs or CAFs at a ratio of 1:3. Tumor xenografts of similar size were analyzed among the HCT116 alone group, the NAF group and the CAF group. As shown in Figure 4A, the tumor volumes (mean ± SD) among the three groups were 506.6 ± 55.2, 469.7 ± 66.3 and 438.2 ± 62.9 mm3, respectively, and the difference among these groups was not significant (p = 0.69). However, the SUVmax of 18F-FDG PET in the CAF group was significantly higher than the other two groups (p < 0.05) (Figure 4B). The SUVmax was 1.417 ± 0.08 (CAF group), compared to 1.067 ± 0.09 (HCT116 group) and 1.067 ± 0.03 (NAF group), respectively. Representative PET images for each group are shown in Figure 4C. Moreover, CAFs were detected by IHC of fibroblast activation protein (FAP) (another specific marker of CAFs) on the cryosections of each compartmental xenograft, and CAFs were only present in the tumors formed by co-injection of HCT116 cells with CAFs (Figure 4D).
CAFs enhance 18F-FDG uptake in tumors. A) Tumor volumes of xenograft tumors. #: p > 0.05. B) 18F-FDG SUVmax of xenograft tumors. The SUVmax of 18F-FDG PET in the CAF group was significantly higher than in the other two groups. #: p > 0.05; *: p < 0.05. C) Representative PET images of xenograft tumors. D) Fibroblasts were detected by FAP IHC staining of xenograft tumors. Tumor xenografts were generated by subcutaneous inoculation of colon cancer HCT116 cells or by co-injecting fibroblasts with HCT116 (the ratio of fibroblasts to HCT116 cells was 3:1; the number of HCT116 cells in each injection as 2 × 10⁶). Fibroblasts in the NAF group were pre-treated by radiation at a dose of 6 Gy. E) Autoradiograph of 18F and CAF detection in an induced colon cancer model. Colon cancers were induced by AOM/DSS. Cryosections were stained by FAP, GLUT1 and HK2 antibody. The 18F-FDG -uptake was higher in the region where CAFs were enriched (e.g., picture at the bottom right vs. the upper right).
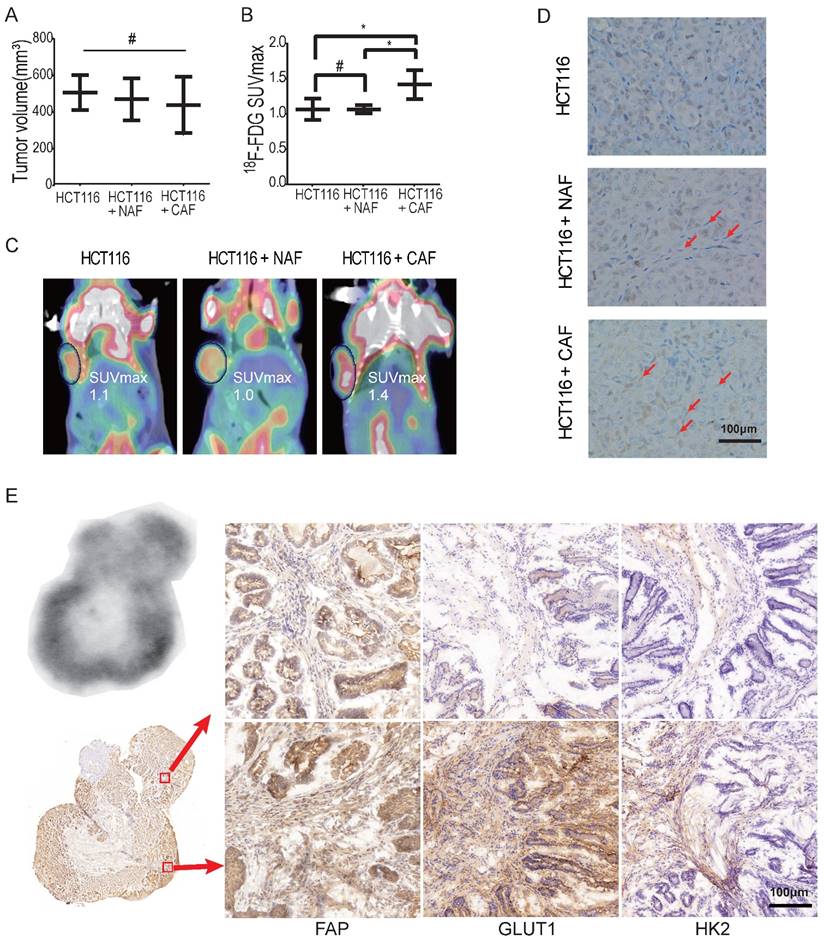
To further determine whether CAFs increase 18F-FDG uptake and the SUVmax, colon cancer was induced by AOM/DSS in C57BL/6 mice (Figure S3). Digital autoradiography (DAR) and IHC were performed on sequential cryosections of the induced colon cancers. As shown in Figure 4E, both 18F-FDG uptake and CAF distribution were heterogeneous and 18F-FDG uptake was higher in the regions where CAFs were enriched (e.g., image at the bottom right vs. the upper right). Moreover, glycolysis-related enzymes GLUT1 and HK2 were upregulated in both cancer cells and CAFs, especially in CAFs in the 18F-FDG high region. These observations suggested that CAFs enhanced glucose uptake in tumors and increased the in vivo SUVmax of micro-PET.
In brief, the above in vitro and animal data demonstrated that CAFs are closely associated with the SUVmax of 18F-FDG micro-PET, suggesting CAFs directly contribute to intratumoral heterogeneity of SUV in tumors.
Discussion
18F-FDG combined with PET is a routinely used clinical tool for cancer detection, staging and therapeutic response monitoring. The variable appearance of tracer uptake on the PET scan depends on the distribution of different tissue components in the tumor. The heterogeneous 18F-FDG uptake within tumors correlates to histopathological patterns. It has been reported that the SUV in PET/CT is affected by tumor properties including tumor size [37, 38], the grade of malignancy [39], histologic tumor type [39-42] and microscopic tumor growth pattern [40, 43]. In addition, angiogenesis is essential for tumor growth and an enhanced microvessel density directly influences nutrient and oxygen supply for tumor cells. VEGF expression level and microvessel density were closely correlated with 18F-FDG uptake, high expression of VEGF, CD31 and CD34, and were significantly associated with poor outcome [16, 17, 44]. However, the major factor affecting 18F-FDG accumulation in tumors is still not clear so far.
The total 18F-FDG uptake in tumors is due to both neoplastic and non-neoplastic components. More than 20 years ago, Kubota et al. showed that 18F-FDG preferentially accumulates in macrophages and young granulation tissues surrounding necrotic foci rather than tumor cells in a xenograft mouse model [25]. Similar results have also been observed in inflammed tissue: a strong accumulation of 18F-FDG was found in α-SMA-positive myofibroblasts in an intestinal ulceration model [35, 36], and in the granulation tissue of inflammation and malignant tumor models [45]. Furthermore, Zhang et al. found that 18F-FDG accumulated predominantly in noncancerous stroma in a tumor model under fed status [26]. Moreover, Chi's group found that double autophagy modulator (rapamycin + hydroxychloroquine) treatment only reduced the SUVmax without affecting tumor growth [46]. As CAFs are the major component of the tumor stroma, these findings suggest that non-proliferative glycolytic CAFs increase the local accumulation of 18F-FDG in tumors, and the SUVmax may be a perfect marker for anti-CAF therapy.
Previous studies showed that the SUVmean was not a significant prognostic value for gastric cancer patients, but a subgroup analysis in the same patients indicated that there was a significant relationship between high SUVmax and poor prognosis [11]. Other studies also indicated that high values of SUVmax predicted a higher risk of recurrence or death in patients with surgical non-small cell lung cancer (NSCLC) and nasopharyngeal carcinoma [34] [8]. Shi et al. showed that only SUVmax and TNM stage were associated with survival in a multivariate analysis (p < 0.05) [12]. These observations call for caution as the SUVmean of larger areas will be misleading and the SUVmax should be regarded as the region of interest [47], suggesting that the SUVmax might be a better prognostic marker for cancer patients than the SUVmean.
In this study, we also found that CAFs existed in the surgical margin of radical resection (5 cm away from the tumor lesion) in colon cancer patients in the SUVmax-group, which was often companied with high rate of recurrence. This is to some extent consistent with the finding that CAF distribution was larger in highly glycolytic lung cancers than in less glycolytic tumors [48], suggesting that the remaining CAFs post surgery promote cancer recurrence.
In brief, our data showed that CAFs increase 18F-FDG uptake and directly affect the SUV, especially the SUVmax, suggesting that CAFs as well as cancer cells are critical regulators of glucose uptake. This data further demonstrates that CAFs promote tumor progression, and SUVmax is a potential prognostic marker for cancer patients.
Material and Methods
Cells culture
Primary human fibroblasts (non-activated fibroblasts, NAFs) and HCT116 colon cancer cells (ATCC, VA, USA) were cultured in Dulbecco's modified Eagle's medium (DMEM) with 10% fetal bovine serum (FBS) at 37 °C in a 5% CO2 incubator.
Patient specimens
Tissue collection was approved by the Medical Ethical Committee of the Shanghai Jiao Tong University School of Medicine. Fresh and paraffin-embedded colorectal cancer blocks or peripheral normal colon tissue were collected from patients undergoing surgery at Rui Jin Hospital, Shanghai Jiao Tong University School of Medicine with informed consent.
Activated fibroblasts and HCT116 colon cancer cells
NAFs were cultured to subconfluence and treated for 96 h with Human PDGF-BB (Peprotech, IL, USA) at a concentration of 10 ng/mL to obtain PDGF-induced CAFs. Conditioned medium (CM) was collected and centrifuged from 72 h cultured medium. NAFs or HCT116 were cultured to subconfluence and treated for 24 h with conditioned medium (CM) of HCT116/CAF. All induced CAFs were authenticated by fibroblast activation protein (FAP) or fibroblast-specific protein 1 (FSP1) before assays.
Isolation of primary fibroblasts
Human NAFs and CAFs were isolated from normal colon tissue from the surgical incisal margin or colon cancer tissue, respectively. After excision, tissue was immediately transported to the laboratory on ice. After mincing, the tissue was digested with 0.1% type I collagenase and trypsin. After filtering with a 400-mesh sieve, the digested tissue was centrifuged at 1,000 × g for 10 min. Cells obtained from the pellet were then cultured with DMEM containing 10% FBS for 2 h. The attached cells, verified by F-actin staining, were fibroblasts. Isolated NAFs and CAFs between 4 and 10 passages were used, tested by mycoplasma presence, and verified by morphology and FAP/FSP1 expression.
Real-time PCR
Total RNA was reverse transcribed using PrimeScript RT reagent Kit (Takara, Shiga, Japan). The cDNA product was added to a mixture of SYBR Premix Ex Taq II (Takara). Measurement of gene expression was performed by quantitative real-time PCR. Polymerase chain reaction was conducted as follows: 95 °C for 30 s, followed by 40 cycles at 95 °C for 3 s and 60 °C for 34 s. The amount of target, normalized to an endogenous reference (β-actin) was given by 2-ΔΔCT calculation.
Western blotting
Western blotting assays were carried out using standard procedures. The antibodies included anti-HK2 (2867S, Cell Signaling Technology), anti-FSP1 (#13018, Cell Signaling Technology), anti-GLUT1 (12939S, Cell Signaling Technology), and anti-FAP (ab53066, Abcam). Antibodies for horseradish peroxidase-conjugated goat anti-rabbit/anti-mouse IgG and β-actin were purchased from Sigma (St. Louis, MO, USA).
Detection of in vitro 18F-FDG uptake and glucose consumption
In the 18F-FDG uptake assay, fibroblasts or mixed cells (the ratio of fibroblasts and HCT116 was 5:1) were cultured in glucose-free medium containing 1 μCi (37 kBq)/mL 18F-FDG at 37 °C. After incubation for 30 min, cells were stringently rinsed in cold PBS and lysed with 0.1 M NaOH, then 18F-FDG radioactivity was detected using a gamma counter. Glucose consumption production was analyzed using a glucose assay kit (Sigma). Protein concentration of each sample was determined using a Pierce BCA Protein Assay Kit (Thermo Fisher Scientific, Waltham, USA). Relative 18F-FDG uptake and glucose consumption were normalized according to the respective cell lysate protein concentration.
Cell viability assay
Cells were seeded at density of 1 × 10⁴ cells/well in 96-well plates under the condition of high glucose (4.5 g/L) or low glucose (1 g/L), respectively. 3-bromopyruvate (3-BrPA, Sigma) was freshly dissolved in sterile PBS. 3-BrPA at the indicated concentrations was added 24 h after seeding. Cell viability was determined by MTT assay 24 h after addition of the compounds. Absorbance was measured in a plate reader at 490 nm. Fractional survival was plotted against logarithm of drug dose, and IC50 values were calculated by Prism software (GraphPad Software).
Xenograft tumors
Four-week-old female BALB/c athymic nude mice were used for subcutaneous xenografts. All animal work was performed in accordance with a protocol approved by the Institutional Animal Care and Use Committee of the Shanghai Jiao Tong University School of Medicine. Tumor xenografts were generated by subcutaneously injecting HCT116 colon cancer cells alone or by co-injecting with PDGF-induced CAFs (the ratio of fibroblasts to HCT116 cells was 6:1; the number of HCT116 cells in each injection was 1 × 10⁶) into the forelimb armpit. For the xenografts for micro-PET/CT, HCT116 cells were injected alone or were co-injected with NAFs (pre-treated by radiation at a dose of 6 Gy) or with PDGF-induced CAFs (the ratio of fibroblasts to HCT116 cells was 3:1; the number of HCT116 cells in each injection was 2 × 10⁶). The tumor volume was determined every other day using a digital caliper. Tumor volume (mm3) = ½ × longest diameter × shortest diameter2.
AOM/DSS-induced colon cancer
Six-week-old male C57BL/6 mice were used for the AOM/DSS-induced colon cancer model. All animals were administered AOM (Sigma) by intraperitoneal injection at a dose of 10 mg/kg on the first day of the first week. After one week, mice were given 2% (w/v) DSS (MP Biomedicals, Solon, OH, USA) dissolved in drinking water on the second and fourth week. After about 3 months, AOM/DSS-induced colon cancer was verified by enteroscopy and 18F-FDG micro-PET/CT.
Micro-PET/CT imaging of mice
Mice bearing xenografts or spontaneous colon cancer were subjected to 18F-FDG micro-PET/CT analysis, performed on an Inveon MM Platform (Siemens, Munich, Germany). Mice were anesthetized with 2% isoflurane for 18F-FDG injection (a single injection of 3.7-7.4 MBq/0.1 mL 18F-FDG via tail vein). 40 min after administration of the tracer, mice were placed on the PET scanner bed and were maintained under continuous anesthesia during the study. Inveon Acquisition Workplace (Siemens) was used for scanning. 3D regions of interest were drawn over the entire tumor guided by CT images and tracer uptake was measured using Inveon Research Workplace software. The SUV was calculated as: decay-corrected activity (kBq) per milliliter of tissue volume / injected 18F-FDG activity (kBq) per gram of body weight.
Digital autoradiography
When the AOM/DSS-induced colon cancers were verified, 18F-FDG was injected via tail vein (a single injection of 7.4 MBq/0.1 mL) 40 min before animal euthanasia. Immediately after animal sacrifice, the tumor block was frozen and embedded with tissue-freezing medium (Leica, Wetzlar, Germany). 5 contiguous 5-10 μm thick tissue sections were cut by a 3050S cryostat microtome (Leica) for autoradiography and immunohistochemistry analysis.
The tumor sections were placed in a film cassette against an imaging plate (Fuji, Tokyo, Japan). The plate was exposed overnight and read by a Typhoon™FLA7000 (GE Healthcare, CA, USA) with Phosphor reader scanning system (laser: 650 nm, filter: IP, PMT: 800v, pixel size: 25 μM × 25 μM). The same tumor section used for autoradiography or contiguous adjacent sections were used for histological assays.
Immunohistochemistry
Immunohistochemistry of FSP1, FAP, GLUT1 and HK2 were performed using the tumour sections obtained from colorectal cancer patients, nude mice xenografts or induced colon cancers. Slides containing the sections were stained with antibodies against FSP1 (#13018, Cell Signaling Technology), GLUT1 (12939S, Cell Signaling Technology), HK2 (2867S, Cell Signaling Technology) or FAP (ab53066, Abcam). After microwaving for 5 min, 3 times, endogenous peroxidase was neutralized with 3% hydrogen peroxidase in methanol for 15 min at room temperature and primary antibodies were applied at 4 °C overnight. Anti-rabbit IgG biotinylated secondary antibody was applied for 30 min at 37 °C followed by SA-HRP for 30 min at 37 °C. Peroxidase was visualized using DAB for 5 min and counterstained in Mayer's hematoxylin for 20 min.
Clinical data and 18F-FDG PET/CT of patients
Patient records were anonymized and deidentified before analysis. Using our prospectively collected database, we selected patients with colorectal cancer who underwent 18F-FDG PET/CT scanning before surgery, from Jan 2011 to April 2016. 18F-FDG PET/CT scans were performed on a Discovery STE16 system (GE Healthcare). 18F-FDG PET/CT images were reviewed in consensus from 2 experienced nuclear medicine physicians who were blinded to clinical results at the time of the review. The standardized uptake value (SUV) was calculated as follows: activity in region of interest (mCi/mL) / injected dose (mCi/kg). Using the Xeleris workstation, we calculated the SUVmax in regions of interest over the area of most intense uptake. Clinical information on gender, age, tumor location, differentiation, clinical staging, T/N/M staging and tumor size (histological maximum diameter of the primary tumor lesion) were extracted from our database.
Automated image analysis and scoring
Spectral libraries of 30-50 images at 10× magnification were generated from single-stained slides containing the whole area of interest. Spectral libraries were then loaded into inForm Advanced image analysis software (PerkinElmer, Waltham, MA, USA). The image analysis method illustrated in Figure 1B comprised the following: (a) resolution of spectral properties of the FSP1 stains; (b) positive-stained cells (red) and negative-stained cells (blue) in the area of stroma; (c) classification of regions as tumour (red), stroma (green), blank space (violet), immune cells (yellow). Automated image analysis was used to quantify the number of stromal cells with positive FSP1 expression. The CAFs density was calculated as follows: number of positive-stained cells in stroma region / (whole slide region - blank space).
Statistical analysis
The data are presented as the mean ± SD. All results are representative of at least three independent experiments. A logistic-regression model was utilized. The differences were analyzed by Fisher's exact test for categorical variables and by Student's t test for continuous variables using SPSS 16.0 software (SPSS, Chicago, IL, USA). Differences with a value < 0.05 (denoted by *) were considered significant (***p < 0.001, **p < 0.01 and *p < 0.05).
Abbreviations
3-BrPA: 3-bromopyruvate; CAF: cancer-associated fibroblast; CM: conditioned media; DAR: digital autoradiography; DMEM: Dulbecco's modified Eagle's medium; EHD: extrahepatic bile duct; FAP: fibroblast activation protein; FBS: fetal bovine serum; FDG: fluorodeoxyglucose; 18F-FDG: 2-deoxy-2-[18F] glucose; FSP1: fibroblast-specific protein 1; GLUT1: glucose transporter 1; HIF1: hypoxia-inducible factor 1; HK2: hexokinase 2; HR: hazard ratio; IHC: immunohistochemistry; NAFs: non-activated fibroblasts; NSCLC: non-small cell lung cancer; OS: overall survival; PET: positron emission tomography; PET/CT: positron emission tomography-computed tomography; SUV: standardized uptake value.
Supplementary Material
Supplementary figures.
Acknowledgements
We would like to thank Prof. Gonghua Huang and Prof. Lei Huang (Shanghai Jiao Tong University School of Medicine) for spontaneous tumor model; Ms. Yuanyuan Sun (PerinElmer Management Co., Ltd.) for automated image analysis; Prof. Guohong Hu (Shanghai Institute of Biological Science, Chinese Academy of Science) for digital autoradiograph imaging. This study was supported by grants from the Shanghai Committee of Science and Technology (11DZ2260200), and the National Natural Science Foundation of China (81372194) (81572300) to Dr. Mi, and the National Natural Science Foundation of China (81471686) to Dr. Li.
Author contribution
C. S., G. G., J.Z., J. W., Y.M. and M.Z. performed most of the experiments; B. L. provided clinical experiments and revised the paper; J. M. designed the project and wrote the article; all authors reviewed the manuscript.
Competing Interests
The authors have declared that no competing interest exists.
References
1. Som P, Atkins HL, Bandoypadhyay D. et al. A fluorinated glucose analog, 2-fluoro-2-deoxy-D-glucose (F-18): nontoxic tracer for rapid tumor detection. Journal of nuclear medicine: official publication, Society of Nuclear Medicine. 1980;21:670-5
2. Ruers TJ, Wiering B, van der Sijp JR. et al. Improved selection of patients for hepatic surgery of colorectal liver metastases with (18)F-FDG PET: a randomized study. Journal of nuclear medicine: official publication, Society of Nuclear Medicine. 2009;50:1036-41
3. Rohren EM, Turkington TG, Coleman RE. Clinical applications of PET in oncology. Radiology. 2004;231:305-32
4. Fletcher JW, Djulbegovic B, Soares HP. et al. Recommendations on the use of 18F-FDG PET in oncology. Journal of nuclear medicine: official publication, Society of Nuclear Medicine. 2008;49:480-508
5. Stahl A, Ott K, Weber WA. et al. FDG PET imaging of locally advanced gastric carcinomas: correlation with endoscopic and histopathological findings. European journal of nuclear medicine and molecular imaging. 2003;30:288-95
6. Berghmans T, Dusart M, Paesmans M. et al. Primary tumor standardized uptake value (SUVmax) measured on fluorodeoxyglucose positron emission tomography (FDG-PET) is of prognostic value for survival in non-small cell lung cancer (NSCLC): a systematic review and meta-analysis (MA) by the European Lung Cancer Working Party for the IASLC Lung Cancer Staging Project. Journal of thoracic oncology: official publication of the International Association for the Study of Lung Cancer. 2008;3:6-12
7. Tsutani Y, Miyata Y, Nakayama H. et al. Prognostic significance of using solid versus whole tumor size on high-resolution computed tomography for predicting pathologic malignant grade of tumors in clinical stage IA lung adenocarcinoma: a multicenter study. The Journal of thoracic and cardiovascular surgery. 2012;143:607-12
8. Huang Y, Feng M, He Q. et al. Prognostic value of pretreatment 18F-FDG PET-CT for nasopharyngeal carcinoma patients. Medicine. 2017;96:e6721
9. Lee M, Jeon JY, Neugent ML. et al. 18F-Fluorodeoxyglucose uptake on positron emission tomography/computed tomography is associated with metastasis and epithelial-mesenchymal transition in hepatocellular carcinoma. Clinical & experimental metastasis. 2017;34:251-60
10. Liu J, Dong M, Sun X. et al. Prognostic Value of 18F-FDG PET/CT in Surgical Non-Small Cell Lung Cancer: A Meta-Analysis. PloS one. 2016;11:e0146195
11. Wu Z, Zhao J, Gao P. et al. Prognostic value of pretreatment standardized uptake value of F-18-fluorodeoxyglucose PET in patients with gastric cancer: a meta-analysis. BMC cancer. 2017;17:275
12. Shi D, Cai G, Peng J. et al. The preoperative SUVmax for (18)F-FDG uptake predicts survival in patients with colorectal cancer. BMC cancer. 2015;15:991
13. Brown RS, Goodman TM, Zasadny KR. et al. Expression of hexokinase II and Glut-1 in untreated human breast cancer. Nuclear medicine and biology. 2002;29:443-53
14. Gu J, Yamamoto H, Fukunaga H. et al. Correlation of GLUT-1 overexpression, tumor size, and depth of invasion with 18F-2-fluoro-2-deoxy-D-glucose uptake by positron emission tomography in colorectal cancer. Digestive diseases and sciences. 2006;51:2198-205
15. Pauwels EK, Sturm EJ, Bombardieri E. et al. Positron-emission tomography with [18F]fluorodeoxyglucose. Part I. Biochemical uptake mechanism and its implication for clinical studies. Journal of cancer research and clinical oncology. 2000;126:549-59
16. Kaira K, Endo M, Abe M. et al. Biologic correlation of 2-[18F]-fluoro-2-deoxy-D-glucose uptake on positron emission tomography in thymic epithelial tumors. Journal of clinical oncology: official journal of the American Society of Clinical Oncology. 2010;28:3746-53
17. Kawada K, Nakamoto Y, Kawada M. et al. Relationship between 18F-fluorodeoxyglucose accumulation and KRAS/BRAF mutations in colorectal cancer. Clinical cancer research: an official journal of the American Association for Cancer Research. 2012;18:1696-703
18. Bos R, van Der Hoeven JJ, van Der Wall E. et al. Biologic correlates of (18)fluorodeoxyglucose uptake in human breast cancer measured by positron emission tomography. Journal of clinical oncology: official journal of the American Society of Clinical Oncology. 2002;20:379-87
19. Yoon SO, Jeon TJ, Park JS. et al. Analysis of the roles of glucose transporter 1 and hexokinase 2 in the metabolism of glucose by extrahepatic bile duct cancer cells. Clinical nuclear medicine. 2015;40:e178-82
20. Mano Y, Aishima S, Kubo Y. et al. Correlation between biological marker expression and fluorine-18 fluorodeoxyglucose uptake in hepatocellular carcinoma. American journal of clinical pathology. 2014;142:391-7
21. Takebayashi R, Izuishi K, Yamamoto Y. et al. [18F]Fluorodeoxyglucose accumulation as a biological marker of hypoxic status but not glucose transport ability in gastric cancer. Journal of experimental & clinical cancer research: CR. 2013;32:34
22. Qian N, Ueno T, Kawaguchi-Sakita N. et al. Prognostic significance of tumor/stromal caveolin-1 expression in breast cancer patients. Cancer science. 2011;102:1590-6
23. Underwood TJ, Hayden AL, Derouet M. et al. Cancer-associated fibroblasts predict poor outcome and promote periostin-dependent invasion in oesophageal adenocarcinoma. J Pathol. 2015;235:466-77
24. Marsh D, Suchak K, Moutasim KA. et al. Stromal features are predictive of disease mortality in oral cancer patients. J Pathol. 2011;223:470-81
25. Kubota R, Yamada S, Kubota K. et al. Intratumoral distribution of fluorine-18-fluorodeoxyglucose in vivo: high accumulation in macrophages and granulation tissues studied by microautoradiography. Journal of nuclear medicine: official publication, Society of Nuclear Medicine. 1992;33:1972-80
26. Zhang G, Li J, Wang X. et al. The reverse Warburg effect and 18F-FDG uptake in non-small cell lung cancer A549 in mice: a pilot study. Journal of nuclear medicine: official publication, Society of Nuclear Medicine. 2015;56:607-12
27. Pavlides S, Whitaker-Menezes D, Castello-Cros R. et al. The reverse Warburg effect: aerobic glycolysis in cancer associated fibroblasts and the tumor stroma. Cell cycle. 2009;8:3984-4001
28. Martinez-Outschoorn U, Sotgia F, Lisanti MP. Tumor microenvironment and metabolic synergy in breast cancers: critical importance of mitochondrial fuels and function. Seminars in oncology. 2014;41:195-216
29. Zhang D, Wang Y, Shi Z. et al. Metabolic reprogramming of cancer-associated fibroblasts by IDH3alpha downregulation. Cell reports. 2015;10:1335-48
30. Chiarugi P, Cirri P. Metabolic exchanges within tumor microenvironment. Cancer letters. 2016;380:272-80
31. Migneco G, Whitaker-Menezes D, Chiavarina B. et al. Glycolytic cancer associated fibroblasts promote breast cancer tumor growth, without a measurable increase in angiogenesis: evidence for stromal-epithelial metabolic coupling. Cell cycle. 2010;9:2412-22
32. Sanita P, Capulli M, Teti A. et al. Tumor-stroma metabolic relationship based on lactate shuttle can sustain prostate cancer progression. BMC cancer. 2014;14:154
33. Wu J, Fu R, Liu Z. et al. Cell proliferation downregulated by TGF-beta2-triggered G1/S checkpoint in clinical CAFs. Cell cycle. 2017;16:172-8
34. Li Q, Zhang D, Wang Y. et al. MiR-21/Smad 7 signaling determines TGF-beta1-induced CAF formation. Sci Rep. 2013;3:2038
35. Wang Y, Gan G, Wang B. et al. Cancer-associated Fibroblasts Promote Irradiated Cancer Cell Recovery Through Autophagy. EBioMedicine. 2017;17:45-56
36. Yamato M, Kataoka Y, Mizuma H. et al. PET and macro- and microautoradiographic studies combined with immunohistochemistry for monitoring rat intestinal ulceration and healing processes. Journal of nuclear medicine: official publication, Society of Nuclear Medicine. 2009;50:266-73
37. Fujii T, Yajima R, Kurozumi S. et al. Clinical Significance of 18F-FDG-PET in Invasive Lobular Carcinoma. Anticancer research. 2016;36:5481-5
38. Kitagawa Y, Sano K, Nishizawa S. et al. FDG-PET for prediction of tumour aggressiveness and response to intra-arterial chemotherapy and radiotherapy in head and neck cancer. European journal of nuclear medicine and molecular imaging. 2003;30:63-71
39. Lee DS, Kim SJ, Jang HS. et al. Clinical Correlation Between Tumor Maximal Standardized Uptake Value in Metabolic Imaging and Metastatic Tumor Characteristics in Advanced Non-small Cell Lung Cancer. Medicine. 2015;94:e1304
40. Avril N, Menzel M, Dose J. et al. Glucose metabolism of breast cancer assessed by 18F-FDG PET: histologic and immunohistochemical tissue analysis. Journal of nuclear medicine: official publication, Society of Nuclear Medicine. 2001;42:9-16
41. Downey RJ, Akhurst T, Gonen M. et al. Preoperative F-18 fluorodeoxyglucose-positron emission tomography maximal standardized uptake value predicts survival after lung cancer resection. Journal of clinical oncology: official journal of the American Society of Clinical Oncology. 2004;22:3255-60
42. Guan ZW, Xu BX, Wang RM. et al. Hyperaccumulation of (18)F-FDG in order to differentiate solid pseudopapillary tumors from adenocarcinomas and from neuroendocrine pancreatic tumors and review of the literature. Hellenic journal of nuclear medicine. 2013;16:97-102
43. Schoder H, Noy A, Gonen M. et al. Intensity of 18fluorodeoxyglucose uptake in positron emission tomography distinguishes between indolent and aggressive non-Hodgkin's lymphoma. Journal of clinical oncology: official journal of the American Society of Clinical Oncology. 2005;23:4643-51
44. Mizuno T, Kamai T, Abe H. et al. Clinically significant association between the maximum standardized uptake value on 18F-FDG PET and expression of phosphorylated Akt and S6 kinase for prediction of the biological characteristics of renal cell cancer. BMC cancer. 2015;15:1097
45. Sun YL, Jan ML, Kao PF. et al. Coincidence planar imaging for dynamic [18F]FDG uptake in nude mice with tumors and inflammation: correlated with histopathology and micro-autoradiography. Kaohsiung J Med Sci. 2005;21:258-66
46. Chi MS, Lee CY, Huang SC. et al. Double autophagy modulators reduce 2-deoxyglucose uptake in sarcoma patients. Oncotarget. 2015;6:29808-17
47. Henriksson E, Kjellen E, Wahlberg P. et al. 2-Deoxy-2-[18F] fluoro-D-glucose uptake and correlation to intratumoral heterogeneity. Anticancer Res. 2007;27:2155-9
48. Chaudhri VK, Salzler GG, Dick SA. et al. Metabolic alterations in lung cancer-associated fibroblasts correlated with increased glycolytic metabolism of the tumor. Mol Cancer Res. 2013;11:579-92
Author contact
![]() Corresponding authors: Jun Mi: jmeiedu.cn; Biao Li: lb10363com.cn
Corresponding authors: Jun Mi: jmeiedu.cn; Biao Li: lb10363com.cn