Impact Factor
- Issue 14; 2026
- Issue 13; 2026
- Issue 12; 2026
- Issue 11; 2026
- Issue 10; 2026
- Volume 16; 2026
- Advance Articles
- Past Issues
- Cover Images
- Cover Suggestion
- Index & Coverage
- Special Issues
Introduction
Methods
Results
Discussion
Supplementary Material
Abbreviations
Acknowledgements
References
International Journal of Biological Sciences
International Journal of Medical Sciences
 Global reach, higher impact

Theranostics 2018; 8(6):1636-1647. doi:10.7150/thno.22233 This issue Cite
Research Paper
Non-Invasive Electrical Impedance Tomography for Multi-Scale Detection of Liver Fat Content
Yuan Luo1*, Parinaz Abiri2,3*, Shell Zhang1, Chih-Chiang Chang2, Amir H. Kaboodrangi2, Rongsong Li3, Ashish K. Sahib4,5, Alex Bui2,4, Rajesh Kumar4,5, Mary Woo6, Zhaoping Li3, René R. Sevag Packard3, Yu-Chong Tai1, Tzung K. Hsiai1,2,3 ![]()
1. Department of Medical Engineering, California Institute of Technology, Pasadena, California.
2. Department of Bioengineering, Henry Samueli School of Engineering and Applied Sciences, University of California, Los Angeles, California.
3. Department of Medicine, David Geffen School of Medicine, University of California, Los Angeles, California.
4. Department of Radiology, David Geffen School of Medicine, University of California, Los Angeles, California.
5. Department of Anesthesiology, David Geffen School of Medicine, University of California, Los Angeles, California.
6. School of Nursing, University of California, Los Angeles, California.
* Both authors contributed equally to this manuscript
Received 2017-8-4; Accepted 2017-12-1; Published 2018-2-8
Abstract

Introduction: Obesity is associated with an increased risk of nonalcoholic fatty liver disease (NAFLD). While Magnetic Resonance Imaging (MRI) is a non-invasive gold standard to detect fatty liver, we demonstrate a low-cost and portable electrical impedance tomography (EIT) approach with circumferential abdominal electrodes for liver conductivity measurements.
Methods and Results: A finite element model (FEM) was established to simulate decremental liver conductivity in response to incremental liver lipid content. To validate the FEM simulation, we performed EIT imaging on an ex vivo porcine liver in a non-conductive tank with 32 circumferentially-embedded electrodes, demonstrating a high-resolution output given a priori information on location and geometry. To further examine EIT capacity in fatty liver detection, we performed EIT measurements in age- and gender-matched New Zealand White rabbits (3 on normal, 3 on high-fat diets). Liver conductivity values were significantly distinct following the high-fat diet (p = 0.003 vs. normal diet, n=3), accompanied by histopathological evidence of hepatic fat accumulation. We further assessed EIT imaging in human subjects with MRI quantification for fat volume fraction based on Dixon procedures, demonstrating average liver conductivity of 0.331 S/m for subjects with low Body-Mass Index (BMI < 25 kg/m²) and 0.286 S/m for high BMI (> 25 kg/m²).
Conclusion: We provide both the theoretical and experimental framework for a multi-scale EIT strategy to detect liver lipid content. Our preliminary studies pave the way to enhance the spatial resolution of EIT as a marker for fatty liver disease and metabolic syndrome.
Keywords: Fatty Liver, Nonalcoholic Fatty Liver Disease, Electrical Impedance Tomography, Fat Volume Fraction
Introduction
Over one-third of U.S. adults aged 20 years or older are categorized as obese with a body mass index (BMI) ≥ 30 kg/m2 [1]. Obesity is associated with an increased risk of nonalcoholic fatty liver disease (NAFLD) [2]. The spectrum of NAFLD ranges from an increase in intrahepatic triglyceride content (i.e., simple steatosis) to inflammation and fibrosis (i.e., severe steatohepatitis or NASH) [3], with predisposition to an increased risk for developing cirrhosis, hepatocellular carcinoma, type 2 diabetes and cardiovascular disease [4,5]. Current NAFLD assessment techniques include liver biopsy, magnetic resonance imaging (MRI), computed tomography (CT), and abdominal ultrasound (US) [6,7]. While liver biopsy remains a gold standard for the diagnosis of NAFLD, bleeding risk and sampling errors limit its clinical practice [7]. While MRI is a non-invasive gold standard, patient comfort and high-cost limit its application to a selected population. CT exposes patients to radiation, whereas abdominal US requires high expertise and is limited in its ability to distinguish stages of NAFLD [7]. The unmet clinical challenges lie in decreasing the cost and minimizing the operating skills necessary for routine assessment of fatty liver disease for determining patient adherence to dietary interventions and monitoring the outcome of clinical interventions. To address these challenges, we developed a non-invasive and portable electrical impedance tomography (EIT) system for detecting fatty liver in a non-clinical setting.
Biological tissues store charge, and frequency-dependent electrical impedance (Z) develops in response to applied alternating current (AC). When an AC current is applied to a target site, a “complex” electric impedance (Z) can be measured as a function of frequency. Z is defined as the summation of a real number (r) and the resistance (Xc) multiplied by the complex number (i) (Z = r + Xci) [8,9]. At high frequencies, the current passes through the cell membranes acting as imperfect capacitors giving rise to tissue- and fluid-dependent impedance. At low frequencies, the cell membranes impede current flow [10]. Fat-free tissue is electrically conductive for its elevated water (~73%) and electrolyte (ions and proteins) content, whereas fatty tissue is less conductive for its anhydrous property. In corollary, these properties allow the measurement of volumes, shapes, or tissue electrical properties via electrical impedance sensors. We have previously developed electrical impedance spectroscopy (EIS) technology in the form of intravascular flexible sensors to assess low-density lipoprotein (LDL)-rich lesions in the coronary, carotid, and femoral arteries for detecting metabolically unstable plaque [8,11-15]. Other laboratories have also demonstrated EIS-based organ-level tissue characterization via invasive techniques [16] or organ excisions [17]. Despite providing an overall impedance value of the organ/tissue, these EIS systems have been unable to produce enough impedimetric information for focused organ analysis in a non-invasive manner. Thus, we propose the use of electrical impedance tomography (EIT) for the assessment of liver lipid content [15].
EIT is a non-invasive medical imaging technique by which an image of the tissue conductivity or permittivity is inferred from surface electrode measurements [10]. The first clinical images obtained using EIT were produced by the Sheffield group for pulmonary function [18]. Over the past three decades, EIT has been applied to evaluate lungs, breast tissue, and the brain [10]. Respiratory monitoring has been established by transthoracic impedance pneumography [19,20]. Similarly, non-invasive cardiac output and stroke volume measurements have been demonstrated by the effects of myocardial motion and blood volume [21,22].
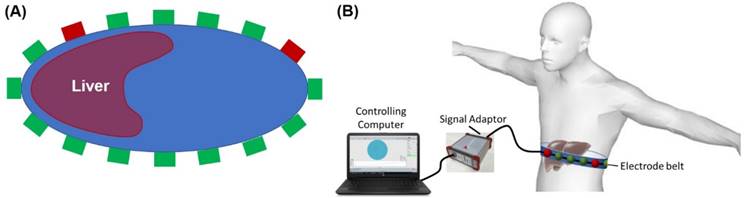
EIT systems usually apply small alternating currents at single or multiple frequencies to some or all of the electrodes (Figure 1), resulting in potentials being recorded from the other electrodes. This process is subsequently repeated for different electrode configurations to generate a 2-D tomogram by the reconstruction algorithms. The varying free ion content renders muscle and blood more conductive than fat, bone, or lung tissue in response to the applied current [23,24]. This conductivity property enables us to reconstruct static images for morphological or absolute EIT. Unlike the vast majority of imaging techniques, EIT requires no ionizing radiation or injectable contrast agents. We thereby designed a novel multi-electrode array system to reconstruct an EIT map for the detection of the lipid distribution in the fatty liver.
EIT electrode configuration. (A) A schematic diagram illustrates the circumferential electrode placement around the abdomen for conductivity measurements and the pairwise measurements between each pair of electrodes. (B) Schematic of EIT system setup with abdominal belt connected to data acquisition hardware and software.
We first established the feasibility of EIT for liver imaging via Finite Element Simulation models. Next, we demonstrated multi-scale EIT imaging from an ex vivo porcine liver to fatty liver in New Zealand White (NZW) rabbits following a high-fat diet. We further performed a correlation study between EIT imaging and MRI-based Fat Volume Fraction (FVF) maps from high vs. low BMI subjects. Our preliminary studies demonstrated that our EIT mapping system holds promise to provide inexpensive and portable detection of liver fat content for outpatient screening with minimal operator training.
Methods
Theoretical Framework for EIT imaging
To obtain an EIT map, we aimed to generate a conductivity image inside the liver by applying a known current, followed by measuring voltage from the surface of the abdomen [10]. Despite a plethora of studies in EIT [25-31], both the inverse and forward problems have remained an experimental challenge with the ill-posed inverse boundary value introducing issues of existence, uniqueness, and instability [32]. While reasonable assumptions about the conducting body partially addressed this challenge, the issues with instability continued to yield a solution sensitive to noise. To minimize instability, we and others [33] established boundary conditions by using a priori knowledge of the conducting body, and derived the solution by using a regularized Gauss-Newton (GN) type solver.
Considering an object domain, Ω, the following Laplace equation applies:
∇ ∙ (-σ*∇V) = 0 (1)
where  represents complex conductivity in Ω, defined as σ* = σ + jωɛ with j = √-1. σ is defined as the electrical conductivity, ɛ the permittivity, ω angular frequency, and V voltage in Ω. For the ensuing discussion, σ has been used to replace σ* as conclusions using σ (the static form of σ* σ* with ω=0) can be extended to the complex case [34].
EIT is the inverse problem of Equation (1) in determining σ distribution in Ω, at the given voltage, Vs, measured from the object domain boundaries ∂Ω. We took into account the difference:
e = Vs - f (σ) (2)
Where f (σ) is implicitly defined as the forward model to obey Equation (1). To implement the GN solver, we solved σ to minimize the L-2 norm of the error:
Φ = || e ||2 = || V - f (σ) ||2 (3)
By taking the first order of Taylor series expansion of the forward problem function, we approximated as follows:
f (σ) ≅ f (σo) + J (σ - σo) (4)
where σo is a reference conductivity value, and J is the Jacobian matrix of our inverse problem. The objective function is defined as:
Φ = || V - f (σo) - J (σ - σo) ||2 (5)
To minimize φ, we set ∂Φ/∂σ =0 to solve for σ from Equation (5):
σ = σo + (J TJ) -1 J T( V - f (σo)) (6)
Equation (6) is an unconstrained GN form of the inverse problem with the well-recognized instability issues [34]. We thus introduced a constraint term to sway the solution towards the preferred solution:
Φ = || ɛ ||2 +λ || Γ σ ||2 (7)
The coefficient, λ, is the regularization parameter to “punish” the large conductivity spikes in the solution space and to balance the trade-off between fitting the error and constraining the solution from the undesired properties. The term, Γ, was introduced to select more properties of the sigma. For a smooth solution, Γ was considered to be a Laplacian operator to punish the non-smoothness of the solution. For an a priori conductivity with similar area, Γ was considered to be a “weighted” Laplacian operator to punish the non-smooth regions. This strategy is applicable in medical imaging where EIT is applied to acquire the conductivity information of the organ systems, and the anatomic localization of the organs is available from the a priori information obtained from different imaging modalities, such as CT or MRI. Following application of the regulation term to Equation (5), the solution was defined as follows:
σ = σo + (J TJ + λ Γ T Γ ) -1 J T( V - f (σo)) (8)
The scheme of absolute imaging was performed by an iterated approach, assuming an arbitrary conductivity, σo, for calculating J, Γ and f (σo). Using Equation (8), we demonstrated a new conductivity value, σ1. The iteration continued until the difference between σn and σn-1 reached a minimally desired value.
EIT and Diffuse Optical Tomography Reconstruction Software (EIDORS)
The data from our studies were obtained from an online open source software suite known as EIDORS (version 3.8 [35]), used for image reconstruction in electrical impedance tomography and diffuse optical tomography. EIDORS has been under active maintenance to date as a collective effort over the years [36]. For EIT simulation, EIDORS allowed us to establish a forward finite element model (with help of Netgen, a mesh generator [37]) with arbitrary geometric boundaries and conductivity values that were assigned inside the model in specific constrained volumes. Next, we defined an array of electrodes on the surface of the model with specified coordinates, shape, and area. Voltage values at each electrode were simulated with the current injection boundary condition and with the pre-assigned conductivity value based on Equation (1). These voltage values served as “data” for the subsequent EIT imaging. To introduce white Gaussian noise with certain signal-to-noise-ratio (SNR) to the “data”, we added normally distributed random numbers set to 10-SNR/10 of the average power of the “voltage data”. To perform the EIT imaging, we created a new inverse finite element model to avoid the so-called “inverse crime” [38] without assigning any specific conductivity value. We numerically implemented this inverse problem algorithm (Equation 8) in the new model to generate a conductivity map based on the simulated “voltage data”.
In our imaging application, only the inverse finite element model was required, and the voltage data was directly obtained from the experimental measurements. Distinct geometry of the target object was inputted accordingly in EIDORS for the inverse finite element model. In the present study, the geometric information was obtained from the camera-captured images for the NZW rabbit study or the MR images for the human study. This approach reduced calculation errors in association with the inaccurately presumed geometry of the finite element model as compared to the actual target object, and due to variations in geometry among different objects. In the inverse step to calculate the conductivity map,  from Equation (8) was calculated as “Laplace prior”[39]. The regularization parameter λ was found to be optimal at ~1x10⁻⁴, resulting in an image in closest resemblance to the actual object. The selection process for λ can be further optimized via selection algorithms [40]. In a region where a priori shape information was available, we increased λ by 10-fold to heavily punish the non-smoothness of conductivity within that region. Other methods for segmented regularization [41,42] would be considered for our future investigations.
Theoretical Simulation of Fatty Liver
A 2-dimensional (2-D) finite element model (FEM) was established at the thoracic spine level T11-T12, at which different average tissue conductivities at 250 kHz were assigned in accordance with the reported values (Table 1) [43].
Average ex vivo tissue conductivities at 250 KHz [43].
| Organ | Conductivity (S/m) |
|---|---|
| Liver | 0.120 |
| Spleen | 0.132 |
| Spinal Cord | 0.028 |
| Stomach | 0.523 |
The geometry of the EIT output was matched to the perimeter of the cross-section to circumvent the appearance of ghost regions and inaccurate conductance values. The EIT algorithm was tested under four conditions: a healthy liver and three progressively increased fatty contents in the liver. These conditions were simulated by varying the conductivity in response to the increase in fat content, as calibrated by the ratios to a reported healthy liver's conductivity of 0.120 S/m [43]. The conductivity of fat was defined as 0.04 S/m. A 15% fat weight ratio in the liver was considered to be the upper percentage of fat content in mild or moderate steatosis [44]. An 85%/15% weight ratio resulted in a 10% reduction in conductivity to 0.108 S/m as compared to the normal liver conductivity. Therefore, the initial three simulation scenarios were set to 100%, 95%, and 90% of normal liver conductivity, and the final scenario was set to 70% of normal liver conductivity for severe progression of NAFLD (Figure 4). To simulate the effects of noise during in vivo EIT measurements, we included additive white Gaussian noise with Signal-to-Noise Ratio (SNR) of 20 dB to the voltage data (i.e., the averaged power of noise was set to 1% of the averaged power of the simulated voltage value from the forward model). This was similar to the actual SNR characteristics of the Swisstom Pioneer Set (Swisstom AG, Switzerland).
The region of interest was determined in two steps: (1) the initial identification of the minimum conductivity value around an approximated liver region within an abdominal cross-section, and (2) identification of the area that was within 400% of the minimum value to capture the full approximated liver region. All included elements from the area were averaged, and the results were presented as the effective conductivity in the liver region.
Materials and Instruments
Multi-scale physiological studies were performed to assess EIT feasibility for the detection of fatty liver disease. In bench test studies, stainless steel electrodes were utilized for stimulation and measurement. In our animal and human studies, an array of disposable surface electrocardiogram electrodes (Covidien, Ireland) was utilized. Data acquisition was accomplished through the Swisstom EIT Pioneer Set (Swisstom AG, Switzerland). Each electrode was connected to individual data acquisition channels (32 in total) of the Swisstom system via electrical wires, which then interfaced with a computer through an interfacing module. Each channel was capable of delivering different magnitudes and frequencies of current to the target (excitation 2-4 mA, 50-250 kHz), while measuring voltage responses through the same set of electrodes.
Studies have shown that fatty liver can be characterized at frequencies higher than 50 kHz [45]. Negligible difference was noted in the imaging results between 50 kHz and 250 kHz throughout our study. The “skipping 4” pattern, in which there are 4 electrodes between each set of stimulation and measuring electrode, was adopted for both current injection and voltage measurement in all studies [46].
Bench Validation Studies
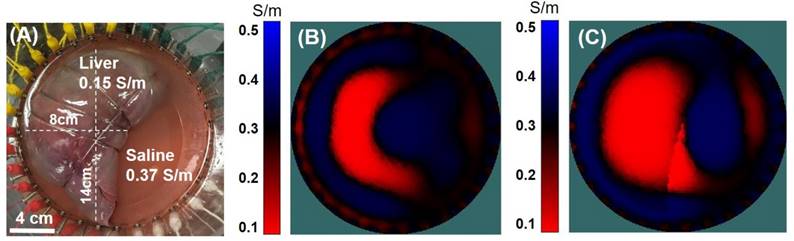
To assess the feasibility of EIT imaging for determining liver health, we first performed an ex vivo study. A porcine liver was placed in an electrically non-conductive round container (15 cm in diameter) filled with normal saline solution with a conductivity of 1.5 S/m to mimic the extracellular fluid content of the body (Figure 5A). Thirty-two equidistant holes were circumferentially drilled into the container to allow for the installation of stainless steel electrodes (3 mm in diameter).
The region of interest was determined under two conditions to assess the significance of a priori information on the EIT imaging output: (1) ROI selection similar to the method performed in the theoretical simulations, and (2) ROI selection based on the known shape and position of the liver within the saline tank. All included elements from the area were averaged and the results were presented as the effective conductivity of the liver.
EIT imaging of Fat-Fed New Zealand White Rabbits
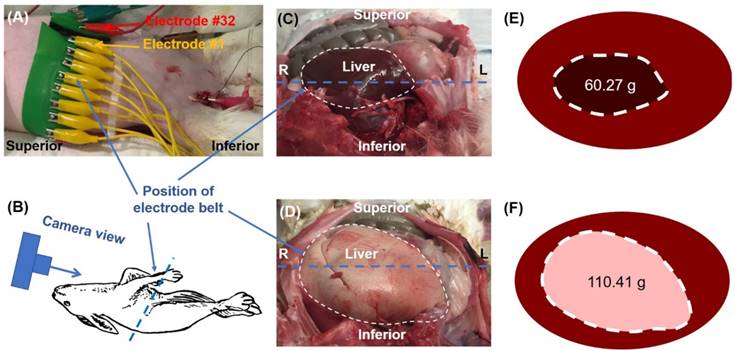
All animal studies were approved by the UCLA Office of Animal Research. Age-matched New Zealand White (NZW) rabbits were fed a chow diet (n=3) or a high-fat diet (n=3) as previously described [15]. Following 8 weeks of high-fat diet, the liver was demarcated by an experienced veterinarian at UCLA Department of Animal and Laboratory Medicine. Thirty-two equally spaced electrodes were circumferentially positioned around a cleanly shaven abdomen to perform liver EIT (Figure 2). Conductive gel was applied to enhance a low impedance communication between the connecting pads and the animal's skin. The contact impedance of all electrodes was maintained below 200 Ω. The experiments on these rabbits were performed post-mortem following the removal of the cardiac organs, resulting in partial migration of the liver toward the center of the abdominal cavity (Figures 2E, F). For EIT computation, an oval-like geometry was assumed to represent the rabbit's abdominal boundary condition. The ROI was determined similar to the theoretical simulations with identification of the area within 200% of the minimum value. All included elements from the area were averaged and the results were presented as the effective conductivity in the liver region.
Ex vivo rabbit study. (A) A belt embedded with 32 electrodes was placed around the rabbit's abdomen. (B) The cartoon schematic diagram demonstrates the camera perspective for the images captured in (C) and (D) to visualize organ arrangement and relative position of the electrode belt along the liver border. The liver from a normal diet-fed NZW rabbit (C) was compared with a high-fat fed rabbit (D), highlighting the increase in size and change in color from fat accumulation in the fatty liver (E-F).
After euthanasia, the rabbit livers were harvested and stored in 4% paraformaldehyde. Prior to histological staining, the tissues were washed and stored in 70% ethanol. The tissues were stained with hematoxylin and eosin (H&E) (Figure 4G, H).
Comparison between EIT and MRI-Based Fat Volume Fraction Maps in Humans
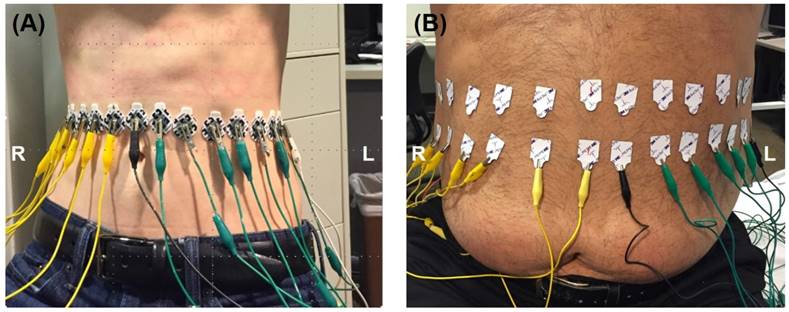
The EIT system was further tested in a clinical setting in compliance with the UCLA IRB protocol. The data was validated by magnetic resonance imaging (MRI) procedures for fatty liver using the Dixon method [47]. 32 electrodes were circumferentially attached to the outer skin of the abdomen equidistance to one another. The proper vertical level of the electrodes was determined by palpating the position of the liver. Capsules containing MRI contrast reagent were then attached onto the abdominal skin at the determined vertical level. The electrodes were placed at the exact vertical level of the capsules, the existence of which in the MRI scan helped select the image of interest from a total scan through the entire abdomen of the subjects. The ROI was determined based on the MRI cross-section image of the liver. Subjects were asked to remain in a supine breath-hold position throughout both MRI and EIT measurements to minimize any possible shift or deformation of organs during movement. The electrodes were connected with wires to the Swisstom system and the same acquisition protocol was used as described in the ex vivo rabbit study. The EIT measurements were performed on one subject with low body mass index (BMI< 25 kg/m²) and one with high BMI (>25 kg/m²) as illustrated in Figure 3.
In Vivo Studies. EIT measurements were performed by circumferentially attaching 32 electrodes equidistant to one another along the abdomen on two subjects: low vs. high BMI.
Liver MR images were subsequently acquired using a 3.0 T MRI scanner (Siemens, Magnetom, Prisma) in the Department of Radiological Sciences at UCLA. Dixon 3D Volumetric Interpolated Breath-Hold Examination (VIBE) MR imaging was performed using a dual-echo in-phase (In) and opposed-phase (Op) with single breath-hold technique (TR = 3.97 ms, TE (Op/In) = 1.29/2.52 ms, FA = 5°, bandwidth = 1040 Hz/pixel, matrix size = 320×260, FOV = 380×308.75 mm, slice thickness = 3 mm, and 72 axial slices). Two separate scans were collected for optimum data quality to avoid possible motion artifacts from a single scan. Scanning time was about 40 s [48].
Fat volume fraction (FVF) maps were generated by using the MRI scans. Using the 2-point Dixon 3D VIBE method, in-phase, opposite-phase, fat, and water images were generated [49]. The FVF maps were generated by combining the fat and water images of the individual subjects as shown in Equation 9 [50-52]:
(9)
A global liver FVF value was quantified by manually segmenting the entire livers in each subject using the opposite-phase (SOP) image with MRIcroN software. The segmented liver masks were used to remove non-liver tissue from the FVF maps and global FVF values were calculated from the individual subjects using MATLAB-based custom software.
Statistical Analysis
To test differences in the assigned conductivity values and EIT output in the FEM simulation, we applied a two-sample paired (two-tailed, unequal variance) t-test. In the New Zealand White (NZW) rabbit studies, we performed a two-sample unpaired (two-tailed, unequal variance) t-test to compare the normal chow-fed rabbits with the high-fat-fed rabbits. A p-value < 0.05 was considered statistically significant.
Results
Theoretical Simulation of Fatty Liver
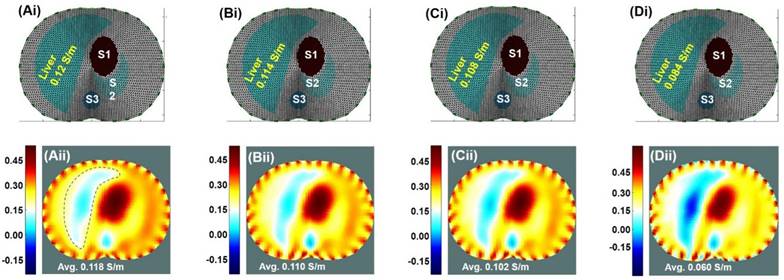
A Finite Element Model (FEM) was established, in which different average tissue conductivities at 250 kHz were assigned for liver conductivity simulation. Correlation between conductivity maps and EIT readings was performed. No significant difference was observed between the assigned conductivity (Figure 4Ai-Di) and EIT output values (Figure 4Aii-Dii) with p = 0.17, indicating reliable EIT computation.
Theoretical Simulation. Results were based on the EIT imaging algorithm in response to decremental conductivity values assigned to the liver; namely, 100%, 95%, 90%, and 80% of the baseline conductivity of 0.12 S/m, with the conductivity representing the variation in the fat content of the liver. (Ai-Di) The anatomic localization of the liver relative to other organs along an axial slice. S1: Stomach; S2: Spleen; S3: Spine. (Aii-Dii) EIT simulated the corresponding images undergoing decremental conductivity.
In response to noise (SNR = 20 dB) introduced into the reconstructed EIT image, the liver conductivity was reduced by 3.3%. These findings underscored the importance of acquiring a large cross-section surface area to minimize the noise for EIT liver imaging. Furthermore, the impact of inaccuracies in geometric boundaries and the influence of the initial size of the liver on the imaging results were also simulated and demonstrated in the supplementary materials (Figure S1 and Figure S2).
Bench Validation Studies
Results from the porcine liver immersed in saline solution corroborated the theoretical computation for the assessment of liver conductivity by EIT. The porcine liver in the saline tank (Figure 5A) was first imaged using a 32-electrode EIT belt without any a priori information regarding the geometry (Figure 5B). While the resulting conductivity value of 0.141 S/m was representative of the original object, the geometry of the imaged liver did not closely resemble that of the physical liver. In Figure 5C, a priori information regarding the boundary of the liver was included in the computation, resulting in an enhanced EIT image. Thus, this study revealed the importance of obtaining approximate liver geometry from imaging modalities, such as MRI or computed tomography (CT), for improving EIT output.
In vitro validation. (A) A porcine liver was placed in a saline tank with 32 equidistant circumferentially positioned electrodes. (B) The porcine liver conductivity map was computed without any a priori information. (C) The liver conductivity map was enhanced by assigning a pre-defined region within the image space to mimic the liver geometry.
EIT of Fat-Fed New Zealand White Rabbits
EIT measurements were performed on six age- and gender-matched NZW rabbits (3 on normal and 3 on high-fat diets). A 32-electrode belt was positioned around the abdomen where the liver was demarcated as described in the Methods. Conductivity values were computed following the EIT measurements (Figure 6A, B), demonstrating a significant difference between the normal and fat-fed groups (p = 0.003 vs. normal, n=3) (Figure 6C). As shown in the photographed images of the rabbits following dissection (Figure 2C, D), the liver was positioned towards the center of the abdominal cavity following post-mortem dissection as described in the Methods. The altered anatomical location contributed to the shifting liver position in the obtained EIT images.
EIT liver imaging in NZW rabbits. The upper abdomen of the age-matched male NZW rabbits (n=3 for control and n=3 for high-fat diet) was wrapped around with a belt embedded with 32 equally positioned electrodes. (A & B) Comparison between normal and high-fat-fed NZW rabbits showed the distinct EIT output, with higher conductivity in the normal diet-fed rabbits and lower conductivity in the high-fat-fed rabbits. (C) Statistical analysis indicated significant differences in the average conductivities between the normal and high-fat diet rabbits (p < 0.03 vs. normal diet, n=3). (D & E) Gross histology was assessed using H&E staining of the cross-section of liver at which the electrode belt was positioned to acquire the EIT measurement. The normal diet-fed liver revealed healthy hepatocytes, whereas the high-fat diet-fed liver developed prominent intracellular fat droplets.
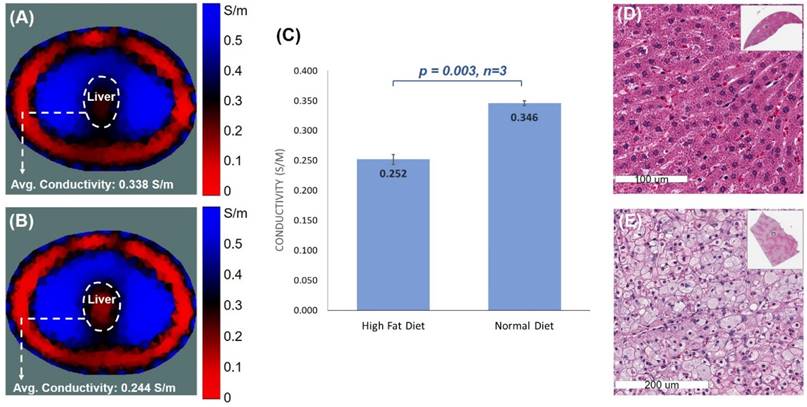
Histopathological analysis validated histological difference between the healthy and high-fat livers (Figure 6). Fat-fed animals developed an enlarged liver (Figure 2D). Unlike the normal-appearing hepatocytes-polygonal cells with a central vesicular nucleus and abundant pink cytoplasm (Figure 6D), a significant accumulation of fat in the fat-fed livers was evidenced by intrahepatic lipid droplets (Figure 6E).
Comparison between EIT and MRI-Based Fat Volume Fraction Maps
The real-time EIT images (Figure 7A, B) were reconstructed with a priori MRI-acquired boundary conditions (Figure 3C, D), including (1) the overall geometric boundary of the abdominal cross-sections, (2) distribution of skin and subcutaneous fat in the periphery of the abdomen, and (3) relative location of the organs within the abdomen. The conductivity value of the skin/fat region was set to be 0.1 S/m for the reconstruction (red region in Figure 7A, B) and the conductivity value within the liver (dotted area in Figure 7A, B) was set to be of a uniform value. The average conductivity of liver was computed to be 0.331 S/m for the subject with low BMI in Figure 7A and 0.286 S/m for high BMI in Figure 7B.
EIT vs. MRI Fat Volume Fraction. Images were collected from the low (top row) and high BMI subjects (bottom row). (A & B) are the representative MRI images from the two subjects. (C & D) The corresponding EIT images were compared between low and high BMI. (E & F) The computed FVF values were also compared with the EIT measures. (G) Bar graph demonstrating a decrease in conductivity in the high BMI subject. (H) Bar graph demonstrating an increase in FVF value in the high BMI subject.
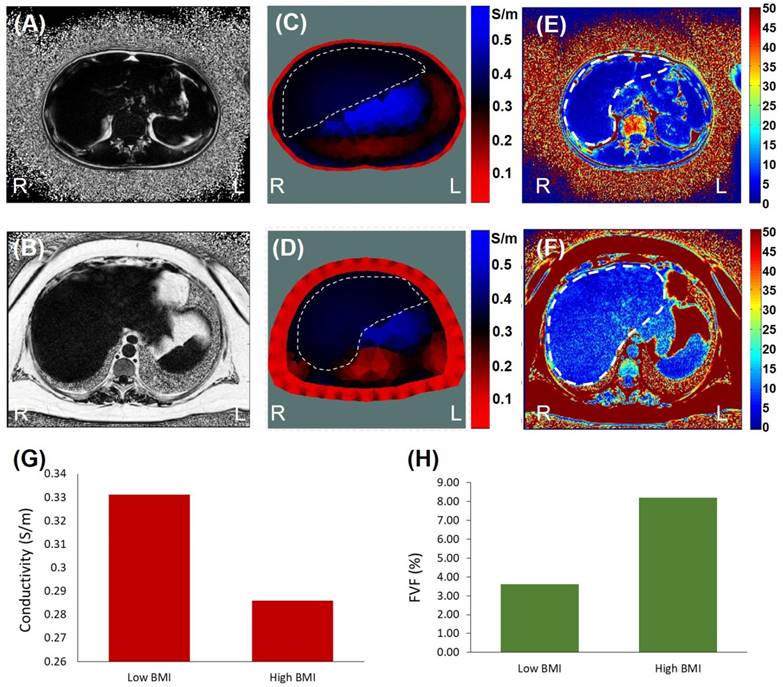
Quantification of fatty infiltrate by MRI-estimated FVF was consistent with the EIT findings (Figure 7C, D). The FVF for the subject with low BMI was computed to be 3.6%, and the FVF for the subject with high BMI was 8.2%. Individuals with more than 5-15% liver fat content are generally considered to have mild to moderate steatosis or fatty liver [44].
Discussion
The presented multi-scale studies demonstrated a non-invasive and portable electrical impedance tomography (EIT) system for the detection of hepatic fat content with clinical relevance to monitoring obese individuals at risk for fatty liver disease. We provided the theoretical basis using FEM by demonstrating decremental conductivity in response to incremental liver lipid content. In addition, we performed experimental studies to test our reconstruction algorithm as a fundamental step in applying EIT for assessing liver lipid content. The ex vivo study of a porcine liver demonstrated the importance of obtaining a priori information to enhance the spatial resolution of the EIT output. The NZW rabbit studies paved the way to distinguishing liver average conductivity in response to normal vs. high-fat diet. The preliminary human correlation further differentiated liver conductivity between low vs. high BMI subjects.
Unlike the FEM simulation (Figure 4) and the ex vivo porcine study (Figure 5), EIT in the fat-fed NZW rabbit studies lacked a priori information regarding the boundary geometry of the abdomen as well as the liver location, size, and shape. This information would strengthen the spatial resolution of EIT. Furthermore, the liver position was moved to the central position in the abdominal cavity in our post-mortem rabbits, reflecting a shift in the EIT image (Figure 6). Nevertheless, EIT was able to quantify a significant decrease in liver conductivity in the high-fat-fed NZW rabbits.
The preliminary human BMI correlation provided the basis to apply EIT for quantifying liver lipid content in healthy vs. obese subjects. Simultaneous MRI and EIT measurements demonstrated (1) the improvement in EIT spatial resolution via a priori information acquired by MRI, and (2) the correlation between EIT and MRI quantification for FVF values. Thus, this preliminary human study provides the translational implication for further characterizing EIT as a non-invasive and portable marker for assessing liver lipid content.
Optimizing EIT would strengthen the translational implications for detecting fatty liver disease. Achieving the absolute conductivity values with the non-linear inverse problem of EIT remains an experimental impediment to enhancing the imaging resolution [53]. Developing a reliable reconstruction algorithm for EIT would require a forward model to capture the detailed information about the target objects (such as the liver) except for the internal conductivity distribution. This forward model requires knowledge of the boundary geometry and electrode positions in the presence of other sources of systematic artifacts in the measured data. In light of the high sensitivity of the inverse problem to modeling errors (e.g., boundary geometry and electrode position errors) [53], the reconstructed images would be compromised as compared to the genuine target objects.
Addressing the non-linear inverse problem for EIT would mitigate the imaging errors. In the case of the ex vivo swine model, the geometric shape and relative position of the liver were well-demarcated in the presence of homogeneous saline solution. Thus, an accurate conductivity map was readily achieved. In the case of the NZW rabbit model and human studies, EIT was confounded by the lack of precise geometry and position of the liver in the presence of heterogeneous conductivities from other organ systems. In addition, the epidermal and subcutaneous adipose layer introduced electrode-tissue impedance to potentially attenuate the penetration of electrical current into the internal organs. Nevertheless, our preliminary human correlation with MRI provides the basis to overcome these challenges by demonstrating improved resolution compared to our NZW rabbit studies. To translate to clinical applications, we would establish a non-invasive gold standard, such as MRI scanning, for the a priori information at an initial time point for subsequent EIT for monitoring. To perform low-cost outpatient screening without an initial scan, we may calibrate the a priori information on the basis of age-, gender-, race- and BMI-matched data [5].
A host of methods have been implemented to mitigate imaging errors from the EIT inverse problem [54]. Improvements in the co-registration of EIT with other imaging modalities, such as MRI, would enhance the EIT imaging outcomes [55-57]. Investigators have also proposed the use of magnetic resonance electrical impedance tomography (MREIT), in which externally injected current induces internal magnetic flux density information to provide geometric information [33]. Another method to improve the spatial resolution would be the introduction of ultrasonic vibration of the target tissue in the presence of magnetic field. This methodology would result in inductive currents within the object (i.e., Lorentz Force EIT [58]), leading to potentially high spatial resolution without a priori information on object geometry and location.
To enhance spatial resolution for the ill-posed inverse problem, investigators have further proposed to optimize the reconstruction algorithm via a paradigm shift from the conventional Gauss-Newton methods for solving EIT [59]. For instance, a reconstruction method based on the particle swarm optimization (PSO) has been utilized for fast convergence and high spatial resolution [60]. Furthermore, solution candidates for the PSO algorithm obtained through the non-blind search have been demonstrated to further strengthen the imaging quality [61]. Moreover, artificial neural network for post-imaging processing has allowed for auto-segmentation of the target organs to effectively address the inverse problem as compared to the conventional algorithms [62].
While the EIT images in our studies correctly detected relative liver lipid content, the sensitivity and specificity of EIT measurements require further characterization. In the case of animal studies, EIT would be calibrated to the dose-dependent response to high-fat diet in terms of gross histology, liver weight, and fat content. In the case of future human studies, EIT would be correlated to the MRI-based FVF values in the context of subjects' clinical information. Our current experimental framework provides the basis to further address sensitivity and specificity. Furthermore, while we were able to reproduce EIT liver conductivity in our multi-scale studies for proof-of-concept, our current data was limited by small numbers of animal models and human subjects. In future work, we plan to power the numbers of animal models and human subjects for confirmation of statistical significance and to include inter- and intrapersonal variability. Specifically, we would power the animal or human numbers to n > 8 per experimental condition [63], and we would perform EIT measurements by > 2 observers for each experimental condition. These studies would be essential to demonstrate whether our non-invasive EIT approach would enable non-expert operators to perform EIT measurements in an outpatient setting for screening and monitoring.
Overall, we developed the theoretical framework to demonstrate a non-invasive EIT strategy for detecting fatty liver in both animal and human subjects. Despite the absence of a priori information on the shape and position of the liver for optimal resolution, EIT holds promises as a low-cost screening marker in the outpatient setting and as a periodic monitoring tool for individuals at high risk for non-alcoholic fatty liver disease (NAFLD). The integration of a baseline MRI scan with EIT system further optimizes a priori information for solving the non-linear inverse problem for the reconstruction algorithm. Thus, our fundamental studies pave the way to enhance the EIT spatial resolution as a potentially wearable device for remote detection of fatty liver.
Supplementary Material
Supplementary figures.
Abbreviations
NAFLD: nonalcoholic fatty liver disease; MRI: magnetic resonance imaging; EIT: electrochemical impedance tomography; FEM: finite element model; BMI: body mass index; CT: computed tomography; US: abdominal ultrasound; AC: alternating current; EIS: electrical impedance spectroscopy; LDL: low-density lipoprotein; NZW: New Zealand white; FVF: fat volume fraction; GN: Gauss-Newton; EIDORS: Diffuse Optical Tomography Reconstruction Software; SNR: signal-to-noise ratio; H&E: hematoxylin and eosin; VIBE: volumetric interpolated breath-hold examination; PSO: particle swarm optimization.
Acknowledgements
This study was supported by NIH R01HL083015 (T.K.H.), R01HL118650 (T.K.H.), R01HL111437 (T.K.H.), U54 EB0220002 (T.K.H., A.B.), R01NR014669 (M.W. and R.K.), American Heart Association 16SDG30910007 (R.R.S.P.), UCLA MSTP program (P.A.), and UCLA David Geffen Scholarship (P.A.).
Competing Interests
The authors have declared that no competing interest exists.
References
1. Ogden CL, Carroll MD, Fryar CD, Flegal KM. Prevalence of Obesity Among Adults and Youth: United States, 2011-2014. NCHS Data Brief [Internet]. 2015(219):1-8
2. Fabbrini E, Sullivan S, Klein S. Obesity and nonalcoholic fatty liver disease: Biochemical, metabolic, and clinical implications. Hepatology. 2010;51:679-89
3. Marchesini G, Bugianesi E, Forlani G, Cerrelli F, Lenzi M, Manini R, Natale S, Vanni E, Villanova N, Melchionda N, Rizzetto M. Nonalcoholic fatty liver, steatohepatitis, and the metabolic syndrome. Hepatology. 2003;37(4):917-23
4. National Institutes Of Health. Clinical guidelines on the identification, evaluation, and treatment of overweight and obesity in adults: the evidence report. Obes Res. 1998;6:51S-209S
5. Pagadala MR, McCullough AJ. Editorial: non-alcoholic Fatty liver disease and obesity: not all about body mass index. Am J Gastroenterol. 2012;107:1859-61
6. Chen J, Talwalkar JA, Yin M, Glaser KJ, Sanderson SO, Ehman RL. Early detection of nonalcoholic steatohepatitis in patients with nonalcoholic fatty liver disease by using MR elastography. Radiology [Internet]. 2011;259(3):749-56
7. Mishra P, Younossi ZM. Abdominal Ultrasound for Diagnosis of Nonalcoholic Fatty Liver Disease (NAFLD). Am J Gastroenterol. 2007;102(12):2716-7
8. Yu F, Dai X, Beebe T, Hsiai T. Electrochemical impedance spectroscopy to characterize inflammatory atherosclerotic plaques. Biosens Bioelectron. 2011;30(1):165-73
9. Aroom KR, Harting MT, Cox CS, Radharkrishnan RS, Smith C, Gill BS. Bioimpedance Analysis: A Guide to Simple Design and Implementation. J Surg Res. 2009;153(1):23-30
10. Bayford RH. BIOIMPEDANCE TOMOGRAPHY (ELECTRICAL IMPEDANCE TOMOGRAPHY). Annu Rev Biomed Eng [Internet]. 2006;8(1):63-91
11. Yu F, Li R, Ai L, Edington C, Yu H, Barr M, Kim ES, Hsiai TK. Electrochemical impedance spectroscopy to assess vascular oxidative stress. Ann Biomed Eng. 2011;39(1):287-96
12. Streitner I, Goldhofer M, Cho S, Thielecke H, Kinscherf R, Streitner F, Metz J, Haase KK, Borggrefe M, Suselbeck T. Electric impedance spectroscopy of human atherosclerotic lesions. Atherosclerosis. 2009;206(2):464-8
13. Süselbeck T, Thielecke H, Köchlin J, Cho S, Weinschenk I, Metz J, Borggrefe M, Haase KK. Intravascular electric impedance spectroscopy of atherosclerotic lesions using a new impedance catheter system. Basic Res Cardiol. 2005;100(5):446-52
14. Packard RRS, Zhang X, Luo Y, Ma T, Jen N, Ma J, Demer LL, Zhou Q, Sayre JW, Li R, Tai Y-C, Hsiai TK. Two-Point Stretchable Electrode Array for Endoluminal Electrochemical Impedance Spectroscopy Measurements of Lipid-Laden Atherosclerotic Plaques. nnals Biomed Eng. 2016;44(9):2695-706
15. Packard RRS, Luo Y, Abiri P, Jen N, Aksoy O, Suh WM, Tai Y-C, Hsiai TK. 3-D electrochemical impedance spectroscopy mapping of arteries to detect metabolically active but angiographically invisible atherosclerotic lesions. Theranostics. 2017:7 (9)
16. Hessheimer AJ, Parramón D, Guimerà A, Erill I, Rimola A, García-Valdecasas JC, Villa R, Fondevila C. A rapid and reliable means of assessing hepatic steatosis in vivo via electrical bioimpedance. Transplantation [Internet]. 2009;88(5):716-22
17. Smith PP, You F, Vogel T, Silva M. A bio-impedance probe to assess liver steatosis during transplant surgery. In: Proceedings of the Annual International Conference of the IEEE Engineering in Medicine and Biology Society, EMBS. 2011:4792-5
18. Brown BH, Seagar AD. The Sheffield data collection system. Clin Phys Physiol Meas Physiol Meas [Internet]. 1987;8(Suppl A):91-7
19. Wilkinson JN, Thanawala VU. Thoracic impedance monitoring of respiratory rate during sedation - Is it safe? Anaesthesia. 2009;64:455-6
20. Brown BH. Impedance pneumography. WO 1997020499 A1. 1997
21. Pikkemaat R, Lundin S, Stenqvist O, Hilgers R-D, Leonhardt S. Recent advances in and limitations of cardiac output monitoring by means of electrical impedance tomography. Anesth Analg [Internet]. 2014;119(1):76-83
22. Zlochiver S, Freimark D, Arad M, Adunsky A, Abboud S. Parametric EIT for monitoring cardiac stroke volume. Physiol Meas [Internet]. 2006;27(5):S139-46
23. Brown B. Electrical impedance tomography (EIT): a review. J Med Eng Technol. 2003;27(3):97-108
24. Isaacson D, Cheney M, Newell J. Comments on reconstruction algorithms. Clin Phys Physiol Meas. 1992;13:83-9
25. Krautblatter M, Hauck C. Electrical resistivity tomography monitoring of permafrost in solid rock walls. J Geophys Res Earth Surf. 2007:112 (2)
26. Bolton GT, Bennett M, Wang M, Qiu C, Wright M, Primrose KM, Stanley SJ, Rhodes D. Development of an electrical tomographic system for operation in a remote, acidic and radioactive environment. Chem Eng J. 2007;130(2-3):165-9
27. Rücker C, Günther T, Spitzer K. Three-dimensional modelling and inversion of dc resistivity data incorporating topography - I. Modelling. Geophys J Int. 2006;166(2):495-505
28. Heinrich S, Schiffmann H, Frerichs A, Klockgether-Radke A, Frerichs I. Body and head position effects on regional lung ventilation in infants: An electrical impedance tomography study. Intensive Care Med. 2006;32(9):1392-8
29. Adler A, Amato MB, Arnold JH, Bayford R, Bodenstein M, Böhm SH, Brown BH, Frerichs I, Stenqvist O, Weiler N, Wolf GK. Whither lung EIT: Where are we, where do we want to go and what do we need to get there? Physiol Meas [Internet]. 2012;33(5):679-94
30. Calderón AP. On an inverse boundary value problem. Semin Numer Anal its Appl to Contin Phys [Internet]. 1980;25(3):65-73
31. Cheney M, Isaacson D, Newell JC. Electrical Impedance Tomography. SIAM Rev [Internet]. 1999;41(1):85-101
32. Calderón AP. On an inverse boundary value problem. Semin Numer Anal its Appl to Contin Phys. 1980;25(3):65-73
33. Birgul O, Ider YZ. Use of the magnetic field generated by the internal distribution of injected currents for electrical impedance tomography. In: Proc 9th Int Conf Elec Bio-Impedance. 1995
34. Borcea L. Electrical impedance tomography. Inverse Probl [Internet]. 2002;18(6):R99-136
35. Adler A, Boyle A, Crabb GM, Gagnon H, Grychtol B, Lesparre N, Lionheart WR. EIDORS Version 3.8. International Conference on Biomedical Applications of Electrical Impedance Tomography. Neuchâtel, Switzerland. 2015
36. Adler A, Lionheart WR. Uses and abuses of EIDORS: An extensible software base for EIT. Physiol Meas. 2006;27:S25-42
37. Schöberl J. NETGEN - An Advancing Front 2D/3D Mesh Generator Based on Abstract Rules. Comput Vis Sci. 1997;1(1):41-52
38. Lionheart WR. EIT reconstruction algorithms: pitfalls, challenges and recent developments. Physiol Meas. 2004;25(1):125
39. Sarode V, Patkar S, Cheeran AN. Comparison of 2D algorithms in EIT based image reconstruction. Int J Comput Appl. 2013:69 (8)
40. Vogel CR. Computational methods for inverse problems [Internet]. Combustion. 2002;23:183
41. Glidewell M, Ng KT. Anatomically constrained electrical impedance tomography for anisotropic bodies via a two-step approach. IEEE Trans Med Imaging. 1995;14(3):498-503
42. Murphy EK, Mahara A, Wu X, Halter RJ. Phantom experiments using soft-prior regularization EIT for breast cancer imaging. Physiol Meas. 2017;38(6):1262
43. Hasgall P, Di Gennaro F, Baumgartner C, Neufeld E, Gosselin M, Payne D, Klingenböck A, Kuster N. IT'IS Database for thermal and electromagnetic parameters of biological tissues. 2015.
44. Leporq B, Ratiney H, Pilleul F, Beuf O. Liver fat volume fraction quantification with fat and water T1 and T2* estimation and accounting for NMR multiple components in patients with chronic liver disease at 1.5 and 3.0 T. Eur Radiol [Internet]. 2013;23(8):2175-86
45. Bhati CS, Silva MA, Wigmore SJ, Bramhall SR, Mayer DA, Buckels JAC, Neil DA, Murphy N, Mirza DF. Use of Bioelectrical Impedance Analysis to Assess Liver Steatosis. Transplant Proc. 2009;41(5):1677-81
46. Adler A, Gaggero PO, Maimaitijiang Y. Adjacent stimulation and measurement patterns considered harmful. Physiol Meas [Internet]. 2011;32(7):731-44
47. Szumowski J, Coshow W, Li F, Coombs B, Quinn SF. Double-echo three-point-dixon method for fat suppression MRI. Magn Reson Med. 1995;34(1):120-4
48. Dong Z, Luo Y, Zhang Z, Cai H, Li Y, Chan T, Wu L, Li ZP, Feng ST. MR quantification of total liver fat in patients with impaired glucose tolerance and healthy subjects. PLoS One. 2014;9(10):e111283
49. Ding Y, Rao SX, Chen CZ, Li RC, Zeng MS. Usefulness of two-point Dixon fat-water separation technique in gadoxetic acid-enhanced liver magnetic resonance imaging. World J Gastroenterol. 2015;21(16):5017-22
50. Reeder SB, Sirlin CB. Quantification of liver fat with magnetic resonance imaging. Magnetic Resonance Imaging Clinics of North America. 2010;18:337-57
51. Dixon WT. Simple proton spectroscopic imaging. Radiology [Internet]. 1984;153(1):189-94
52. Ma J. Breath-hold water and fat imaging using a dual-echo two-point dixon technique with an efficient and robust phase-correction algorithm. Magn Reson Med. 2004;52(2):415-9
53. Seo JK, Woo EJ. Nonlinear Inverse Problems in Imaging. John Wiley & Sons. 2012:374 p
54. Adler A, Boyle A. Electrical Impedance Tomography: Tissue Properties to Image Measures. IEEE Transactions on Biomedical Engineering. 2017
55. Crabb MG, Davidson JL, Little R, Wright P, Morgan AR, Miller CA, Naish JH, Parker GJM, Kikinis R, McCann H, Lionheart WRB. Mutual information as a measure of image quality for 3D dynamic lung imaging with EIT. Physiol Meas. 2014;35(5):863
56. Fei P, Lee J, Packard RRS, Sereti K-I, Xu H, Ma J, Ding Y, Kang H, Chen H, Sung K, Kulkarni R, Ardehali R, Kuo C-CJ, Xu X, Ho C-M, Hsiai TK. Cardiac Light-Sheet Fluorescent Microscopy for Multi-Scale and Rapid Imaging of Architecture and Function. Sci Rep [Internet]. 2016;6(1):22489
57. Lee J, Fei P, Packard RRS, Kang H, Xu H, Baek KI, Jen N, Chen J, Yen H, Kuo CCJ, Chi NC, Ho CM, Li R, Hsiai TK. 4-Dimensional light-sheet microscopy to elucidate shear stress modulation of cardiac trabeculation. J Clin Invest. 2016;126(5):1679-90
58. Grasland-Mongrain P, Mari JM, Chapelon JY, Lafon C. Lorentz force electrical impedance tomography. IRBM. 2013 p 357-60
59. Adler A, Lionheart WRB. EIDORS: Towards a community-based extensible software base for EIT. 6th Conf Biomed Appl Electr Impedance Tomogr London, UK [Internet]. 2005:1-4
60. Zhai MC, Hu G, He W. et al. A Reconstruction Method for Electrical Impedance Tomography Using Particle Swarm Optimization. Life Syst Model Intell Comput. 6329.
61. Feitosa ARS, Ribeiro RR, Barbosa VAF, Souza RE de, Santos WP dos. Reconstruction of electrical impedance tomography images using particle swarm optimization, genetic algorithms and non-blind search. 5th ISSNIP-IEEE Biosignals and Biorobotics Conference (2014): Biosignals and Robotics for Better and Safer Living (BRC). 2014:1-6
62. Martin S, Choi CT. Electrical Impedance Tomography: A Reconstruction Method Based on Neural Networks and Particle Swarm Optimization. In: 1st Global Conference on Biomedical Engineering & 9th Asian-Pacific Conference on Medical and Biological Engineering. 2015
63. Ryan TP. Sample Size Determination and Power. 1st Editio. Wiley. 2013:401 p
Author contact
![]() Corresponding author: Tzung K. Hsiai, Departments of Medicine and Bioengineering, David Geffen School of Medicine, Henry Samueli School of Engineering & Applied Science, UCLA, Los Angeles, CA 90073. E-mail: thsiaiucla.edu. Tel: 310-825-4467
Corresponding author: Tzung K. Hsiai, Departments of Medicine and Bioengineering, David Geffen School of Medicine, Henry Samueli School of Engineering & Applied Science, UCLA, Los Angeles, CA 90073. E-mail: thsiaiucla.edu. Tel: 310-825-4467