Impact Factor
 Global reach, higher impact
Theranostics 2020; 10(26):11938-11949. doi:10.7150/thno.49451 This issue Cite
Research Paper
An immune cell infiltration-based immune score model predicts prognosis and chemotherapy effects in breast cancer
Silei Sui1,2#, Xin An2#, Caiming Xu3,4#, Zongjuan Li1#, Yijun Hua2, Geya Huang1, Sibei Sui5, Qian Long2, Yanxia Sui2, Yuqing Xiong6, Micheal Ntim7, Wei Guo1, Miao Chen2, Wuguo Deng1,2 ![]() , Xiangsheng Xiao2
, Xiangsheng Xiao2 ![]() , Man Li1
, Man Li1 ![]()
1. The Second Affiliated Hospital of Dalian Medical University; Institute of Cancer Stem Cell, Dalian Medical University, Dalian, China.
2. Sun Yat-Sen University Cancer Center, State Key Laboratory of Oncology in South China, Collaborative Innovation Center of Cancer Medicine, Guangzhou, China.
3. Department of General Surgery, The First Affiliated Hospital of Dalian Medical University, Dalian, China.
4. Institute (College) of Integrative Medicine, Dalian Medical University, Dalian, China.
5. The First People's Hospital of Yichang (People's Hospital of Three Gorges University), Yichang, Hubei, China.
6. Vagelos College of Physicians and Surgeons, Columbia University, New York, USA.
7. Department of Physiology, Dalian Medical University, Dalian, China.
#These authors contributed equally to this article.
Received 2020-6-13; Accepted 2020-9-18; Published 2020-10-25
Abstract

Background: Immune cells have essential auxiliary functions and influence clinical outcomes in cancer, with high immune infiltration being associated with improved clinical outcomes and better response to treatment in breast cancer (BC). However, studies to date have not fully considered the tumor-infiltrating immune cell (TIIC) landscape in tumors. This study investigated potential biomarkers based on TIICs to improve prognosis and treatment effect in BC.
Results: We enrolled 5112 patients for analysis and used cell type identification by estimating relative subsets of RNA transcripts (CIBERSORT), a new computational algorithm, to quantify 22 TIICs in primary BC. From the results of univariate Cox regression, 12 immune cells were determined to be significantly related to the overall survival (OS) of BC patients. Furthermore, least absolute shrinkage and selection operator (LASSO) and multivariate Cox regression analyses were applied to construct an immune prognostic model based on six potential biomarkers. By dividing patients into low- and high-risk groups, a significant distinction in OS was found in the training cohort, with 20-year survival rates of 42.6% and 26.3%, respectively. Applying a similar protocol to validation and test cohorts, we found that OS was significantly shorter in the high-risk group than in the low-risk group, regardless of the molecular subtype of BC. Using the immune score model to predict the effect of BC patients to chemotherapy, the survival advantage for the low-risk group was evident among those who received chemotherapy, regardless of the chemotherapy regimen. In evaluating the predictive value of the nomogram, a decision curve showed better predictive accuracy than the standard tumor-node-metastasis (TNM) staging system.
Conclusion: The immune cell infiltration-based immune score model can be effectively and efficiently used to predict the prognosis of BC patients as well as the effect of chemotherapy.
Keywords: tumor-infiltrating immune cells, breast cancer, CIBERSORT, immune score, prognostic
Introduction
Tumor progression is a complex process that requires interaction between cancer cells, the microenvironment, and the immune system, influencing both tumor initiation and progression [1]. Recent research suggests that immune system cells have an essential accessory role of preserving tissue integrity and function during homeostasis, infection, and noninfectious perturbations by eliminating pathogens, exerting some influence on the clinical outcomes of tumors [2, 3]. Many studies have also demonstrated that high immune infiltration is associated with improved clinical outcomes and better response to treatment in breast cancer (BC) [4-11].
Tumor-infiltrating lymphocytes (TILs) comprise a considerable part of tumor-infiltrating immune cells (TIICs). It has been shown that TILs inhibit tumor growth and correlate with improved clinical outcomes in melanoma [12, 13], colorectal cancer [14-16], and ovarian cancer [17, 18]. Additionally, higher levels of TILs are associated with better disease-free survival (DFS) and overall survival (OS) in human epidermal growth factor receptor 2-positive (HER2+) and triple-negative primary breast cancer (TNBC) [19], leading to clinical trials of several immunotherapeutic agents in TNBC [20]. Moreover, in patients with HER2-positive tumors and TNBC, TILs are also associated with a higher pathological complete response (pCR) rate following neoadjuvant therapy [9, 21].
TIICs also differentiate into tumor-associated macrophages (TAMs) and tumor-infiltrating dendritic cells (TIDCs), which can promote tumor growth and metastasis [22-24]. Therefore, it is not surprising that higher levels of TAMs and TIDCs are strongly associated with poor outcomes in BC [24-26]. However, as the immune microenvironment is complex and characterized by many immune cell networks, studies have not taken full account of the entire TIIC landscape in tumors. Accordingly, it is imperative to find potential biomarkers based on the complete TIIC landscape to improve prognosis prediction and treatment effect in BC.
Cell type identification by estimating relative subsets of RNA transcripts (CIBERSORT) is a new computational algorithm for enumerating immune cell subsets using bulk gene expression data [27]. In this study, we employed CIBERSORT to quantify 22 TIICs in primary BC. Moreover, using least absolute shrinkage and selection operator (LASSO) regression and multivariate regression analysis, we established a novel immune-based model to provide a powerful means for predicting the survival and benefits of chemotherapy in patients with BC. We further validated the prognostic model using 175 BC tumor samples based on RNA sequencing data.
Results
Gene expression profile database selection according to enrollment criteria
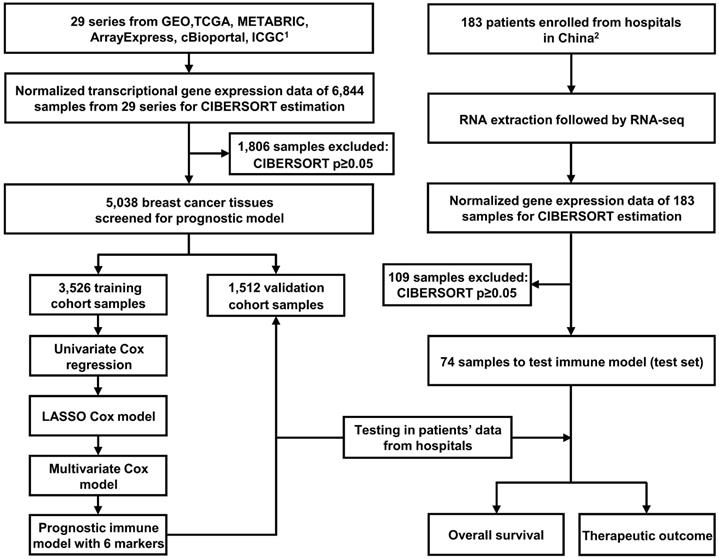
The study workflow design is depicted in Figure 1. The following databases were selected to obtain gene expression profiles of BC tissues: (1) The Cancer Genome Atlas (TCGA, https://portal.gdc.cancer.gov/), (2) Gene Expression Omnibus (GEO, https://www.ncbi.nlm.nih.gov/geo/), (3) ArrayExpress (https://www.ebi.ac.uk/arrayexpress/), (4) International Cancer Genome Consortium (ICGC, https://icgc.org/), and (5) Molecular Taxonomy of Breast Cancer International Consortium (METABRIC, the data were downloaded from cBioPortal website: http://www.cbioportal.org/). We systematically searched these databases with the term “breast cancer”. The enrollment criteria for the prognostic model were as follows: datasets containing more than 50 human primary BC samples, series presented with OS time and survival status, and transcriptome profiling as the experiment type. As indicated in Figure 1, 29 series (6,844 BC samples in total) were ultimately included for constructing the prognostic model. The studies obtained from each of the databases are summarized together with accession numbers in Table S1.
Flow chart of the study design. In total, 6,844 breast cancer samples from 29 public data series were used to perform CIBERSORT. Six immune markers were ultimately screened from LM22 to construct a prognostic immune model. The training (N = 3,526) and validation (N = 1,512) cohorts used were derived these public datasets. Another test cohort (N = 74) was from hospitals in China. Part 1. Inclusion criteria were as follows (prognostic model): (1) datasets containing more than 50 human primary BC samples; (2) series providing overall survival time and survival status; (3) transcriptome profiling as the experimental method. Part 2. Enrollment criteria were as follows: (1) pathology confirmed as primary BC following surgery; (2) complete clinical records and follow-up information available; (3) no history of other tumors; (4) informed consent.
Establishment of the prognostic immune score model
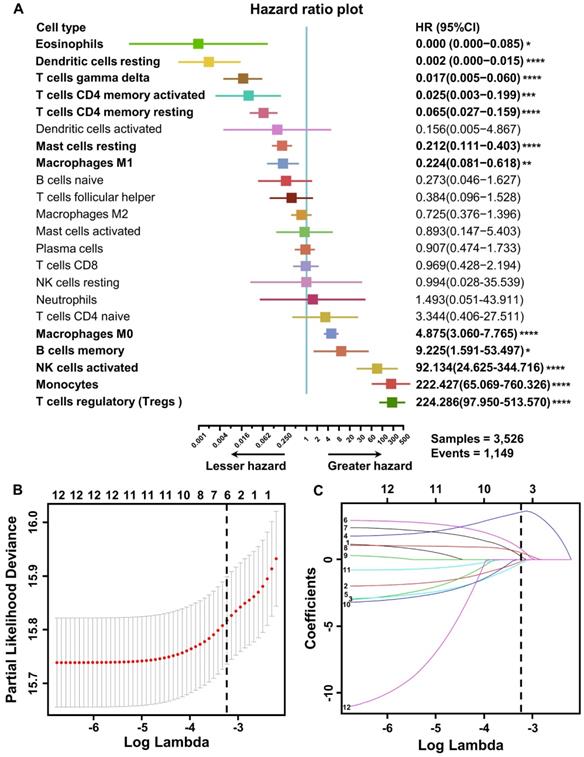
To explore the prognostic value of tumor-infiltrating immune cells, stratified sampling was used to divide 5,038 samples into a training cohort (N = 3,526, Table S2) and a validation cohort (N = 1,512, Table S2) in a ratio of 7:3. Figure 2A shows a forest plot of the associations between each immune cell subset and OS in the training cohort. According to the results of the univariate Cox hazard model, eosinophils (p = 0.015), resting dendritic cells (p < 0.0001), gamma-delta T cells (p < 0.0001), resting and activated CD4+ T cells (p < 0.0001; p = 0.0005), resting mast cells (p < 0.0001), M0 and M1 macrophages (p < 0.0001; p = 0.004), memory B cells (p = 0.013), activated NK cells (p < 0.0001), monocytes (p < 0.0001), and regulatory T cells (p < 0.0001) were significantly related to OS in BC patients. Subsequently, we performed LASSO Cox regression to select highly relevant variables from among the 12 (univariate Cox regression: p < 0.05), obtaining results of Lambda.min = 0.00115 [log (Lambda.min) = -6.766], lambda.1se = 0.0395 [log (Lambda.1se) = -3.231] (Figure 2B). Resting CD4+ T cells, regulatory T cells, gamma-delta T cells, activated NK cells, monocytes, and M0 macrophages were included when log (Lambda.1se) = -3.231 (Figure 2C). Multiple Cox regression was performed to further identify independent predictors and calculate the prognostic index. We established the formula for the prognostic immune score model according to multiple Cox regression (Risk score = regulatory T cells * 2.526 - resting CD4 T cells * 1.761 - gamma-delta T cells * 2.334 + activated NK cells * 3.408 + monocytes * 2.645 + M0 macrophages * 1.591) (Table S3), with the immune score of each sample from the training cohort calculated according to this model. Subsequently, all samples from the training cohort were divided into high- or low-risk groups using the cutoff of 0.374 [28], as determined by the OptimalCutpoints package in R. To evaluate the OS of these low- and high-risk patients, Kaplan-Meier curves were generated, and a significant distinction was observed in the training cohort (Figure 3A), regardless of the molecular subtype of BC (Figure S1). The 20-year survival rates were 37.8% and 20.0% for the low- and high-risk groups, respectively [hazard ratio (HR): 2.72, 95% confidence interval (95%CI): 2.40-3.08, p < 0.0001] (Table 1).
Construction of the prognostic immune model in the training cohort. (A) Forest plots of the univariate Cox hazard model for overall survival. Unadjusted HRs are shown with 95% confidence intervals. *p < 0.05, **p < 0.01, ***p < 0.001, ****p < 0.0001. The direction indicating less hazard favors better survival, whereas the direction indicating greater hazard favors lower survival. (B) Partial likelihood deviance for LASSO coefficient profiles. The red dots represent the partial likelihood values, the gray lines represent the standard error (SE), and the vertical dotted line is shown at the optimal values by 1 - s.e. (C) Least absolute shrinkage and selection operator (LASSO) coefficient profiles of 12 immune cells. Immune cell types: 1. memory B cell; 2. CD4 memory resting T cells; 3. memory activated T cell; 4. regulatory T cell (Treg); 5. gamma delta T cell; 6. activated NK cell; 7. monocyte; 8. M0 macrophage; 9. M1 macrophage; 10. resting dendritic cell; 11. resting mast cell; 12. eosinophil.
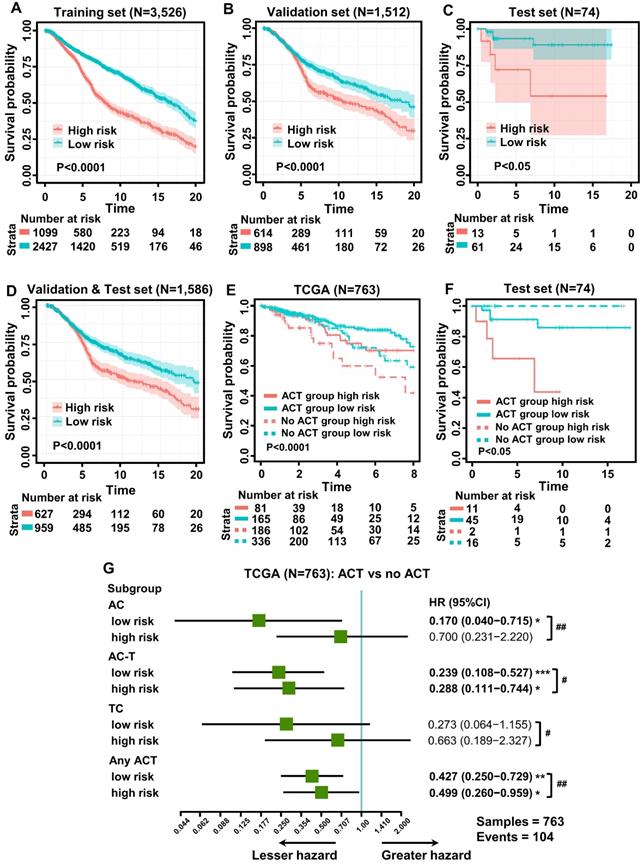
Kaplan-Meier curves of survival for low- and high-risk patients. (A) Overall survival (OS) in the training cohort. (B) OS in the validation cohort. (C) OS in the test cohort. (D) OS in the combination of validation and test cohorts. (E) Subgroup analysis of adjuvant chemotherapy (ACT) benefit for disease-free survival (DFS) of low- and high-risk patients in the TCGA database. (F) Survival analysis of neoadjuvant chemotherapy response (pCR, pathologic complete response; no pCR, including pathologic partial response, pathologic stable disease, and pathologic progression of the disease) among patients with different risk stratifications (test cohort). (G) Forest plot showing ACT benefit for DFS of low- and high-risk patients with different chemotherapy regimens in TCGA. Hazard ratios, with 95% confidence intervals, are shown for patients with ACT compared with no ACT treatment in each different risk group. ACT vs no ACT: *p < 0.05, **p < 0.01, ***p < 0.001, ****p < 0.0001. Low risk vs high risk: #p < 0.05, ##p < 0.01, ###p < 0.001, ####p < 0.0001. AC-T, anthracycline plus cyclophosphamide followed by taxane; AC, anthracycline, and cyclophosphamide; TC, taxane, and cyclophosphamide.
Results of Univariable Cox regression analysis
| Univariable Cox Regression Analysis | ||||
|---|---|---|---|---|
| Variables | Training cohort | Validation & Test cohort | ||
| HR (95%CI) | P-value | HR (95%CI) | P-value | |
| Risk score* | 2.72 (2.40-3.08) | <0.0001 | 2.10 (1.74-2.53) | <0.0001 |
| Age (>60 vs ≤60) | 1.71 (1.51-1.95) | <0.0001 | 1.45 (1.19-1.76) | 0.0002 |
| Grade (High vs Low) | 1.67 (1.45-1.92) | <0.0001 | 1.69 (1.36-2.08) | <0.0001 |
| Stage (vs stage I) | ||||
| II | 1.38 (1.13-1.68) | 0.001 | 2.16 (1.51-3.08) | <0.0001 |
| III | 2.47 (1.94-3.15) | <0.0001 | 3.24 (2.18-4.80) | <0.0001 |
| IV | 6.83 (5.30-8.81) | <0.0001 | 8.69 (5.70-13.24) | <0.0001 |
| Subtype (vs basal-like) | ||||
| HER2 | 1.22 (1.02-1.46) | 0.03 | 1.25 (0.95-1.63) | 0.11 |
| Lum A | 0.55 (0.46-0.66) | <0.0001 | 0.71 (0.54-0.93) | 0.01 |
| Lum B | 0.99 (0.84-1.16) | 0.86 | 0.99 (0.77-1.26) | 0.93 |
| Normal like | 1.13 (0.85-1.50) | 0.39 | 0.93 (0.60-1.44) | 0.74 |
*Continuous variable.
Validation of the prognostic immune score model
To evaluate the effect of this prognostic model, the same formula and prognostic immune score model were applied to the validation cohort, the test cohort (cases from hospitals in China), and the combination of the validation and test cohorts. Patients from the validation and test cohorts were grouped by the cutoff value calculated from the training set (0.374), and Kaplan-Meier curves were generated for the cohorts. Based on the results, OS was significantly shorter in the high-risk group than in the low-risk group in the validation cohort (Figure 3B), test cohort (Figure 3C), and mixed cohort (Figure 3D), regardless of the molecular type of BC (Figure S2). In addition, the 20-year survival rates were 47.8% and 30.1% for the low- and high-risk groups, respectively, (HR: 2.10, 95%CI: 1.74-2.53, p < 0.0001) in the combined validation and test cohorts (Table 1).
The prognostic immune score model predicted the effect of chemotherapy
As neoadjuvant chemotherapy (neo-ACT), as well as adjuvant chemotherapy (ACT), has been reported to be related to immune infiltration [29], we further evaluated whether the application of chemotherapy (CT) would influence the prognosis of BC. According to the NCCN Guidelines in Oncology (National Comprehensive Cancer Network, Clinical Practice Guidelines in Oncology, Breast Cancer, Version 5, 2020 https://www.nccn.org/professionals/physician_gls/default.aspx), anthracycline + cyclophosphamide (AC), AC followed by taxane (AC-T) and taxane + cyclophosphamide (TC) are major chemotherapy regimens. Information regarding the administration of CT was collected from TCGA and METABRIC datasets and hospitals in China. To evaluate the relationship between the immune score and chemotherapy effect, the same formula was applied to the cohorts from TCGA, the hospitals in China, and METABRIC. The patients of these three cohorts were divided by the cutoff value (0.374) into low- and high-risk groups, and the DFS advantage for the low-risk group was evident in all three cohorts, regardless of whether they received chemotherapy (Figure 3E-F, Figure S3). Detailed information on ACT was documented only for the cohort from TCGA. Compared with patients who did not undergo chemotherapy in the low-risk group, the survival advantage was evident in patients who received AC and AC-T chemotherapy schemes (p < 0.05; p < 0.001). In contrast, the chemotherapy benefit in the high-risk group was only observed with the AC-T chemotherapy scheme (p < 0.05, Figure 3G). More importantly, further evaluation of subgroup interaction showed that low-risk patients obtained better chemotherapy effects, regardless of the chemotherapy regimen (AC: p < 0.01; AC-T: p < 0.05; TC: p < 0.05; Figure 3G). Furthermore, we used data from the test cohort of neo-ACT to assess the association between the immune prognostic model and the effect on chemotherapy. As illustrated in Figure S4, there was a tendency toward a higher immune score in the neo-ACT-sensitive group (pCR status) than in the neo-ACT-resistant group (non-pCR status), though no significant difference was observed (p = 0.129).
The nomogram system improved the prognostic immune score model
Univariable Cox regression analysis was performed to select independent clinicopathologically prognostic factors for OS, and the results showed significant relationships for age, tumor grade and tumor-node-metastasis (TNM) stage (Table 1). Subsequent multivariable Cox regression analysis showed that risk score, age, tumor grade, and TNM stage were independent prognostic factors for OS (Table 2). To create a quantitative method to predict OS, we integrated the immune score and independent clinicopathological prognostic factors, including age, tumor grade, and TNM stage, to construct a nomogram (Figure 4A).
Results of Multivariable Cox regression analysis
| Multivariable Cox Regression Analysis | ||||
|---|---|---|---|---|
| Variables | Training cohort | Validation & Test cohort | ||
| HR (95%CI) | P-value | HR (95%CI) | P-value | |
| Risk score* | 1.62 (1.24-2.11) | 0.0004 | 1.40 (1.02-1.91) | 0.04 |
| Age (≥60 vs <60) | 1.49 (1.24-1.80) | <0.0001 | 1.82 (1.35-2.46) | 0.0001 |
| Grade (High vs Low) | 1.30 (1.06-1.60) | 0.01 | 1.43 (1.04-1.98) | 0.03 |
| Stage (vs stage I) | ||||
| II | 1.27 (1.02-1.60) | 0.03 | 1.98 (1.31-2.98) | 0.001 |
| III | 2.86 (2.06-3.98) | <0.0001 | 2.80 (1.66-4.69) | 0.0001 |
| IV | 3.40 (2.26-5.12) | <0.0001 | 5.25 (2.76-9.98) | <0.0001 |
| Subtype (vs basal-like) | ||||
| HER2 | 1.31 (0.99-1.74) | 0.05 | 1.44 (0.97-2.14) | 0.07 |
| LumA | 0.97 (0.73-1.30) | 0.86 | 1.40 (0.88-2.23) | 0.15 |
| LumB | 1.14 (0.88-1.49) | 0.32 | 1.17 (0.79-1.73) | 0.44 |
| Normal like | 1.19 (0.77-1.83) | 0.43 | 1.17 (0.64-2.14) | 0.60 |
*Continuous variable.
Construction of the nomogram system. (A) Nomogram predicting 5-, 10-, and 20-year overall survival for breast cancer patients in the training cohort based on immune score and other clinicopathological parameters. (B) The calibration curves of nomograms between predicted and observed 5-, 10- and 20-year OS in the training cohort. The dashed line of 45° represents the perfect prediction of the nomogram. (C) Decision curves of nomogram and TNM stage for 5-, 10- and 20-year outcome in the training cohort.
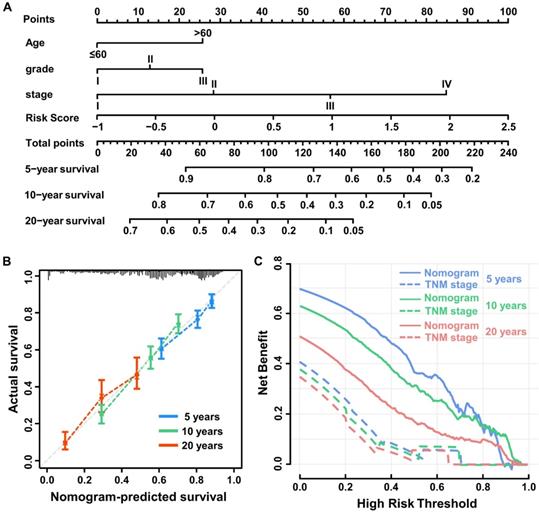
To evaluate the predictive value of the nomogram, we compared Harrell's concordance index (C-index) of the nomogram with standard TNM staging in the training, validation, and test cohorts, and as shown in Table 3, the nomogram system improved the prognostic model of BC in all. Based on calibration plots, the predicted 5-, 10-, and 20-year survival probabilities of the nomogram performed well in both the training and validation cohorts (Figure 4B). Similarly, the decision curve showed better predictive accuracy than the standard TNM staging system (Figure 4C).
Harrell's concordance indexes of TNM stage and nomogram system
| Cohort | C-index (95%CI) | |
|---|---|---|
| TNM stage | Nomogram | |
| Training | 0.630 (0.619-0.640) | 0.665 (0.653-0.677) |
| Validation | 0.674 (0.657-0.691) | 0.691 (0.663-0.719) |
| Test | 0.512 (0.466-0.557) | 0.885 (0.823-0.947) |
The prognostic immune score model predicted the clinical characteristics of breast cancer patients
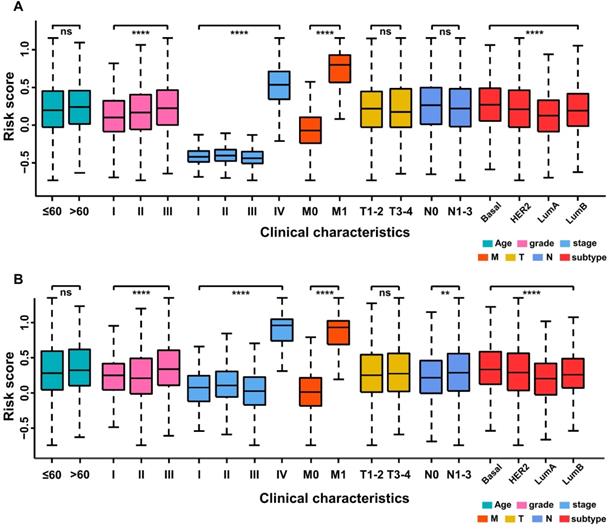
The relationship between the prognostic immune score and clinical characteristics was further investigated in the training and validation cohorts. In the former, the grade level (p < 0.0001), TNM stage (p < 0.0001), M category (p < 0.0001) and molecular subtype of BC (p < 0.0001) were significantly related to immune score, whereas age, T category and N category were not (Figure 5A). In the validation cohort (Figure 5B), a high immune score was positively associated with tumor grade (p < 0.0001), TNM stage (p < 0.0001), M category (p < 0.0001), N category (p < 0.01) and molecular subtype of BC (p < 0.0001).
Stratified analysis of clinical characteristics for the immune score of the immune prognostic model. (A) Training cohort. (B) Validation cohort.
The prognostic immune score model predicted differential expression of genes involved in T-cell signal transduction, immune checkpoint, inflammation and EMT
The immune score of 836 TCGA samples was determined using the prognostic immune formula. All the samples were classified into low- and high-risk groups using the cutoff of 0.374. Gene-set enrichment analysis (GSEA) indicated that the low-risk group was highly enriched in activation of the T cell receptor signaling pathway, antigen receptor-mediated signaling pathway, immunoglobulin production, and activation of the immune response (Figure 6A).
Bioinformatics analysis of the characteristics and signaling pathways among patients in different risk groups. (A) Gene set enrichment analysis (GSEA) for biological pathways and processes correlated with immune score values in the cohort from TCGA. NES, normalized enrichment score; NOM p: Nominal p-value. (B) PD-1, PD-L1, and CTLA4 mRNA expression between the low- and high-risk groups in the cohort from TCGA. (C) Volcano plot showing differentially expressed genes between the low- and high-risk groups in the cohort from TCGA. Genes labeled in red or green are significantly differentially up- or downregulated, respectively. FC: fold change; FDR: false discovery rate. (D) Gene Ontology analysis of the differentially expressed genes (DEGs). ECM: extracellular matrix; ECS: extracellular structure. GPCR: G Protein-Coupled Receptors.
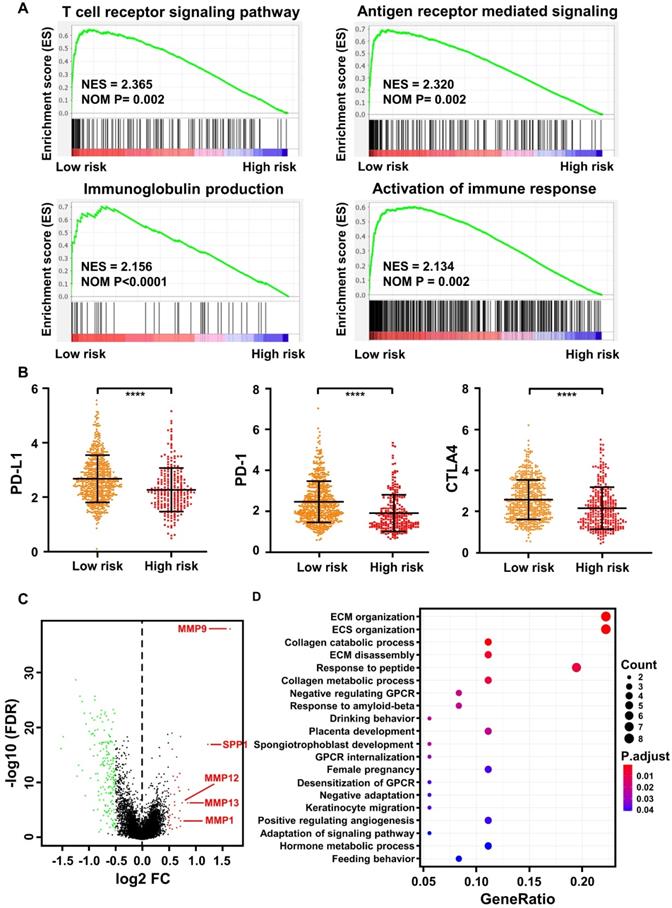
Immune checkpoint blockade with immunotherapies, such as CTLA-4, PD-1, and PD-L1, has been proposed to be a promising approach to treat a variety of malignancies [38]. Thus, we determined the expression level of several key immune checkpoint regulators as well as inflammatory mediators. As presented in Figure 6B, CTLA-4, PD-1, and PD-L1 expression was significantly higher in the low-risk group (p < 0.0001). In addition, other important immunomodulators or inflammatory mediators were increased in the low-risk group, including LAG3 (p < 0.0001), IL12A (p < 0.01), IL12B (p < 0.0001), IL6 (p < 0.05), IFNG (p < 0.0001), IDO1 (p < 0.0001), GZMB (p < 0.0001), and CD47 (p < 0.01) (Figure S5).
As a significant correlation between the M stage and immune score was observed in the training (Figure 5A) and validation (Figure 5B) cohorts, we further analyzed differentially expressed genes (DEGs) between the low- and high-risk groups in the cohort from TCGA. A total of 218 DEGs (38 upregulated and 180 downregulated genes, FDR p-value <0.05, Table S4) were identified in the high-risk group compared with the low-risk group. Among them, epithelial-mesenchymal transformation (EMT) markers such as MMP9, SPP1, MMP12, MMP13, and MMP1 were significantly overexpressed in the high-risk group (FDR p-value < 0.05, log FC>0.5, Figure 6C). Furthermore, according to Gene Ontology (GO) enrichment analysis, the genes in the high-risk group are mainly involved in extracellular matrix organization, extracellular structure organization, collagen catabolic process, collagen metabolic process, and extracellular matrix disassembly (Figure 6D).
Discussion
The immune environment that surrounds cancer tissues can detect these tissues and inhibit their growth [30]. In BC in particular, it has been reported that high levels of immune infiltration are associated with good clinical outcomes [4]. In this study, we used CIBERSORT, which uses algorithm that well accommodates a large number of tumor samples that have been profiled by RNA sequencing, to estimate the proportion of immune cells in BC. This approach provides an alternative to flow or mass cytometry-based methods, and the cumbersome techniques of immunostaining are circumvented. CIBERSORT can also utilize archived RNA and cellular samples [27]. Previous studies have validated the efficacy of the CIBERSORT technique in identifying a specific immune subset, which is a vast improvement over other techniques with very limited abilities [31-33]. Additionally, LASSO regression was applied to construct an immune cell infiltration score model, a model capable of predicting near accurate survival times, as used in previous studies [34, 35]. This immune score model is a novel prognostic tool designed to improve survival prediction after BC diagnosis. In this study, the immune score model was based on 22 immune cells, of which 12 showed a significant hazard ratio.
Moreover, the prognostic value of the immune score model was confirmed in training and validation cohorts. Our results showed a distinct separation of OS curves between patients who had high and low immune scores. In addition, the immune score was able to predict survival in the groups of patients, similar to TNM staging, indicating that such a model can be used for prognosis and may complement the existing TNM staging method.
Sufficient correlation between the immune score and expression of known inflammatory mediators such as PD-L1, CTLA-4, and LAG3 further supports its potential value [36, 37]. The survival probability in the training, validation and test cohorts revealed significantly decreased survival. It has been observed that the immune score's predictive value may be suitable for large-scale data, and statistical significance was observed when the validation and test cohorts were combined.
According to the nomogram that included the immune score with TNM stage, a significant prognostic value was obtained by the combination compared to TNM stage alone. This is an indication that for prognosis, the immune score might be used to reinforce the prognostic ability of the TNM method. Indeed, the immune score value was verified in the nonoverlapping, validation cohort and in the test cohort, an indication of its utility in BC.
Adjuvant or neo-ACT is now regarded as the gold standard for the treatment of patients with stage II or III BC [38, 39]. Nonetheless, candidates still face the challenge as to the selection criteria that are likely to be beneficial, and this remains a controversy. Many studies have assessed the connection between TILs and how efficient they are with ACT [40-42]. Another study emphasized that high infiltration of immune cells contributes to an increased response to neo-ACT and ACT, and the use of chemotherapy to stimulate an anticancer immune response has been reported [43]. Recently, a clinical trial found that the induction of chemotherapy in TNBC causes a favorable tumor immunologic microenvironment and increases sensitivity to PD-1 blockade [44]. In another study by Wesolowski et al., the authors concluded that neo-ACT influences the immune microenvironment by downregulating CD4+ and upregulating CD8+ cells, which leads to a reduction in the number of TILs and CD8+ T cells in breast cancer samples [45]. These reports are consistent with our present observations, as we observed a statistically significant potential link with chemotherapy for the METABRIC cohort. In contrast, no statistical significance was detected for the test cohort, which may be due to the small sample size as well as the difficulty in setting an optimum cutoff value. Previous studies have reported that chemotherapy sensitivity may be related to levels of lymphocyte infiltration into the tumor [46, 47]. A possible mechanism involves the secretion of interferons by lymphocytes, which can sensitize cells to chemotherapy [48]. In this study, levels of inflammatory mediators such as CTLA-4, PD-1, and PD-L1 were significantly higher in the lower-risk group. Some studies have, however, reported contrary results, whereby an increase in CTLA-4, PD-1, and PD-L1 has been associated with worse outcomes in cancer [49, 50]. It is therefore important to verify this observation in a much broader database and in clinical samples. A similar trend for other critical immunomodulators or inflammatory mediators, such as LAG3, IL12A, IL12B, IL6, IFNG, IFNA1, IFNA2, IDO1, GZMB and CD47, was observed, with significantly higher expression in the low-risk group. This finding supports that interferon secretion might participate in the biological process of chemotherapy sensitization in BC patients with a low immune score. Innate and adaptive immunity may also be activated by immunogenic tumor cell death [51].
Although this study provides important evidence on the use of the immune score model in the prognosis of BC, it has some shortcomings. The study relied on retrospective data and might have missed some important information for each patient. For instance, anti-inflammatory drug use and the possible presence of any immune disorder that has a significant effect on the progression of the disease might have been examined, which hitherto have been excluded [52, 53]. There is also difficulty in using a standardized cutoff for interpreting immune infiltration. Another important shortcoming is that the test cohort involved primary tumor tissues, whereas a good proportion of patients from publicly available gene expression datasets are analyzed with regard to metastatic sites, introducing some level of heterogeneity in the data and affecting the applicability of the nomogram in clinical practice. When considering the role of lymph nodes in the metastasis of BC, there is a need to consider the margin of a possible invasion of cancer in analyses. The gene expression profiles utilized were derived from a sample of the tumor tissues, with an associated impossibility of accounting for the location of immune cells, which should be considered in the model of the immune score. More data need to be collected prospectively to further validate these outcomes. Nevertheless, understanding the tumor immune microenvironment using the immune score provides important insight that will improve the diagnosis and prognosis of patients with BC.
Methods
Study population and gene expression profiling
The specimens for the test cohort were collected with the approval of hospitals in China. A total of 183 patients with BC who underwent synchronous neoadjuvant radiotherapy and chemotherapy (anthracycline + cyclophosphamide followed by taxane, AC-T) followed by mastectomy between 2002 and 2012 were included based on the following criteria: (1) pathology confirmed as primary BC following surgery; (2) complete clinical records and follow-up information available; (3) no history of other tumors; and (4) written informed consent. The exclusion criteria were insufficient breast tissue and insufficient clinical data regarding outcomes. We used the International Union against Cancer TNM classification system (5th and 6th editions) to classify resected tissues [54]. Histological grades were classified as well-differentiated, moderately differentiated, and poorly differentiated. Clinical data were used for analysis based on ER, PR, HER2, and Ki67 expression levels. In our case, the staff members processing the clinical data were blinded to the details of the study. All patients provided written informed consent before enrolling in the study. The follow-up end date was September 30th, 2018, and the median follow-up time was 31 months.
A total of 130 core biopsy specimens and 53 surgical samples were immersed into RNAlaterTM solution (Qiagen, Germantown, MD, USA) and stored at -80 ºC until further analysis.
Estimation of immune cell type fractions
Processed gene expression data were downloaded from public databases or obtained from raw files using the MAS5.0 algorithm and normalized using the limma package in R software (version 3.5.2) [55]. To quantify the abundance of 22 TIICs in BC specimens, we applied CIBERSORT, an analytical tool, to provide an estimation of the proportions of cell types in a mixed cell population using normalized data [27]. To run CIBERSORT, the following packages are required in R software: “e1071”, “parallel”, and “preprocessCore”. A file called “LM22.txt”, which contains a “signature matrix” of 547 genes, in R (obtained under Menu > Download from CIBERSORT web: https://cibersort.stanford.edu/download.php) is also required [56]. The 22 types of infiltrating immune cells inferred by CIBERSORT include B cells, T cells, natural killer cells, macrophages, dendritic cells, eosinophils, and neutrophils. CIBERSORT derives a p-value for the deconvolution of each sample using Monte Carlo sampling, providing a measure of confidence in the results. At a threshold of p < 0.05, 5,038 samples of the inferred fractions of immune cell populations produced by CIBERSORT were considered accurate [10]. The proportions of immune cells were predicted in each dataset separately.
Sampling method
To improve the precision and accuracy of the prognostic model, the 5,038 samples were separated into training and validation sets in a ratio of 7:3 using stratified random sampling. Important clinical covariates, including age, molecular subtype, grade, TNM stage, and survival status, were taken into consideration to ensure equal distributions in the training and validation sets.
GSEA
The transcriptome data of 836 BCs from TCGA were selected for GSEA analysis. For the cohort from TCGA, GSEA 4.0.3 software (downloaded from https://www.gsea-msigdb.org/gsea/downlodas.jsp) was used to identify GO terms enriched between the low- and high-risk groups in the c5 GO database (c5.all.v6.2.symbols). The significance threshold was set at p < 0.05.
Statistical analysis
The Mann-Whitney U test was utilized to compare two groups and the Kruskal-Wallis test to compare multiple groups. Univariate, LASSO, and multivariate Cox regression analyses were applied to identify the most significant immune cells to build a prognostic model. Immune cells were considered significant when the p-value was <0.05 in univariate Cox regression analysis. Subsequently, we used LASSO-penalized Cox regression to filter out less relevant factors. Finally, multivariate Cox regression analysis was applied to optimize the model. The optimal cutoff values were calculated based on the association between OS and cell fraction in the training cohort using the survminer package in R. Kaplan-Meier analysis and the log-rank test were employed to evaluate correlations between the proportion of immune cells and OS. The prognostic value of the nomogram for 5, 10, and 20 years was evaluated by the c-index [57]. Results with two-sided p-values of <0.05 were considered to be statistically significant. The statistical analyses were conducted using SPSS version 25 (IBM, New York, USA) and R software (3.5.2).
Supplementary Material
Supplementary figures and tables.
Supplementary table S1.
Supplementary table S4.
Acknowledgements
We are grateful to the patients and sample donors for their dedicated participation in the current study.
Funding
This work was supported by funds from the National Natural Science Foundation of China (81902681, 81773279, 81872156, 81972569, 81772925).
Availability of data and materials
The datasets or codes used and/or analyzed during the current study are available from the corresponding author on reasonable request.
Author contributions
SS, XA, CX, ZL equally contributed to this work. SS, AX, XX, ML and WD designed the study. SS, XA, CX, ZL, YH, GH, SS, QL, YS, YS, MN, WG, MC and XX performed the experiments and data interpretation. SS, CX, MN, ML, XX and WD wrote and edited the manuscript. All authors read and approved the final manuscript.
Competing Interests
The authors have declared that no competing interest exists.
References
1. Chen DS, Mellman I. Elements of cancer immunity and the cancer-immune set point. Nature. 2017;541:321-30
2. Fan X, Rudensky AY. Hallmarks of Tissue-Resident Lymphocytes. Cell. 2016;164:1198-211
3. Galon J, Costes A, Sanchez-Cabo F, Kirilovsky A, Mlecnik B, Lagorce-Pagès C. et al. Type, density, and location of immune cells within human colorectal tumors predict clinical outcome. Science. 2006;313:1960-4
4. Manuel M, Tredan O, Bachelot T, Clapisson G, Courtier A, Parmentier G. et al. Lymphopenia combined with low TCR diversity (divpenia) predicts poor overall survival in metastatic breast cancer patients. Oncoimmunology. 2012;1:432-40
5. Papatestas AE, Lesnick GJ, Genkins G, Aufses AH Jr. The prognostic significance of peripheral lymphocyte counts in patients with breast carcinoma. Cancer. 1976;37:164-8
6. Adams S, Gray RJ, Demaria S, Goldstein L, Perez EA, Shulman LN. et al. Prognostic value of tumor-infiltrating lymphocytes in triple-negative breast cancers from two phase III randomized adjuvant breast cancer trials: ECOG 2197 and ECOG 1199. J Clin Oncol. 2014;32:2959-66
7. Ali HR, Provenzano E, Dawson SJ, Blows FM, Liu B, Shah M. et al. Association between CD8+ T-cell infiltration and breast cancer survival in 12,439 patients. Ann Oncol. 2014;25:1536-43
8. Loi S, Michiels S, Salgado R, Sirtaine N, Jose V, Fumagalli D. et al. Tumor infiltrating lymphocytes are prognostic in triple negative breast cancer and predictive for trastuzumab benefit in early breast cancer: results from the FinHER trial. Ann Oncol. 2014;25:1544-50
9. Denkert C, von Minckwitz G, Brase JC, Sinn BV, Gade S, Kronenwett R. et al. Tumor-infiltrating lymphocytes and response to neoadjuvant chemotherapy with or without carboplatin in human epidermal growth factor receptor 2-positive and triple-negative primary breast cancers. J Clin Oncol. 2015;33:983-91
10. Ali HR, Chlon L, Pharoah PD, Markowetz F, Caldas C. Patterns of Immune Infiltration in Breast Cancer and Their Clinical Implications: A Gene-Expression-Based Retrospective Study. PLoS Med. 2016;13:e1002194
11. West NR, Milne K, Truong PT, Macpherson N, Nelson BH, Watson PH. Tumor-infiltrating lymphocytes predict response to anthracycline-based chemotherapy in estrogen receptor-negative breast cancer. Breast Cancer Res. 2011;13:R126
12. Dudley ME, Wunderlich JR, Robbins PF, Yang JC, Hwu P, Schwartzentruber DJ. et al. Cancer regression and autoimmunity in patients after clonal repopulation with antitumor lymphocytes. Science. 2002;298:850-4
13. Rosenberg SA, Yang JC, Sherry RM, Kammula US, Hughes MS, Phan GQ. et al. Durable complete responses in heavily pretreated patients with metastatic melanoma using T-cell transfer immunotherapy. Clin Cancer Res. 2011;17:4550-7
14. Baier PK, Wimmenauer S, Hirsch T, von Specht BU, von Kleist S, Keller H. et al. Analysis of the T cell receptor variability of tumor-infiltrating lymphocytes in colorectal carcinomas. Tumour Biol. 1998;19:205-12
15. Naito Y, Saito K, Shiiba K, Ohuchi A, Saigenji K, Nagura H. et al. CD8+ T cells infiltrated within cancer cell nests as a prognostic factor in human colorectal cancer. Cancer Res. 1998;58:3491-4
16. Diederichsen AC, Hjelmborg J, Christensen PB, Zeuthen J, Fenger C. Prognostic value of the CD4+/CD8+ ratio of tumour infiltrating lymphocytes in colorectal cancer and HLA-DR expression on tumour cells. Cancer Immunol Immunother. 2003;52:423-428
17. Sato E, Olson SH, Ahn J, Bundy B, Nishikawa H, Qian F. et al. Intraepithelial CD8+ tumor-infiltrating lymphocytes and a high CD8+/regulatory T cell ratio are associated with favorable prognosis in ovarian cancer. Proc Natl Acad Sci U S A. 2005;102:18538-43
18. Zhang L, Conejo-Garcia JR, Katsaros D, Gimotty PA, Massobrio M, Regnani G. et al. Intratumoral T cells, recurrence, and survival in epithelial ovarian cancer. N Engl J Med. 2003;348:203-13
19. Ahn SG, Jeong J, Hong S, Jung WH. Current Issues and Clinical Evidence in Tumor-Infiltrating Lymphocytes in Breast Cancer. J Pathol Transl Med. 2015;49:355-63
20. Kwa MJ, Adams S. Checkpoint inhibitors in triple-negative breast cancer (TNBC): Where to go from here. Cancer. 2018;124:2086-103
21. Ono M, Tsuda H, Shimizu C, Yamamoto S, Shibata T, Yamamoto H. et al. Tumor-infiltrating lymphocytes are correlated with response to neoadjuvant chemotherapy in triple-negative breast cancer. Breast Cancer Res Treat. 2012;132:793-805
22. Noy R, Pollard JW. Tumor-associated macrophages: from mechanisms to therapy. Immunity. 2014;41:49-61
23. Qian BZ, Pollard JW. Macrophage diversity enhances tumor progression and metastasis. Cell. 2010;141:39-51
24. Treilleux I, Blay JY, Bendriss-Vermare N, Ray-Coquard I, Bachelot T, Guastalla JP. et al. Dendritic cell infiltration and prognosis of early stage breast cancer. Clin Cancer Res. 2004;10:7466-74
25. Leek RD, Lewis CE, Whitehouse R, Greenall M, Clarke J, Harris AL. Association of macrophage infiltration with angiogenesis and prognosis in invasive breast carcinoma. Cancer Res. 1996;56:4625-9
26. Mahmoud SM, Lee AH, Paish EC, Macmillan RD, Ellis IO, Green AR. Tumour-infiltrating macrophages and clinical outcome in breast cancer. J Clin Pathol. 2012;65:159-63
27. Newman AM, Liu CL, Green MR, Gentles AJ, Feng W, Xu Y. et al. Robust enumeration of cell subsets from tissue expression profiles. Nat Methods. 2015;12:453-7
28. Zeng D, Zhou R, Yu Y, Luo Y, Zhang J, Sun H. et al. Gene expression profiles for a prognostic immunoscore in gastric cancer. Br J Surg. 2018;105:1338-48
29. Mesnage S, Auguste A, Genestie C, Dunant A, Pain E, Drusch F. et al. Neoadjuvant chemotherapy (NACT) increases immune infiltration and programmed death-ligand 1 (PD-L1) expression in epithelial ovarian cancer (EOC). Ann Oncol. 2017;28:651-7
30. Ostrand-Rosenberg S. Immune surveillance: a balance between protumor and antitumor immunity. Curr Opin Genet Dev. 2008;18:11-8
31. Fu H, Zhu Y, Wang Y, Liu Z, Zhang J, Xie H. et al. Identification and Validation of Stromal Immunotype Predict Survival and Benefit from Adjuvant Chemotherapy in Patients with Muscle-Invasive Bladder Cancer. Clin Cancer Res. 2018;24:3069-78
32. Mao Y, Feng Q, Zheng P, Yang L, Zhu D, Chang W. et al. Low tumor infiltrating mast cell density confers prognostic benefit and reflects immunoactivation in colorectal cancer. Int J Cancer. 2018;143:2271-80
33. Zhou L, Xu L, Chen L, Fu Q, Liu Z, Chang Y. et al. Tumor-infiltrating neutrophils predict benefit from adjuvant chemotherapy in patients with muscle invasive bladder cancer. Oncoimmunology. 2017;6:e1293211
34. Dai W, Feng Y, Mo S, Xiang W, Li Q, Wang R. et al. Transcriptome profiling reveals an integrated mRNA-lncRNA signature with predictive value of early relapse in colon cancer. Carcinogenesis. 2018;39:1235-44
35. Qu L, Wang ZL, Chen Q, Li YM, He HW, Hsieh JJ. et al. Prognostic Value of a Long Non-coding RNA Signature in Localized Clear Cell Renal Cell Carcinoma. Eur Urol. 2018;74:756-763
36. Zhang ML, Kem M, Mooradian MJ, Eliane JP, Huynh TG, Iafrate AJ. et al. Differential expression of PD-L1 and IDO1 in association with the immune microenvironment in resected lung adenocarcinomas. Mod Pathol. 2019;32:511-23
37. He Y, Yu H, Rozeboom L, Rivard CJ, Ellison K, Dziadziuszko R. et al. LAG-3 Protein Expression in Non-Small Cell Lung Cancer and Its Relationship with PD-1/PD-L1 and Tumor-Infiltrating Lymphocytes. J Thorac Oncol. 2017;12:814-23
38. Denduluri N, Somerfield MR, MacGregor MC, Comander AH, Dayao Z, Eisen A. et al. Selection of Optimal Adjuvant Chemotherapy and Targeted Therapy for Early Breast Cancer. ASCO Guideline Update. J Clin Oncol. 2020 JCO2002510
39. Hsieh MC, Zhang L, Wu XC, Davidson MB, Loch M, Chen VW. Population-Based Study on Cancer Subtypes, Guideline-Concordant Adjuvant Therapy, and Survival Among Women With Stage I-III Breast Cancer. J Natl Compr Canc Netw. 2019;17:676-686
40. Jang N, Kwon HJ, Park MH, Kang SH, Bae YK. Prognostic Value of Tumor-Infiltrating Lymphocyte Density Assessed Using a Standardized Method Based on Molecular Subtypes and Adjuvant Chemotherapy in Invasive Breast Cancer. Ann Surg Oncol. 2018;25:937-46
41. Ignatiadis M, Van den Eynden G, Roberto S, Fornili M, Bareche Y, Desmedt C. et al. Tumor-Infiltrating Lymphocytes in Patients Receiving Trastuzumab/ Pertuzumab-Based Chemotherapy: A TRYPHAENA Substudy. J Natl Cancer Inst. 2019;111:69-77
42. Zhang H, Liu H, Shen Z, Lin C, Wang X, Qin J. et al. Tumor-infiltrating Neutrophils is Prognostic and Predictive for Postoperative Adjuvant Chemotherapy Benefit in Patients With Gastric Cancer. Ann Surg. 2018;267:311-8
43. Chen G, Emens LA. Chemoimmunotherapy: reengineering tumor immunity. Cancer Immunol Immunother. 2013;62:203-16
44. Voorwerk L, Slagter M, Horlings HM, Sikorska K, van de Vijver KK, de Maaker M. et al. Immune induction strategies in metastatic triple-negative breast cancer to enhance the sensitivity to PD-1 blockade: the TONIC trial. Nat Med. 2019;25:920-8
45. Wesolowski R, Stiff A, Quiroga D, McQuinn C, Li Z, Nitta H. et al. Exploratory analysis of immune checkpoint receptor expression by circulating T cells and tumor specimens in patients receiving neo-adjuvant chemotherapy for operable breast cancer. BMC Cancer. 2020;20:445
46. Jiang Y, Zhang Q, Hu Y, Li T, Yu J, Zhao L. et al. ImmunoScore Signature: A Prognostic and Predictive Tool in Gastric Cancer. Ann Surg. 2018;267:504-13
47. Loi S, Sirtaine N, Piette F, Salgado R, Viale G, Eenoo F. Prognostic and predictive value of tumor-infiltrating lymphocytes in a phase III randomized adjuvant breast cancer trial in node-positive breast cancer comparing the addition of docetaxel to doxorubicin with doxorubicin-based chemotherapy: BIG 02-98. J Clin Oncol. 2013;31:860-867
48. Galluzzi L, Buqué A, Kepp O, Zitvogel L, Kroemer G. Immunological Effects of Conventional Chemotherapy and Targeted Anticancer Agents. Cancer Cell. 2015;28:690-714
49. Muenst S, Soysal SD, Gao F, Obermann EC, Oertli D, Gillanders WE. The presence of programmed death 1 (PD-1)-positive tumor-infiltrating lymphocytes is associated with poor prognosis in human breast cancer. Breast Cancer Res Treat. 2013;139:667-76
50. Zhou T, Xu D, Tang B, Ren Y, Han Y, Liang G. et al. Expression of programmed death ligand-1 and programmed death-1 in samples of invasive ductal carcinoma of the breast and its correlation with prognosis. Anticancer Drugs. 2018;29:904-10
51. Ghiringhelli F, Apetoh L. The interplay between the immune system and chemotherapy: emerging methods for optimizing therapy. Expert Rev Clin Immunol. 2014;10:19-30
52. Jiskra J, Límanová Z, Barkmanová J, Smutek D, Friedmannová Z. Autoimmune thyroid diseases in women with breast cancer and colorectal cancer. Physiol Res. 2004;53:693-702
53. Nielsen NM, Rostgaard K, Rasmussen S, Koch-Henriksen N, Storm HH, Melbye M. et al. Cancer risk among patients with multiple sclerosis: a population-based register study. Int J Cancer. 2006;118:979-84
54. Kee KM, Wang JH, Lee CM, Chen CL, Changchien CS, Hu TH. et al. Validation of clinical AJCC/UICC TNM staging system for hepatocellular carcinoma: analysis of 5,613 cases from a medical center in southern Taiwan. Int J Cancer. 2007;120:2650-5
55. Ritchie ME, Phipson B, Wu D, Hu Y, Law CW, Shi W. et al. limma powers differential expression analyses for RNA-sequencing and microarray studies. Nucleic Acids Res. 2015;43:e47
56. Chen B, Khodadoust MS, Liu CL, Newman AM, Alizadeh AA. Profiling Tumor Infiltrating Immune Cells with CIBERSORT. Methods Mol Biol. 2018;1711:243-59
57. Harrell FE Jr, Califf RM, Pryor DB, Lee KL, Rosati RA. Evaluating the yield of medical tests. JAMA. 1982;247:2543-6
Author contact
![]() Corresponding authors: Man Li, The Second Affiliated Hospital of Dalian Medical University; Institute of Cancer Stem Cell, Dalian Medical University, Dalian, China, E-mail: dmulimancom; or Xiangsheng Xiao, Sun Yat-sen University Cancer Center, Guangzhou, China, E-mail: xiaoxshorg.cn; or Wuguo Deng, Sun Yat-sen University Cancer Center, Guangzhou, China, E-mail: dengwgorg.cn.
Corresponding authors: Man Li, The Second Affiliated Hospital of Dalian Medical University; Institute of Cancer Stem Cell, Dalian Medical University, Dalian, China, E-mail: dmulimancom; or Xiangsheng Xiao, Sun Yat-sen University Cancer Center, Guangzhou, China, E-mail: xiaoxshorg.cn; or Wuguo Deng, Sun Yat-sen University Cancer Center, Guangzhou, China, E-mail: dengwgorg.cn.