Impact Factor
- Issue 14; 2026
- Issue 13; 2026
- Issue 12; 2026
- Issue 11; 2026
- Issue 10; 2026
- Volume 16; 2026
- Advance Articles
- Past Issues
- Cover Images
- Cover Suggestion
- Index & Coverage
- Special Issues
Introduction
Materials and Methods
Results
Discussion
Conclusion
Abbreviations
Supplementary Material
Acknowledgements
References
International Journal of Biological Sciences
International Journal of Medical Sciences
 Global reach, higher impact

Theranostics 2026; 16(10):5406-5439. doi:10.7150/thno.127100 This issue Cite
Research Paper
Context-dependent Activities of Mitrephorone Link Lipid Redirection, Anti-inflammatory Action, and Ferroptosis Control to Hepatocyte Protection
Lorenz Waltl1,2, Lukas A. Wein3, Leonhard Bereuter4, Fengting Su4, Henriett Barta4, Loc Le Xuan1, David Holubek4, Zahra Mahmoudi Eshkaftaki4, Katharina Puskac4, Anita Siller5, Peter Schlenke6, Harald Schennach5, Eva-Maria Pferschy-Wenzig4, Hans Schött4, Silvia Racedo4, Solveigh C. Koeberle1,4, Thomas Magauer3, Andreas Koeberle1,4 ![]()
1. Michael Popp Institute and Center for Molecular Biosciences (CMBI), University of Innsbruck, Mitterweg 24, 6020 Innsbruck, Austria.
2. Institute of Human Genetics, Medical University of Innsbruck, Peter-Mayr-Straße 1, 6020 Innsbruck, Austria.
3. Department of Organic Chemistry and Center for Molecular Biosciences (CMBI) University of Innsbruck, Innrain 80-82, 6020 Innsbruck, Austria.
4. Institute of Pharmaceutical Sciences and Excellence Field BioHealth, NAWI Graz, University of Graz, Beethovenstraße 8, 8010 Graz, Austria.
5. Central Institute for Blood Transfusion and Immunology, Tirol Kliniken GmbH, Anichstraße 35, 6020 Innsbruck, Austria.
6. Clinical Department of Blood Group Serology and Transfusion Medicine, Medical University of Graz, Auenbruggerplatz 48, 8036 Graz, Austria.
Received 2025-10-21; Accepted 2026-2-9; Published 2026-3-17
Abstract

Rationale: Liver diseases are driven by aberrant metabolism, involve necrotic cell death, particularly ferroptosis, and progress with low-grade inflammation. Rationally designed small molecules that simultaneously target these processes are lacking. Here, we investigated mitrephorone B, an ent-trachylobane diterpenoid from the Bornean shrub Mitrephora glabra, accessible by total synthesis, as a potential hepatoprotective agent in vitro.
Methods: We tested mitrephorone B and four derivatives in human HepaRG hepatocytes, primary peripheral blood mononuclear cells (PBMCs), polarized monocyte-derived macrophages, and lipid-driven in vitro disease models. Quantitative lipidomics, cell viability and membrane integrity assays, overexpression studies, immunodetection, molecular probes, expression analysis, and cell-free activity assays were used to assess effects on programmed cell death, lipid mediator biosynthesis, cytokine expression, and alternations of the cellular lipidome.
Results: Mitrephorone B reduced pro-inflammatory cytokine expression in PBMCs independently of nuclear factor-κB signaling, inhibited phospholipid peroxidation, and suppressed ferroptosis in hepatocytes, associated with altered triglyceride fatty acid composition in PBMCs. It lowered cholesteryl ester levels in PBMCs and cocultures with hepatocytes and suppressed pro-inflammatory leukotriene production by antagonizing 5-lipoxygenase-activating protein. Over time, mitrephorone B limited the capacity of PBMCs to generate pro-inflammatory lipid mediators while modestly promoting the formation of epoxyeicosatrienoic acids, known to counteract inflammation and cell death. In an immunocompetent in vitro model of lipid-induced hepatotoxicity, it improved metabolic activity and reduced triglyceride content. Structurally, the 9-oxo group was essential for effective 5-lipoxygenase-activating protein antagonism, while the 10-oxo group contributed to cytokine suppression. Anti-ferroptotic activity was largely preserved across derivatives, whereas small structural modifications fine-tuned lipidome effects.
Conclusions: Mitrephorone B displays a unique activity profile, redirecting neutral lipid accumulation, suppressing ferroptosis, and inhibiting inflammation. These properties highlight its potential as a candidate lead structure for treating necroinflammatory liver diseases associated with aberrant lipid metabolism, including metabolic dysfunction-associated steatotic liver disease, steatohepatitis, cirrhosis, and hepatocellular carcinoma.
Introduction
The liver is a central hub of glucose and lipid metabolism and plays a key role in systemic immune activation [1-3]. Hepatocytes coordinate triglyceride (TG) and cholesteryl ester (CE) storage and release with extrahepatic tissues by balancing lipogenesis, lipid droplet formation, and lipid uptake against lipid catabolism and excretion [2, 4, 5]. Dysregulation of these processes, reflected by hypertriglyceridemia and hypercholesterolemia, contributes to liver diseases such as metabolic dysfunction-associated steatotic liver disease (MASLD; formerly non-alcoholic fatty liver disease) and metabolic dysfunction-associated steatohepatitis (MASH), and in advanced stages to fibrosis, cirrhosis, and hepatocellular carcinoma [6]. Lipid-lowering drugs are the standard therapy for dyslipidemia and effectively reduce plasma TG and cholesterol levels [7, 8], but they have limited efficacy in treating fatty liver disease, underscoring its multifactorial nature [9]. The most effective current therapy for MASLD is resmetirom, a recently FDA-approved thyroid hormone receptor β agonist [10]. Additional drug classes under clinical evaluation include anti-diabetic drugs, peroxisome proliferator-activated receptor agonists, farnesoid X receptor agonists, thyroid hormone receptor agonists, fibroblast growth factor analogs, as well as anti-fibrotic and anti-inflammatory agents [9-12]. Evidence for dietary supplements remains limited. Vitamin E, a lipophilic antioxidant, has shown some benefit [13], possibly by protecting against ferroptosis [14, 15] and dampening inflammation following hepatic ω-oxidation [16-19].
Resident macrophages (Kupffer cells) and monocyte-derived macrophages are abundantly present in the liver, where they play key roles in regeneration and immunological tolerance [20, 21]. In the context of liver injury or metabolic and degenerative disease, these macrophages become activated and, under chronic inflammation, progressively dysfunctional [21, 22]. Their shift from homeostatic, tissue-remodeling functions to a pro-inflammatory state characterized by cytokine release and lipid mediator production exacerbates liver injury and disease progression [21, 22]. In addition, macrophages and other resident immune cells reprogram hepatocyte metabolism through regulatory circuits that are dysregulated in metabolic disease, thereby further driving pathology [23]. Consequently, aberrant macrophage function has been linked to metabolic rewiring, and macrophage-targeted strategies are being explored for the treatment of acute and chronic liver disease [21].
Macrophage-derived lipid mediators, together with cytokines, orchestrate the biphasic inflammatory response, including resolution of inflammation and tissue regeneration [24]. Their biosynthesis is initiated by phospholipase A2 (PLA2) isoenzymes, which release polyunsaturated fatty acids (PUFAs) from membrane phospholipids [25, 26]. These PUFAs are subsequently converted by oxygenases, mainly cyclooxygenases (PTGS, COX), lipoxygenases (ALOX, LOX), and cytochrome P450 monooxygenases (CYP), often in cooperation with hydrolases, isomerases, and ligases, into structurally and functionally diverse classes of lipid mediators [27-31]. The isoenzyme 5-lipoxygenase (ALOX5, 5-LOX) requires the membrane-associated 5-lipoxygenase-activating protein (ALOX5AP, FLAP), which channels newly released arachidonic acid (AA/20:4) to the translocated dioxygenase [32].
By binding to membrane or nuclear receptors, lipid mediators exert pro-inflammatory, anti-inflammatory, pro-resolving, or immunoregulatory functions, depending on spatial and temporal dynamics and the (patho)physiological context [26, 33, 34]. Beyond inflammation, they also regulate metabolism [35-40], promote survival and proliferation, or facilitate cell death [41-43], among many other functions. For instance, ALOX5-derived leukotrienes (LTs) recruit and activate immune cells, enhance vascular permeability, and induce bronchoconstriction, thereby driving inflammation [28, 44-46], whereas CYP-derived epoxyeicosatrienoic acids inhibit inflammation and protect against cell death [47].
Liver diseases, including acute liver injury, MASH, fibrosis, cirrhosis, and hepatocellular carcinoma, are associated with the activation of distinct cell death programs that cause functional loss and tissue degradation [6, 48-51], while also propagating inflammation through the release of damage-associated molecular patterns (DAMPs) [6, 49]. Growing evidence implicates ferroptosis in the pathogenesis of liver diseases, particularly MASH [50, 52, 53], although its molecular mechanisms and clinical relevance remain incompletely understood. Ferroptosis is a metabolically regulated form of cell death executed by iron-dependent peroxidation of PUFAs in membrane phospholipids, including phosphatidylethanolamines (PEs) [54-56]. These oxidized phospholipids undergo truncation and disrupt membrane architecture through mechanisms that are still not fully resolved [57-59]. Membrane peroxidation is triggered either by labile Fe(II), which generates hydroxyl radicals from hydrogen peroxide via the Fenton reaction [60], or enzymatically by iron-containing oxygenases, such as CYP enzymes [61, 62] or 15-lipoxygenase (ALOX15, 15-LOX) in complex with PE-binding protein 1 (PEBP1) [63, 64]. A complex network of repair and protective systems, including glutathione peroxidase 4 (GPX4), multiple redox cycles, and Ca2+-independent PLA2, counteracts ferroptosis [65-67]. Susceptibility to ferroptosis is strongly influenced by the membrane PUFA/monounsaturated fatty acid (MUFA) ratio, which in turn is regulated by metabolic drivers such as sterol regulatory element-binding protein 1 (SREBP-1) signaling, lipogenesis, lipid uptake, and phospholipid desaturation [68-71].
Although ferroptosis is immunogenic, it has also been reported to suppress specific immune cell populations [72-74]. Its close link to lipid mediator production, however, is well established. For instance, (i) ALOX isoenzymes, particularly ALOX15, oxygenate both free fatty acids and membrane phospholipids [63, 64]; (ii) PTGS2, a key enzyme in prostanoid biosynthesis [75], is upregulated during ferroptosis [70]; and (iii) glutathione peroxidases detoxify (membrane) hydroperoxides [76, 77], while simultaneously reducing the redox tone required to activate the catalytic cycle of both PTGS and ALOX enzymes [77-79].
Liver diseases have metabolic, inflammatory, and degenerative/ferroptotic components and despite recent progress still lack effective therapies [6, 10, 50, 80], likely because single-target strategies are insufficient for such complex disorders. We therefore searched for multi-target natural products capable of modulating (neutral) lipid metabolism, protecting against ferroptosis, and exhibiting pronounced anti-inflammatory properties. This led us to the ent-trachylobane mitrephorone B (2), first isolated from Mitrephora glabra (Annonaceae) and previously reported to display moderate cytotoxicity against cancer cell lines as well as antimicrobial activity [81]. Compound 2 inhibits membrane peroxidation and thereby preferentially protects against ferroptosis inducers over apoptosis, necroptosis, and pyroptosis inducers. Mechanistically, it alters neutral lipid content and fatty acid composition, including lipid saturation, but does not act as a lipophilic radical scavenger, does not affect labile iron availability or glutathione metabolism, and does not differentially regulate key ferroptosis-associated genes compared with a radical-trapping ferroptosis inhibitor used as control. Compound 2 protects against lipid overload-induced toxicity in immune cell-hepatocyte co-cultures in vitro, suppresses (pro-inflammatory) cytokine expression independently of nuclear factor kappa B (NF-κB) signaling, and inhibits LT biosynthesis by targeting ALOX5AP (dependent on the 9-oxo group). Context-dependently, it also reduces CE or TG levels in single or co-cultured hepatocyte and immune cell in vitro pre-disease and disease models. Small structural variations introduced via total synthesis allow fine-tuning of these activities, making 2 an attractive candidate lead structure for hepatoprotective drug development.
Materials and Methods
Small molecules, lipids and standards
Compounds 1-5 (purity ≥ 95% by ¹H-NMR) were synthesized as described [82], dissolved in DMSO, and stored in the dark at -80 °C (stock solutions) or -20 °C (working dilutions) under argon, minimizing freeze-thaw cycles. Inhibitors were dissolved in DMSO and stored at -20 °C. Lipid mediators, fatty acids, and standards were purchased from Cayman Chemical (Ann Arbor, MI) and stored at -80 °C. Aliquots were diluted in methanol/water (1:1) for fatty acids, oxylipins, and endocannabinoids, or in methanol for phospholipids, sphingolipids, neutral lipids, and free fatty acids, and kept at -80 °C under argon, protected from light.
Culture of human HepaRG hepatocytes
Differentiated HepaRG cells (#HPR101, Biopredic International, Rennes, France; 3.1×10⁴ cells/cm²) were cultured in William's Medium E (Biochrom, Berlin, Germany) supplemented with 10% fetal calf serum (FCS; GIBCO, Darmstadt, Germany or Sigma-Aldrich, St. Louis, MO), 5 µg/mL human recombinant insulin (Lonza, Basel, Switzerland), 2 mM L-glutamine (GIBCO), 100 U/mL penicillin (GIBCO), 37 or 50 µM hydrocortisone 21-hemisuccinate (Cayman Chemical), and with or without 100 µg/mL streptomycin (GIBCO), at 37 °C and 5% CO2. Cells were regularly checked for mycoplasma contamination (Mycoplasma Alert plus; Lonza, #LT07-710) and their morphology monitored. For subculturing, cells were detached using trypsin/EDTA (GE Healthcare, Munich, Germany) before reaching confluence.
Isolation of peripheral blood mononuclear cells (PBMCs)
Leukocyte reduction system chamber (LRSC) filters were obtained from male and female platelet donors (18-65 years) at the Central Institute for Blood Transfusion and Immunological Department of Tirol Kliniken GmbH (Austria). Platelet donors were physically examined by trained medical staff prior to donation. Buffy coats were obtained from female and male blood donors (18-65 years) at the Clinical Department of Blood Group Serology and Transfusion Medicine, Medical University of Graz (Austria). Blood donors were accepted based on a standardized health questionnaire and routine blood testing. All platelet and blood donors met the criteria of the Austrian Blood Donation Regulation (BGBI. II Nr. 217/2022) and provided informed consent for the use of their residual blood for scientific purposes.
Human PBMCs were freshly isolated from LRSC filters or buffy coats by dextran sedimentation followed by isopycnic density gradient centrifugation using Histopaque®-1077 (Sigma-Aldrich) at 400 × g for 20 min at room temperature [83, 84]. The resulting PBMC fraction was further purified by hypotonic lysis of erythrocytes (water) and two consecutive washes with PBS pH 7.4 at 270 × g for 5 min at room temperature.
Studies on primary human innate immune cells were approved by the Ethical Committees of the Medical University Innsbruck (approval no. 1041/2020, June 19, 2020) and the University of Graz (approval no. 39/149/63 ex 2024/25, May 30, 2025).
Monocyte-derived macrophages and polarization to M1 and M2 subtypes
Monocytes, the predominant cell type of PBMCs (46.4 ± 4.9% CD14⁺/CD16⁺ and CD14⁺/CD16⁻ cells as determined by flow cytometry), were cultured in RPMI 1640 medium (Sigma-Aldrich) supplemented with 10% FCS, 2 mM L-glutamine, 100 U/mL penicillin, 100 µg/mL streptomycin, and 20 ng/mL GM-CSF (HiSS Diagnostics GmbH, Freiburg, Germany) or 20 ng/mL M-CSF (HiSS Diagnostics GmbH) for 6 days to differentiate into GM-CSF- or M-CSF-derived macrophages. Differentiated macrophages were subsequently polarized for 48 h into M1-like macrophages by treatment with 100 ng/mL lipopolysaccharide (LPS; Escherichia coli O127:B8, Sigma-Aldrich) and 20 ng/mL interferon-γ (Peprotech, Hamburg, Germany), or into M2-like macrophages by treatment with 20 ng/mL interleukin (IL)-4 (Peprotech) [85].
Treatment of PBMCs and macrophages for lipid mediator profiling
Human PBMCs (5×10⁶ cells/mL in 1 mL PBS pH 7.4, supplemented with 1 mM CaCl₂) were pre-incubated with vehicle (DMSO, 0.1%) or test compounds for 10 min at 37 °C, followed by stimulation with the Ca2+-ionophore A23187 (Cayman Chemical; 2.5 µM, 10 min) alone or in combination with AA/20:4 (Cayman Chemical; 20 µM).
M1 and M2 macrophages (2 mL PBS pH 7.4, plus 1 mM CaCl2) were pre-incubated with vehicle (DMSO, 0.1%) or test compounds for 15 min at 37 °C and 5% CO₂ prior to stimulation with Staphylococcus aureus-conditioned medium (SACM; 1%, 3 h). SACM was obtained by culturing S. aureus (LS1 strain) in brain heart infusion (BHI) medium for 18 h, followed by sterile filtration of the supernatant (3,400 × g, 10 min, room temperature) through a Rotilabo® syringe filter (PVDF, 0.22 µm, Roth, Karlsruhe, Germany) [86].
Lipid mediator biosynthesis was terminated by addition of ice-cold methanol (2 mL for PBMCs, 3.5 mL for macrophages) containing deuterium-labeled internal standards: 200 pg d8-5(S)-HETE, d4-LTB4, d5-lipoxin (LX)A4, d5-resolvin (Rv)D2, d4-prostaglandin E2 (d4-PGE2), d11-(±)8(9)-epoxy-5Z,8Z,14Z-eicosatrienoic acid (d11-8,9-EET; for 48 h treatments only), and 2,000 pg d8-AA/20:4 (Cayman Chemical, Ann Arbor, MI).
Determination of cell numbers, membrane integrity, and cellular dehydrogenase activity
Cell number and membrane integrity were determined after trypan blue staining using a Vi-CELL Series Cell Counter (Beckman Coulter, Krefeld, Germany; software: Vi-Cell XR Cell Viability Analyzer, version 2.06.3) [87].
Cellular metabolic activity was assessed via conversion of 3-(4,5-dimethylthiazol-2-yl)-2,5-diphenyltetrazolium bromide (MTT; Sigma Aldrich, St. Louis, MO) [88, 89]. Briefly, HepaRG cells (1×10⁴/well in 100 µL routine culture medium) or human PBMCs (2×10⁵/well in 100 µL RPMI 1640 medium supplemented with 5% FCS, 2 mM L-glutamine, 100 U/mL penicillin, and 100 µg/mL streptomycin) were treated with vehicle (DMSO, 0.5%) or test compounds in the presence or absence of the ferroptosis inducer RSL3 (0.2 or 0.4 µM; Cayman Chemical) for 24 or 48 h at 37 °C and 5% CO2. The pan-kinase inhibitor staurosporine (1 µM, Sigma Aldrich) served as a cytotoxic reference. After incubation, MTT solution (5 mg/mL in PBS pH 7.4; 20 µL) was added and cells were incubated for 3 h. The resulting blue formazan crystals were solubilized with SDS lysis buffer (10% SDS in 20 mM HCl; 100 µL) for more than 16 h under orbital shaking (Grant Bio PSU-20i, Cambridge, United Kingdom; Wippschüttler RS-RS 6 digital, Phoenix, Garbsen, Germany). Absorbance was measured at 570 nm using a SpectraMax iD3 Microplate Reader (Molecular Devices, San José, CA) or a Hidex Sense microplate reader (Hidex, Turku, Finland).
Assessment of apoptotic and necroptotic cell death in hepatocytes
HepaRG cells were plated in 96-well plates at 1×10⁴ cells per well in 100 µL of routine culture medium and maintained for 24 h at 37 °C under 5% CO2. To trigger apoptotic cell death, cells were exposed to staurosporine (0.05 µM, Sigma-Aldrich), with DMSO (0.5%) used as the vehicle control. Cells were co-treated with vehicle (DMSO, 0.5%), the pan-caspase inhibitor Q-VD-OPh (50 µM; Sigma-Aldrich), or mitrephorone 2 (1 µM). Necroptosis was induced by treatment with tumor necrosis factor-α (TNF-α, 10 ng/mL, PreproTech, Cranbury, NJ) in the presence of Q-VD-OPh (50 µM) or cells were treated with DMSO (0.5%) as vehicle control. Co-treatments included vehicle (DMSO, 0.5%), the necroptosis inhibitor necrostatin-1s (50 µM; Cayman Chemical), or mitrephorone 2 (1 µM). Metabolic activity was determined by MTT assay as described above.
Assessment of pyroptotic cell death in LPS-primed hepatocytes
HepaRG cells were plated in 96-well plates at 1×10⁴ cells per well in 100 µL of routine culture medium and maintained for 24 h at 37 °C under 5% CO₂. For pyroptosis induction, cells were primed with LPS (1 µg/mL) for 4 h, followed by treatment with nigericin (10 μM, Cayman Chemical). Where indicated, cells were co-treated with vehicle (DMSO, 0.5%), the pyroptosis inhibitor MCC950 (sodium salt, 1 µM; AdipoGen Life Sciences, San Diego, CA), or mitrephorone 2 (1 µM). Cell death rate was monitored by live-cell imaging using an Incucyte® system (Sartorius, Göttingen, Germany). Propidium iodide (MedChemExpress, Monmouth Junction, NJ) was added to the medium at a final concentration of 2.5 µM to detect loss of plasma membrane integrity as an indicator of cell death. Plates were placed into the Incucyte® live-cell analysis system immediately after treatment. Phase-contrast and red fluorescence images were acquired at 3-h intervals throughout the incubation period using a label-free high definition phase imaging system. Red fluorescence was detected using an excitation filter of 525/40 nm and an emission filter of 635 nm (625-805 nm). Cell confluency was automatically determined from phase-contrast images using the Incucyte® Live-Cell Analysis Software (Sartorius), and propidium iodide-positive cells were identified and quantified using the fluorescence channel-based analysis. The relative death rate was calculated by normalizing the number of propidium-iodide-positive objects, indicating dead cells, to cell confluence (%) for each time point and treatment.
Lipid peroxidation analysis by BODIPY-C11 staining and flow cytometry
HepaRG cells were seeded into 12-well plates at a density of 2×10⁵ cells per well and maintained at 37 °C in a humidified incubator containing 5% CO2. Cells were treated with vehicle (DMSO, 0.25%), mitrephorone 2 (10 and 30 µM), or ferrostatin-1 (10 µM; Cayman Chemical) for 24 h and subsequently challenged with vehicle (DMSO, 0.25%) RSL3 (0.5 µM) to induce ferroptosis. After 2 h, C11-BODIPY (2 µM, Cayman Chemical) was added, and cells were incubated for an additional 30 min at 37 °C in the dark. Following staining, cells were washed with PBS pH 7.4, detached using 1× trypsin/EDTA, neutralized with growth medium, and collected together with all wash fractions. Samples were centrifuged at 1,200 × g for 5 min at 4 °C, washed twice with Hank's Balanced Salt Solution (HBSS) pH 7.4, and resuspended in the same buffer. Flow cytometric acquisition (λex/em = 488/550 nm) was performed on a CytoFLEX system (Beckman, Austria), recording 10,000 events within a predefined gate for HepaRG cells. The same gating strategy was uniformly applied to all samples and is shown in Figure S3A. Data were analyzed using FlowJo v10.10.0 (FlowJo, Ashland, OR). Mean fluorescence intensity values were normalized to the vehicle control and expressed as percentage change.
Lipid peroxidation analysis by 4-HNE immunofluorescence microscopy
HepaRG cells were seeded on sterile glass coverslips at a density of 2.5×10⁵ cells per well and incubated at 37 °C in a humidified atmosphere containing 5% CO2. Cells were treated for 24 h with vehicle (DMSO, 0.2%), mitrephorone 2 (10 µM), or ferrostatin-1 (10 µM). Ferroptosis was subsequently induced by exposure to RSL3 (0.5 µM). After 2 h, the culture medium was removed and cells were washed twice with PBS pH 7.4. Fixation was performed using 4% paraformaldehyde in PBS pH 7.4 for 15 min at room temperature, followed by three washes with PBS pH 7.4. Cells were then permeabilized with 0.05% Triton X-100 in PBS pH 7.4 for 10 min, washed three additional times with PBS pH 7.4, and blocked for 30 min at room temperature in PBS pH 7.4 containing 1% BSA. Samples were exposed for 1 h at room temperature to a primary mouse monoclonal anti-4-HNE antibody (clone 12F7; 1:100 dilution; SMC-511D-STR; StressMarq Biosciences, Victoria, Canada) in PBS pH 7.4 containing 0.1% BSA and 0.01% Tween 20. After washing, cells were incubated for 30 min at room temperature with an Alexa Fluor™ 555-conjugated goat anti-mouse IgG secondary antibody (1:750; A21422, Lot 2418520; Thermo Fisher Scientific). Samples were counterstained and mounted using ProLong™ Gold Antifade Mountant with DNA Stain DAPI (Thermo Fisher Scientific). Fluorescence images were acquired using a BZ-X800 fluorescence microscope (Keyence, Neu-Isenburg, Germany) equipped with a DAPI filter (OP-87762, λex = 360 ± 20 nm, λem = 460 ± 25 nm) and TRITC filter (OP-87764, λex = 545 ± 12.5 nm, λem = 605 ± 35 nm) along with the BZ-800 Viewer and Analyzer software. Images were capture using a Plan Apochromat 20× (BZ-PA20, NA 0.75) objective and a BZ-X800 camera, operated via the BZ-X800 Viewer software. Image acquisition parameters, including exposure times, were kept constant across all experimental conditions and biological replicates. Quantitative fluorescence analysis was performed using Fiji/ImageJ. Individual microscopic images are shown in the raw data file.
Quantification of labile iron levels
HepaRG cells were seeded at a density of 2.5×10⁵ cells per well in 12-well plates in William's E medium without any supplements and serum to avoid potential interference from serum-derived iron. Cells were treated with compound 2 (10 µM) or vehicle (DMSO, 0.25%) for 24 h at 37 °C and 5% CO2. Ferroptosis was subsequently induced by the addition of imidazole ketone erastin (IKE, 10 µM, Cayman Chemical) for an additional 24 h. Control cells received the corresponding vehicle treatment (0.25 % DMSO). Cells were detached using trypsin/EDTA and collected by centrifugation (1150 × g, 5 min, 4 °C), washed once with HBSS pH 7.4, and stained with Ferro Orange (0.5 µM) for 30 min at 37 °C and 5% CO2. As a negative control, 2,2′-bipyridine (0.5 mM, Sigma-Aldrich) was pre-incubated for 30 min with the FerroOrange (Sigma-Aldrich) staining solution prepared in HBSS pH 7.4. After staining, cells were centrifuged again (1,150 × g, 5 min, 4 °C), the supernatant was removed, and the cell pellet was resuspended in HBSS pH 7.4. FerroOrange fluorescence was quantified by flow cytometry using a CytoFLEX flow cytometer (Beckman Coulter; excitation at 488 nm; emission collected using a 585/42 nm band-pass filter). The gating strategy is shown in Figure S3B.
Measurement of intracellular GSH and GSSG
HepaRG cells were seeded in 12-well plates (3.6×10⁵ cells/well) and cultured for 24 h at 37 °C and 5% CO2 before treatment with vehicle (DMSO, 0.1%), IKE (10 µM), buthionine sulfoximine (BSO, 20 µM, Cayman Chemical), or mitrephorone 2 (10 µM) for an additional 24 h. After treatment, cells were washed with PBS pH 7.4, detached using trypsin/EDTA, and collected by centrifugation (400 × g, 5 min, 4 °C). The resulting cell pellets were washed twice with PBS pH 7.4 and taken up in ice-cold KPE buffer (0.1 M potassium phosphate buffer pH 8 with 0.01 M EDTA) containing protease inhibitors (10 µg/mL leupeptin, 60 µg/mL soybean trypsin inhibitor, 2.7 mM sodium vanadate, 2.5 mM sodium pyrophosphate, and 1 mM phenylmethanesulfonyl fluoride). Cell lysis was achieved by repeated syringe aspiration using a 25G needle (Zlloo/Amazon, Seattle, WA). Lysates were centrifuged (18,000 × g, 10 min, 4 °C), and protein concentrations in the supernatants were determined using the DC Protein Assay Kit (Bio-Rad Laboratories, Munich, Germany). Proteins in the supernatants were subsequently precipitated by adding 50% aqueous trichloroacetic acid (TCA, Carl Roth). Samples were vortexed, incubated on ice for 10 min, and centrifuged at 9,100 × g for 10 min at 4 °C. The resulting supernatants were directly used for the determination of reduced glutathione (GSH) levels. For glutathione disulfide (GSSG) quantification, supernatants were pre-incubated with N-ethylmaleimide (NEM, 8 mM, Sigma Aldrich) for 30 min at room temperature beforehand. Samples, blank (KPE buffer), or standards were diluted with KPE or 0.1 N NaOH for GSH or GSSG measurements, respectively. Subsequently, o-phthalaldehyde (1 mg/mL in methanol; Sigma-Aldrich) was added, and samples were incubated for 15 min. Fluorescence was measured at λex/em = 355/460 nm using a Hidex Sense microplate reader (Hidex, Finland). Corresponding blank values (KPE buffer, o-phthalaldehyde, and NaOH) were subtracted prior to data analysis.
Analysis of phospholipid peroxidation in artificial membranes
Unilaminar liposomes composed of egg phosphatidylcholine (PC, Sigma-Aldrich) were prepared following an established protocol [90-92]. PC was initially dissolved in chloroform, and the solvent was removed under a continuous stream of argon to form a uniform lipid film. To ensure complete solvent evaporation, the vial was maintained under argon for an additional 30 min. The lipid film was subsequently rehydrated with PBS pH 7.4 to a final lipid concentration of 20 mM. The resulting suspension underwent ten freeze-thaw cycles consisting of alternating incubation on ice (4 min) and at room temperature (4 min). Each cycle was followed by sonication for 4 min in an ultrasonic water bath (Sonorex Super Rx 2554, Germany). Liposomes were then extruded 20-25 times through a 100 nm polycarbonate membrane using a mini-extruder (Avanti Research, Alabaster, AL). The mean particle diameter and polydispersity index (PDI) were determined by dynamic light scattering (Zetasizer Advance Ultra, Malvern Panalytical, Almelo, Netherlands). Only liposome preparations with an average diameter of approximately 100 nm and a PDI between 0.2 and 0.3 were used for subsequent experiments. Liposome suspensions were stored at 4 °C and used within two weeks. Phospholipid peroxidation was quantified using a modified fluorescence-enhanced inhibited autoxidation (FENIX) assay. Experiments were performed in black 96-well polypropylene plates (96-Well Optical Bottom Plate, polymer base with lid; Thermo Fisher Scientific). Liposomes (15 µL, 20 mM in PBS pH 7.4) were mixed with 1 µL STY-BODIPY (300 µM in PBS pH 7.4; Cayman Chemical) and PBS pH 7.4 to obtain a final volume of 285 µL per well. Vehicle (DMSO, 0.67%), compound 2 (10 µM), and/or liproxstatin-1 (10 µM, Cayman Chemical) were added to yield the indicated final concentrations, and plates were incubated at 37 °C for 10 min with gentle agitation using a CLARIOstar microplate reader (BMG Labtech, Ortenberg, Germany). Autooxidation was initiated by the addition of 3 µL of the radical initiator DTUN (2 µM; Cayman Chemical), and the volume was adjusted with PBS pH 7.4 to 300 µL, yielding final concentrations of 1 mM liposomes, 1 µM STY-BODIPY, and 2 µM DTUN. After 5 min of vigorous mixing and a 10 min equilibration at 37 °C, fluorescence was measured using a Clariostar microplate reader (BMG Labtech) in bottom-read mode at excitation/emission wavelengths of 488/528 nm at 5 min intervals for up to 10-18 h.
Solid phase extraction and UPLC-MS/MS analysis of lipid mediators
Samples from cell-based lipid mediator studies were stopped with methanol as described above. Aliquots (PBMCs: 3 mL; macrophages: 5.5 mL) were stored at -20 °C for at least 1 h to allow protein precipitation. After centrifugation (750 × g, 10 min, 4 °C), the supernatants were mixed with acidified water (pH 3.5; 8 mL for PBMCs, 9 mL for M1/M2 macrophages) and applied to solid-phase extraction cartridges (Sep-Pak® Vac 6cc, 500 mg/6 mL C18, Waters, Milford, MA), which were conditioned with 6 mL methanol and equilibrated with 2 mL water. Cartridges were sequentially washed with 6 mL water and 6 mL n-hexane (4 °C). Free fatty acids and lipid mediators were eluted with 6 mL methyl formate. The eluates were evaporated to dryness using a TurboVap LV (Biotage, Uppsala, Sweden) and redissolved in methanol/water (1:1). Samples were centrifuged three times (750 × g, 10 min, 4 °C; then twice at 21,100 × g, 5 min, 4 °C) before UPLC-MS/MS analysis [84, 85].
Oxylipins were chromatographically separated on an Acquity UPLC BEH C18 column (130 Å, 1.7 µm, 2.1 × 100 mm; Waters, Milford, MA) at 55 °C using an ExionLC AD UHPLC system (Sciex, Framingham, MA). Mobile phase A consisted of methanol with 0.01% acetic acid, and mobile phase B of water/methanol (90/10) with 0.01% acetic acid. Separation was achieved with a linear gradient from 35.6% to 84.4% A over 12.5 min, followed by 5 min of isocratic elution at 97.8% A [169]. For the analysis of lipid mediator profiles 48 h after treatment with mitrephorones and for Figure 5B-C, an alternative gradient was applied, ramping from 35.6% to 84.4% A within 12.5 min, further increasing to 87.0% A over 2.5 min, and holding for 3 min at 97.8% A [83, 84].
Lipid mediators were analyzed by scheduled multiple reaction monitoring (MRM) using default detection windows of 90 s (negative ion mode) and 60 s (positive ion mode) on a QTRAP 6500+ mass spectrometer (Sciex) equipped with an IonDrive Turbo V source and a TurbolonSpray probe for electrospray ionization (Sciex, Framingham, MA) under polarity switching. Negative ion mode was employed to detect oxylipins and PUFAs, whereas endocannabinoids were analyzed in positive ion mode. Curtain, sheath, and auxiliary gas pressures were set to 40 psi, collision gas to medium, heated capillary temperature to 500 °C, and ion spray voltage to -4000 V and 4000 V for negative and positive modes, respectively. MRM transitions used for quantitation are listed in Table 1.
Quantitative MRM transitions of lipid mediators
| Q1 [m/z] | Q3 [m/z] | rt [min] | ID | MRM window [s] | DP [V] | EP [V] | CE [eV] | CXP [V] | Standards |
|---|---|---|---|---|---|---|---|---|---|
| 351.3 | 195.1 | 5.2 | 20-OH-LTB4 | -80.0 | -10.0 | -24.0 | -15.0 | EX | |
| 369.3 | 169.1 | 6.3 | TXB2 | 130 | -80.0 | -10.0 | -22.0 | -15.0 | EX |
| 351.2 | 271.0 | 6.7 | PGE2 | -120.0 | -10.0 | -20.0 | -13.0 | EX | |
| 351.3 | 189.1 | 6.8 | PGD2 | -120.0 | -10.0 | -20.0 | -13.0 | EX | |
| 380.3 | 141.2 | 6.9 | d5-RvD2 | 120 | -80.0 | -10.0 | -23.0 | -14.0 | IS |
| 353.3 | 193.1 | 7.0 | PGF2α | 60 | -80.0 | -10.0 | -34.0 | -11.0 | EX |
| 375.2 | 175.1 | 7.0 | RvD2 | -80.0 | -10.0 | -30.0 | -13.0 | EX | |
| 351.2 | 235.1 | 7.3 | LXA4 | -80.0 | -10.0 | -20.0 | -13.0 | EX | |
| 375.2 | 215.1 | 7.4 | RvD1 | -80.0 | -10.0 | -26.0 | -13.0 | EX | |
| 333.3 | 115.1 | 8.4 | RvE4 | -80.0 | -10.0 | -22.0 | -13.0 | EX | |
| 335.2 | 195.1 | 9.2 | LTB4-isomers | 120 | -80.0 | -10.0 | -22.0 | -13.0 | |
| 335.2 | 201.0 | 9.3 | 5,15-diHETE | 60 | -50.0 | -10.0 | -30.0 | -13.0 | EX |
| 359.2 | 153.1 | 9.3 | PDX | 120 | -80.0 | -10.0 | -21.0 | -9.0 | EX |
| 359.2 | 199.1 | 9.4 | RvD5 | 60 | -80.0 | -10.0 | -21.0 | -13.0 | EX |
| 359.2 | 153.1 | 9.5 | PD1 | 120 | -80.0 | -10.0 | -21.0 | -9.0 | EX |
| 335.2 | 195.1 | 9.7 | LTB4 | 120 | -80.0 | -10.0 | -22.0 | -13.0 | EX |
| 361.5 | 143.1 | 9.7 | RvD5n-3DPA | -60.0 | -10.0 | -20.0 | -10.0 | EX | |
| 359.2 | 221.0 | 10.2 | MaR2 | -80.0 | -10.0 | -20.0 | -12.0 | EX | |
| 337.2 | 207.1 | 10.5 | 14,15-DiHET | 60 | -60.0 | -5.0 | -20.0 | -10.0 | EX |
| 337.2 | 167.1 | 10.7 | 11,12-DiHET | 60 | -30.0 | -5.0 | -30.0 | -15.0 | EX |
| 317.2 | 259.1 | 10.9 | 18-HEPE | -80.0 | -10.0 | -16.0 | -23.0 | EX | |
| 337.2 | 127.1 | 11.0 | 8,9-DiHET | 60 | -60.0 | -5.0 | -30.0 | -15.0 | EX |
| 317.2 | 219.1 | 11.1 | 15-HEPE | 60 | -80.0 | -10.0 | -18.0 | -12.0 | EX |
| 335.2 | 115.1 | 11.1 | 5S,6R-diHETE | 80 | -80.0 | -10.0 | -20.0 | -13.0 | EX |
| 317.2 | 167.1 | 11.2 | 11-HEPE | 60 | -80.0 | -10.0 | -19.0 | -12.0 | EX |
| 317.2 | 179.1 | 11.3 | 12-HEPE | 60 | -80.0 | -10.0 | -19.0 | -12.0 | EX |
| 337.2 | 145.0 | 11.5 | 5,6-DiHET | 60 | -70.0 | -5.0 | -20.0 | -10.0 | EX |
| 295.2 | 171.0 | 11.6 | 9-HODE | -60.0 | -10.0 | -19.0 | -13.0 | EX | |
| 295.2 | 195.0 | 11.6 | 13-HODE | -60.0 | -10.0 | -25.0 | -13.0 | EX | |
| 317.2 | 115.1 | 11.6 | 5-HEPE | 60 | -80.0 | -10.0 | -18.0 | -12.0 | EX |
| 319.2 | 219.1 | 11.8 | 15-HETE | 60 | -80.0 | -10.0 | -19.0 | -12.0 | EX |
| 343.2 | 245.1 | 11.8 | 17-HDHA | 60 | -80.0 | -10.0 | -17.0 | -14.0 | EX |
| 319.2 | 167.1 | 12.0 | 11-HETE | 60 | -80.0 | -10.0 | -21.0 | -12.0 | EX |
| 319.2 | 179.1 | 12.1 | 12-HETE | 60 | -80.0 | -10.0 | -21.0 | -12.0 | EX |
| 343.2 | 205.1 | 12.1 | 14-HDHA | 60 | -80.0 | -10.0 | -17.0 | -14.0 | EX |
| 343.2 | 141.1 | 12.3 | 7-HDHA | 60 | -80.0 | -10.0 | -18.0 | -15.0 | EX |
| 319.2 | 219.2 | 12.4 | 14.15-EET | 60 | -60.0 | -10.0 | -20.0 | -10.0 | EX |
| 345.2 | 247.1 | 12.4 | 17-HDPA | -80.0 | -10.0 | -17.0 | -14.0 | ||
| 345.2 | 207.1 | 12.4 | 14-HDPA | -80.0 | -10.0 | -17.0 | -14.0 | ||
| 319.2 | 115.1 | 12.5 | 5-HETE | 60 | -80.0 | -10.0 | -21.0 | -12.0 | EX |
| 345.2 | 143.1 | 12.5 | 7-HDPA | -80.0 | -10.0 | -18.0 | -15.0 | ||
| 319.2 | 167.2 | 12.6 | 11.12-EET | 60 | -40.0 | -10.0 | -20.0 | -10.0 | EX |
| 343.2 | 101.1 | 12.7 | 4-HDHA | 60 | -80.0 | -10.0 | -17.0 | -15.0 | EX |
| 330.2 | 155.2 | 12.7 | d11-8.9-EET | 60 | -30.0 | -5.0 | -20.0 | -10.0 | IS |
| 319.2 | 167.0 | 12.8 | 8.9-EET | 60 | -40.0 | -5.0 | -20.0 | -10.0 | EX |
| 319.2 | 191.1 | 13.0 | 5,6-EET | 60 | -50.0 | -5.0 | -20.0 | -15.0 | EX |
| 355.3 | 193.2 | 6.6 | d4-PGE2 | 120 | -80.0 | -10.0 | -25.0 | -16.0 | IS |
| 380.3 | 141.2 | 6.9 | d5-RvD2 | 120 | -80.0 | -10.0 | -23.0 | -14.0 | IS |
| 356.3 | 115.2 | 7.4 | d5-LXA4 | 120 | -80.0 | -10.0 | -19.0 | -14.0 | IS |
| 339.3 | 197.2 | 9.7 | d4-LTB4 | 120 | -80.0 | -10.0 | -22.0 | -13.0 | IS |
| 327.3 | 116.1 | 12.4 | d8-5S-HETE | 120 | -80.0 | -10.0 | -17.0 | -10.0 | IS |
| 330.2 | 155.2 | 12.7 | d11-8.9-EET | 60 | -30.0 | -5.0 | -20.0 | -10.0 | IS |
| 311.3 | 267.1 | 14.8 | d8-AA/20:4 | -100.0 | -10.0 | -16.0 | -18.0 | IS |
rt, retention time; DP, declustering potential; EP, entrance potential; CE, collision energy; CXP, collision cell exit potential; AA/20:4, arachidonic acid; AG, arachidonoyl glycerol; DHA, docosahexaenoic acid; DiHET, dihydroxyeicosatrienoic acid; DPA, docosapentaenoic acid; EET, epoxyeicosatrienoic acid; EPA, eicosapentaenoic acid; EX, external standard; HDHA, hydroxydocosahexaenoic acid; HDPA, hydroxydocosapentaenoic acid; HEPE, hydroxyeicosapentaenoic acid; (di)HETE, (di)hydroxyeicosatetraenoic acid; HODE, hydroxyoctadecadienoic acid; IS, internal standard; LT, leukotriene; LX, lipoxin; MaR, maresin; PD, protectin; PEA, palmitoylethanolamide; PG, prostaglandin; Rv, resolvin; TX, thromboxane.
For Figure 5C, LTB4 (m/z 335.2228 → m/z 195.1032) and the internal standard LTB4-d4 (Cayman Chemical; m/z 339.2479 → m/z 197.1146) were quantified by MRMHR in negative ion mode using a ZenoTOF 7600 mass spectrometer (Sciex) equipped with an OptiFlow Turbo V electrospray ionization source (Sciex). Instrument control and data processing were performed using Sciex OS software version 4.0 (Sciex). Mass spectrometric source parameters were set as follows: ion source gas 1 (nebulizer gas), 60 psi; ion source gas 2 (heating gas), 60 psi; curtain gas, 55 psi; heated capillary temperature, 575 °C; ion spray voltage, -4,400 V. TOF-MS1 data were acquired over a mass range of m/z 60-650 with an accumulation time of 0.1 s, a declustering potential of -100 V, and a collision energy of 10 eV. Scheduled TOF-MS2 data acquisition by MRMHR covered a mass range of m/z 60-400 with an accumulation time of 0.01 s, a Zeno threshold of 80,000 counts s-1, a declustering potential of -50 V (LTB4) and -70 V (LTB4-d4), and a collision energy of -21 eV for both analytes. The instrument was automatically calibrated every five injections using ESI Negative Calibration Solution (#5042913) for the SCIEX X500 System (Sciex).
Lipid amounts were calculated from 10-11-point standard curves and normalized to a subclass-specific deuterated internal standard and cell number. Mass spectra were acquired and processed using Analyst software versions 1.6.3, 1.7.1, or 1.7.2 or Sciex OS 4.0 (Sciex).
Recent studies on di- and trihydroxylated oxylipins indicate that certain isoforms are not easily resolved on non-chiral stationary phases [93]. Accordingly, these analytes are reported here as specialized pro-resolving mediators (SPMs) and/or isomers (SPM/iso). Obvious isomers distinguishable by MS/MS fragmentation or retention time were excluded from the analysis.
Extraction and quantitative lipidomic analysis of phospholipids and neutral lipids
Phospholipids, neutral lipids, sphingolipids, and free fatty acids were extracted from cell pellets by successive addition of PBS pH 7.4, methanol, chloroform, and saline in a final ratio of 14:34:35:17 [87, 94]. The lower organic phase was evaporated to dryness using a Concentrator Plus System (Eppendorf, Hamburg, Germany; high vapor pressure mode), and the resulting lipid film was dissolved in methanol, centrifuged twice (21,100 × g, 4 °C, 5 min), and subjected to UPLC-MS/MS analysis. Internal standards (obtained from Sigma-Aldrich) were as follows: 1) PBMCs (48 h) - 1,2-dimyristoyl-sn-glycero-3-phosphatidylcholine, 1,2-dimyristoyl-sn-glycero-3-phosphatidylethanolamine, 1,2-dimyristoyl-sn-glycero-3-phosphatidylglycerol, 1,2-myristoyl-sn-glycero-3-phosphoserine, 1,2-dioctanoyl-sn-glycero-3-phospho-(1'-myo-inositol), (15,15,16,16,17,17,18,18,18-d9)oleic acid, cholest-5-en-3ß-yl-heptadecanoate, 1,2,3-tritetradecanoyl-sn-glycerol, 1,2-dimyristoyl-sn-glycerol, 1′,3′-bis[1,2-dimyristoyl-sn-glycero-3-phospho]-glycerol, N-heptadecanoyl-D-erythro-sphingosine, N-heptadecanoyl-D-erythro-sphingosylphosphorylcholine. 2) HepaRG/PBMC co-culture - 1,3-dipentadecanoyl-2-oleoyl(d7)-glycerol and 25,26,26,26,27,27,27-heptadeuteriocholest-5-en-3β-ol (9Z-octadecenoate).
Chromatographic separation of PC, PE, phosphatidylinositol (PI), phosphatidylglycerol (PG), phosphatidylserine (PS), TG, diacylglycerol (DG), CE, cardiolipin (CL), sphingosine (So), sphinganine (Sa), (dihydro)ceramide ((dh)Cer), hexosylceramide (HexCer), ceramide-1-phosphate (C1P), and (dihydro)sphingomyelin [(dh)SM] species, as well as free fatty acids was performed on an Acquity UPLC BEH C8 column (130 Å, 1.7 μm, 2.1×100 mm, Waters) using an ExionLC AD UHPLC system (Sciex) [87, 95]. Separation of these lipids was conducted at 45 °C with a flow rate of 0.75 mL/min, using acetonitrile/water (95:5) with 2 mM ammonium acetate as mobile phase A and water/acetonitrile (90:10) with 2 mM ammonium acetate as mobile phase B. In variation to these settings, PS species were separated at 65 °C with a flow rate of 0.85 mL/min. For TG, DG, and CE analysis, 100% isopropanol was used instead as mobile phase B, and CL analysis was performed at 55 °C with a flow rate of 0.60 mL/min using methanol (2 mM ammonium acetate) as mobile phase A and water (2 mM ammonium acetate) as mobile phase B. To separate PC, PE, PI, PG, PS, and free fatty acids, the gradient was increased linearly from 75% to 85% A over 5 min and to 100% A over the next 2 min, followed by 2 min of isocratic elution. The same gradient was applied for sphingolipids, with the isocratic phase extended to 13 min. TG, DG, and CE were separated using an initial A/B ratio of 90/10, which was ramped to 70/30 over 6 min, and held for 4 min [87]. For Figure S8A, the gradient alternatively started at 100% mobile phase A, linearly increased to an A/B ratio of 70/30 over 9 min, and maintained isocratically for 3 min. CL were eluted by increasing mobile phase A from 85% to 98% over 8 min, followed by 1 min of isocratic elution.
Lipids were detected using a QTRAP 6500+ mass spectrometer (Sciex) with an IonDrive Turbo V Source and TurbolonSpray probe. Mass spectrometric parameters are listed in Table 2A and B. PC ([M+OAc]- to fatty acid anions) [96], other glycerophospholipids ([M-H]- to fatty acid anions) [96], and CL ([M-2H]²⁻ to fatty acid anions) were quantified by MRM in negative ion mode [87]. Free fatty acids were analyzed by single reaction monitoring in negative ion mode [87]. TG, DG, and CE were quantified by MRM from [M+NH4]+ to [M - fatty acid anion]+ in positive ion mode [87, 97]. Sphingolipids were quantified using transitions from [M+H]+ to [M+H-H2O]+ (So, Sa, dhCer), m/z 184.1 ([dh]SM), and m/z 264.4 (Cer, HexCer, C1P) [83, 84].
QTRAP 6500+ parameters for targeted lipidomics (negative mode)
| Negative mode | PC | PE | PG | PI | PS | CL | FFA |
|---|---|---|---|---|---|---|---|
| curtain gas [psi] | 40 | 40 | 40 | 40 | 40 | 40 | 40 |
| collision gas | Medium | Medium | Medium | Medium | Medium | Medium | |
| ion spray voltage [V] | -4500 | -4500 | -4500 | -4500 | -4500 | -4500 | -4500 |
| heated capillary temperature [°C] | 350 | 650 | 550 | 500 | 550 | 650 | 500 |
| shealth gas [psi] | 55 | 55 | 55 | 55 | 45 | 40 | 60 |
| auxiliary gas [psi] | 75 | 75 | 75 | 75 | 80 | 80 | 80 |
| declustering potential [V] | -44 | -50 | -45 | -50 | -40 | -44 | -45 |
| entrance potential [V] | -10 | -10 | -10 | -10 | -10 | -10 | -10 |
| collision energy [eV] | -46 | -38 | -52 | -62 | -56 | -40 | |
| collision cell exit potential [V] | -11 | -12 | -18 | -11 | -20 | -12 |
QTRAP 6500+ parameters for targeted lipidomics (positive mode)
| Positive mode | TG | DG | CE | TG/CE | So/Sa | (dh)Cer | HexCer | C1P | (dh)SM |
|---|---|---|---|---|---|---|---|---|---|
| curtain gas [psi] | 40 | 40 | 40 | 40 | 40 | 40 | 40 | 40 | 40 |
| collision gas | Low | Low | Low | Low | Medium | Medium | Medium | Medium | Medium |
| ion spray voltage [V] | 5500 | 5500 | 5500 | 5500 | 5000 | 5000 | 5000 | 5000 | 5000 |
| heated capillary temperature [°C] | 400 | 400 | 350 | 375 | 500 | 500 | 500 | 500 | 500 |
| shealth gas [psi] | 60 | 60 | 55 | 60 | 40 | 40 | 40 | 40 | 40 |
| auxiliary gas [psi] | 70 | 70 | 70 | 70 | 40 | 40 | 40 | 40 | 40 |
| declustering potential [V] | 120 | 120 | 55 | 120/55 | 30 | 30 | 40 | 30 | 40 |
| entrance potential [V] | 10 | 10 | 10 | 10 | 10 | 10 | 5 | 10 | 10 |
| collision energy [eV] | 35 | 35 | 22 | 35/22 | 20 | 40 | 50 | 40 | 30 |
| collision cell exit potential [V] | 26 | 26 | 22 | 26/22 | 25 | 20 | 20 | 5 | 10 |
Determination of human recombinant 5-lipoxygenase activity
Human recombinant ALOX5 enzyme (Cayman Chemical, 10 U) was preincubated in PBS pH 7.4 containing 1 mM EDTA and 1 mM ATP (1 mL) with vehicle (DMSO, 0.1%) or test compounds for 10 min on ice. AA/20:4 (20 µM; Cayman Chemical) and CaCl2 (2 mM) were then added, and samples were incubated at 37 °C for 10 min [85, 89]. The enzymatic reaction was stopped with ice-cold methanol (1 mL), and PGB1 (200 ng; Cayman Chemical) was added as an internal standard. Samples were acidified with 530 µL PBS plus 60 mM HCl, centrifuged (750 × g, 10 min, 4 °C), and the supernatants were loaded onto Clean-Up C-18 Endcapped SPE cartridges (100 mg, 10 mL, UCT, Bristol, PA), conditioned with methanol (1 mL, twice) and equilibrated with water (1 mL). Cartridges were washed with water (1 mL) and methanol/water (75/25, 1 mL), and lipid mediators were eluted with 100% methanol (300 µL). Eluates were diluted in 120 µL water, centrifuged (21,100 × g, 10 min, 4 °C), and analyzed by UPLC-PDA [85, 89].
LTB4 isomers and 5-HETE were separated on a Kinetex C-18 LC column (100 Å, 1.3 μm, 2.1×50 mm, Phenomenex, Torrance, CA) at a flow rate of 0.45 mL/min using a Nexera X2 UHPLC system (Shimadzu, Kyoto, Japan) operated at 40 °C. The gradient used solvent A (50% methanol/50% water/0.05% trifluoroacetic acid) and solvent B (100% methanol/0.05% trifluoroacetic acid), starting at 14% B and 86% A. After 2 min of isocratic elution, the gradient was increased stepwise to 46% B over 2 min, then to 90% B over another 2 min. LTB4 isomers and PGB1 were detected at 280 nm, and 5-HETE at 235 nm using a photodiode array detector (SPD-M20A, Shimadzu). Chromatograms were acquired and processed using LabSolutions (version 5.97, Shimadzu), and lipid mediator amounts were calculated using analyte-specific extinction coefficients with PGB1 as an internal standard [85, 89].
Assessment of ALOX5AP-dependent LTB4 formation
Human embryonic kidney (HEK)-293 cells (#CRL-1573, ATCC) were maintained in high-glucose DMEM (4.5 g/L; Thermo Fisher Scientific) containing 10% FCS, 100 U/mL penicillin, and 100 µg/mL streptomycin at 37 °C in a humidified atmosphere containing 5% CO2. Cells were routinely tested for mycoplasma contamination, monitored for characteristic morphology, and passaged using trypsin/EDTA before reaching confluence.
For transfection, HEK-293 cells were seeded at 4×10⁵ cells per well in 6-well plates and transfected 24 h later with an empty control vector (pRP[EXP]-EGFP-CAG>hypBase), a human ALOX5 expression vector (pPB[EXP]-CMV>ALOX5[NM_000698.5]), and/or a human ALOX5AP expression vector (pPB[EXP]-CMV>hALOX5AP[NM_001204406.2]). Vector DNA (1 µg) in 250 µL Opti-MEM (Thermo Fisher Scientific) was combined with 3 µL TurboFectin 8.0 (OriGene, Rockville, MD), incubated 15 min at room temperature, and added dropwise to cells in 1 mL culture medium. After 48 h, the cells were washed and preincubated in 1.5 mL PBS pH 7.4 containing 1 mM CaCl2 in the presence of vehicle (DMSO, 0.1%) or 2 (10 µM) for 15 min. LTB4 formation was initiated by addition of A23187 (2.5 µM) and AA/20:4 (2 µM) and terminated by the addition of 2.5 mL ice-cold methanol containing 200 pg d4-LTB4 as internal standard.
Analysis of cytokine expression
Human PBMCs (1.4×10⁶ cells/mL in 1 mL RPMI 1640 supplemented with 5% FCS, 2 mM L-glutamine, 100 U/mL penicillin, and 100 µg/mL streptomycin) were preincubated with vehicle (DMSO, 0.1%) or test compounds for 30 min and then stimulated with LPS at 10 ng/mL for 4 h (TNF-α, IL-8) or 18 h (IL-1β, IL-1 receptor antagonist (IL-1ra), IL-6, monocyte chemoattractant protein-1 (MCP-1), IL-10, IL-12 (p70), IL-23). Supernatants were collected, centrifuged (21,000 × g, 5 min, 4 °C), and cytokine levels were measured immunologically. TNF-α, IL-1β, IL-6, IL-8, MCP-1, and IL-10 were detected using in-house ELISA systems based on DuoSet ELISA Development Kits (Bio-Techne, Minneapolis, MN) according to the manufacturer's instructions. IL-1ra, IL-12 (p70), and IL-23 were quantified using a Bio-Plex 200 System with Bio-Plex Pro Human Cytokine Singleplex Sets, Bio-Plex Pro Reagent Kit III with Flat Bottom Plate, and Bio-Plex Pro Human Cytokine Screening Panel Standards (BIO-RAD, Hercules, CA). Cytokine and chemokine concentrations were calculated from an 8-point standard curve [83].
RNA isolation, cDNA synthesis, and qPCR
HepaRG cells were seeded at a density of 1×10⁶ cells per well in 6-well plates and incubated for 24 h at 37 °C in a humidified atmosphere containing 5% CO2. The cells were then treated with vehicle control (DMSO, 0.1%), RSL3 (0.5 µM), RSL3 in combination with mitropherone 2 (10 µM), or RSL3 in combination with ferrostatin-1 (10 µM) for 48 h. After treatment, total RNA was extracted using the innuPREP RNA Mini kit (#845-KS-2040250, IST Innuscreen, Berlin, Germany) according to the manufacturer's instructions. The RNA concentrations were adjusted to equal levels, and cDNA was generated using qScript reverse transcriptase (#95047-100, Quantabio, Beverly, MA). Quantitative real-time polymerase chain reaction (qPCR) was performed using 0.6 µL of the cDNA template (final concentration: 1.5 ng/µL), gene-specific forward and reverse primers (0.5 µM each; Eurofins Genomics AT, Vienna, Austria, Table S1), and innuMIX qPCR DSGreen standard according to the manufacturer's instructions (#845-AS-1320500, IST InnuScreen, Berlin, Germany). Reactions were run in 0.2 ml Multiply-µStrip PCR tubes (Sarstedt) on a QuantStudio 3 real-time PCR System (Thermo Fisher Scientific). The thermal cycling conditions consisted of an initial denaturation at 95 °C for 2 min, followed by 40 amplification cycles of denaturation at 95 °C for 20 s and annealing/extension at 60 °C for 45 s. This was followed by a melt curve analysis comprising a step at 95 °C for 15 s, incubation at 60 °C for 1 min, and a final step at 95 °C for 30 s. The QuantStudioTM Design & Analysis Software v1.5.1 (Thermo Fisher Scientific) was used for amplification and data acquisition. Transcript levels were quantified using the standard 2^-ΔΔCT method. All samples and standards were analyzed in technical duplicates. Gene expression levels were normalized to the mean of the reference gene GAPDH.
SDS-PAGE and Western Blotting
For the analysis of NF-κB inhibitor α (NFKBIA, IκBα) expression and phosphorylation, freshly isolated PBMCs (3.84×10⁶ cells in RPMI 1640 supplemented with 2 mM L-glutamine, 100 U/mL penicillin, and 100 µg/mL streptomycin) were serum-starved overnight. Cells were pre-incubated for 30 min with vehicle (DMSO, 0.1%) or test compounds in the presence of 2% FCS, then stimulated with LPS at 10 ng/mL for 15 min or 1 h. Samples were placed on ice, washed twice with ice-cold PBS pH 7.4, and lysed by sonication (2 × 5 s on ice, 35% of 125 W; Q125 Sonicator, QSonica, Newtown, CT) in 100 µL lysis buffer containing 20 mM Tris-HCl pH 7.4, 150 mM NaCl, 2 mM EDTA, 1% Triton X-100, 5 mM sodium fluoride, 10 µg/mL leupeptin, 60 µg/mL soybean trypsin inhibitor, 2.7 mM sodium vanadate, 2.5 mM sodium pyrophosphate, and 1 mM phenylmethanesulfonyl fluoride.
To determine the expression of ALOX5, MAP2K1/2, and MAP2K1/2 phosphorylation, PBMCs (1×10⁷ cells) were pre-incubated with vehicle (DMSO, 0.1%) or test compounds for 48 h in RPMI 1640 medium supplemented with 5% FCS, 2 mM L-glutamine, 100 U/mL penicillin, and 100 µg/mL streptomycin. Cells were harvested by sequential rinsing of the wells with ice-cold PBS pH 7.4 containing 5 mM EDTA (1 mL) and PBS pH 7.4 (1 mL). After two additional washes with ice-cold PBS pH 7.4 (1 mL each; 270 × g, 7 min, 4 °C and 2000 × g, 7 min, 4 °C), cell pellets were resuspended in 100 µL lysis buffer and sonicated (2 × 5 s on ice, 35% of 125 W; Q125 Sonicator, QSonica, Newtown, CT).
To assess the cleavage of gasdermin D as a marker of pyroptosis, HepaRG cells were seeded at a density of 1×10⁶ cells per well in a 6-well plate and incubated for 48 h at 37 °C in a humidified atmosphere containing 5% CO2. Cells were then left untreated in routine culture medium or primed with LPS (1 μg/ml) for 4 h. Following LPS priming, cells were co-treated for 1 h with either vehicle (DMSO, 0.1%), the NLRP3 inhibitor MCC950 (1 µM), or mitrephorone 2 (1 µM). Subsequently, the cells were treated with vehicle (ethanol, 0.1%) or stimulated with nigericin (10 µM) for an additional 2 h to induce inflammasome activation.
To determine the phosphorylation of receptor-interacting serine/threonine kinase 1 (RIPK1) during necroptosis induction, HepaRG cells were seeded at a density of 1×10⁶ cells per well in a 6-well plate and incubated for 48 h at 37 °C in a humidified atmosphere containing 5% CO2. Cells were pretreated in routine culture medium with vehicle (DMSO, 0.1%) or the pan-caspase inhibitor Z-VAD-FMK (20 µM) for 30 min and subsequently treated with vehicle (DMSO, 0.1%) or human TNF-α (20 ng/mL) in combination with the SMAC mimetic SM-164 (100 nM) to induce necroptosis. For control and inhibition experiments, cells treated with human TNF-α/Z-VAD-FMK/SM-164 were co-treated with either vehicle (DMSO, 0.1%), the RIPK1 inhibitor necrostatin-1 (50 µM, Cayman Chemical), or mitrephorone 2 (1 µM).
Lysates were centrifuged (12,000 × g, 10 min, 4 °C), and protein concentrations were determined using a DC Protein Assay Kit (Bio-Rad Laboratories). Equal amounts of total protein were mixed with 5× SDS/PAGE loading buffer (125 mM Tris-HCl, pH 6.5; 25% sucrose; 5% SDS; 0.25% bromophenol blue; 5% β-mercaptoethanol), heated at 95 °C for 5 min, and 6-30 µg of protein per lane were separated by 10% SDS-PAGE. Proteins were transferred onto 0.45 µm nitrocellulose membranes (Cytiva Amersham™ Protran™, GE Healthcare, Munich, Germany) and blocked with 5% BSA (Roth) or 5% skim milk (Sigma-Aldrich) in PBS pH 7.4 for 1 h at room temperature. Membranes were incubated overnight at 4 °C with primary antibodies: mouse monoclonal anti-NFKBIA (1:800; #4814S; Cell Signaling, Danvers, MA), rabbit monoclonal anti-phospho-NFKBIA (1:1000; #2859; Cell Signaling), mouse anti-ALOX5 (1:1000; #610695; BD Biosciences), rabbit anti-MAP2K1/2 (1:1000; #9122; Cell Signaling), rabbit anti-phospho-MAP2K1/2 (1:1000; #9121; Cell Signaling), rabbit anti-cleaved gasdermin D (Asp275) (1:500, E7H9G, #36425T; Cell Signaling), rabbit anti-phospho-RIPK1 (Ser166) (1:500, D1L3S, #65746; Cell Signaling, Danvers, MA), rabbit anti-RIPK1 (1:500, D94C12, #3493; Cell Signaling), rabbit monoclonal anti-β-actin (1:1000; #4970; Cell Signaling), or mouse monoclonal anti-β-actin (1:1000; #3700; Cell Signaling). Following three washes with TBS pH 7.4 containing 1% Tween-20 (8 min each), membranes were incubated for 1 h at room temperature with the corresponding secondary antibodies: DyLight® 800 anti-mouse IgG (1:10,000; #SA5-10176; Thermo Fisher Scientific), DyLight® 800 anti-rabbit IgG (1:10000; #SA5-10036 and #SA5-10044; Thermo Fisher Scientific), DyLight® 680 anti-mouse IgG (1:10,000; #35519; Thermo Fisher Scientific), or DyLight® 680 anti-rabbit IgG (1:10,000; #35569; Thermo Fisher Scientific).
For Figure 2C and Figure 7C, fluorescence signals of immunoreactive bands were detected using a Fusion FX7 Edge Imaging System (spectra light capsules: C680, C780; emission filters: F-750, F-850; VILBER Lourmat, Collegien, France). Densitometric analysis was performed with Bio-1D imaging software (version 15.08c, VILBER Lourmat) using rolling ball background subtraction. For Figure 3F and Figure 4F, I, the fluorescence of immunoreactive bands was visualized using a ChemiDoc MP Imaging system (BioRad, Hercules, CA) with epi-far red (excitation: 650-675 nm) or epi-near IR (excitation: 755-777 nm) and emission filters of 715/30 and 835/50. Images were processed with ImageLab software (BioRad) using local background subtraction. Protein levels were normalized to β-actin or GAPDH, and phospho-protein levels were normalized to their respective total protein levels. Uncropped blots are presented in the raw image file.
OxLDL-induced conversion of monocyte-derived macrophages to foam cells
Human primary monocyte-derived macrophages (2.5×10⁵ MGM-CSF per well of a 96-well plate) were serum-starved overnight in RPMI 1640 medium supplemented with 2 mmol/L L-glutamine, 100 U/mL penicillin, and 100 µg/mL streptomycin (100 µL) at 37 °C and 5% CO₂. The culture medium containing non-adherent cells was discarded, and cells were incubated in fresh medium supplemented with 2% FCS. Cells were preincubated with vehicle (DMSO, 1%) or test compounds for 1 h (37 °C, 5% CO2) and subsequently treated with oxLDL (50 µg/mL, Fischer Scientific) or left untreated for 48 h. After fixation (4% paraformaldehyde in PBS pH 7.4; 50 µL, 40 min), cells were washed with 60% aqueous isopropanol (60 µL, 5 min) and stained with Oil-Red-O (0.3% in 60% aqueous isopropanol; 50 µL, 25 min; Sigma Aldrich) to visualize intracellular lipid accumulation. Phase-contrast images were captured using a Motic AE31E Trinocular 100W microscope equipped with a Moticam 10+ camera and Motic Images Plus 3.0 ML Software (Motic China Group Co., Ltd.). For Figure S8C, phase-contrast images were acquired using a BZ-X800 fluorescence microscope (Keyence) equipped with a Plan-Apochromat 10× objective and a BZ-X800 camera, operated with BZ-X800 Viewer software. Following extensive washing (5 × 100 µL water), Oil-Red-O was extracted with 60% aqueous isopropanol (50 µL, 3 min) [98], and absorbance was measured at 345 nm using a SpectraMax iD3 Microplate Reader (Molecular Devices) or at 510 nm using a Hidex Sense microplate reader (Hidex) [99].
Hepatocyte and PBMC co-culture models reflecting lipid overload, lipotoxicity, or (peroxidative) membrane stress
HepaRG cells (1×10⁴/well in 75 µL medium for 96-well plates or 1×10⁶/well in 1.5 mL medium for 6-well plates) were seeded in William's medium E supplemented with 10% FCS, 2 mM L-glutamine, 5 µg/mL human recombinant insulin (Lonza), 100 U/mL penicillin, and 100 µg/mL streptomycin. After 5-7 h at 37 °C and 5% CO₂, an equal number of freshly isolated PBMCs (25 µL for 96-well plates, 0.5 mL for 6-well plates) were added, and co-cultures were incubated overnight. For fatty acid supplementation, palmitic acid (PA)/16:0 and oleic acid (OA)/18:1 were first complexed with 5% BSA in culture medium by sonication and heating. Cells were then challenged with either: i) a balanced mixture of PA/16:0 and OA/18:1 (1 mM; 1:2) to induce lipid overload, ii) excess PA/16:0 (200 µM) to trigger lipotoxicity, or iii) AA/20:4 (20, 200, or 1000 µM) to increase susceptibility of cellular membranes to peroxidative stress. Metabolic stress was applied for 24 h before addition of vehicle (DMSO, 1% for 96-well plates, 0.1% for 6-well plates), compound 2 (10 µM), metformin (1 mM, Cayman Chemical), simvastatin (1 µM, Cayman Chemical), or pioglitazone (100 µM, Sigma-Aldrich), followed by a further 24 h incubation. Cellular metabolic activity and intracellular lipid accumulation were determined in 96-well plates by MTT assay and Oil-Red-O staining, respectively (as detailed above). TG and CE levels, IL-1β expression, and membrane integrity were assessed by quantitative lipidomics, ELISA, and trypan blue staining, respectively, as described above. Phase-contrast images were captured using a Motic AE31E Trinocular 100W microscope equipped with a Moticam 10+ camera and Motic Images Plus 3.0 ML Software (Motic China Group Co., Ltd.).
Co-regulated lipid networks and their correlation with ferroptosis sensitivity
Pearson correlation coefficients were calculated from the mean percentage changes in absolute or relative abundances of phospholipids, sphingolipids, neutral lipids, or free fatty acids (1 and 10 µM). Correlation-based networks were generated using the MetScape 3.1.3 plugin for Cytoscape 3.10.1 (Cytoscape Consortium) [100-102]. Nodes represent individual lipid species and were connected by edges when positively correlated (r ≥ 0.7). Data were visualized using the Edge-weighted Spring Embedded Layout (correlation from matrix algorithm). Correlations between the efficiency to protect against RSL3-induced ferroptotic cell death and changes in absolute or relative lipid composition were calculated in Microsoft Excel Version 2302 (Microsoft 365 Apps for Enterprise; Microsoft) using Pearson correlation.
Statistics
Data are presented as mean, mean ± SEM and individual values or single data from n independent experiments. Normal distribution was assessed using Shapiro-Wilk tests, and outliers were identified with Grubb's test for Figure 5C or for datasets with n ≥ 4 in all other figures (GraphPad Software, San Diego, CA). Sample size was not predetermined by a statistical method, and samples were not blinded. Data analysis was performed using Microsoft Excel (Version 2302, Microsoft 365 Apps for Enterprise, Redmond, WA). Non-transformed or log-transformed data were analyzed using two-tailed Student's t tests for pairwise comparisons (paired or unpaired; α = 0.05), ordinary or repeated measures one-way or two-way ANOVAs, or mixed-effects models (REML) ANOVAs for independent or correlated samples, followed by Dunnett's or Tukey's post hoc tests. Negative log10(P values) in volcano plots were calculated from two-tailed multiple paired Student's t tests. Statistical analyses were conducted with GraphPad Prism 9 or 10 (GraphPad Software), and P values < 0.05 were considered statistically significant.
Generative AI and AI-assisted technologies
During the preparation of this work the authors used ChatGPT 4.0 and 5.0 and DeepL Write in order to improve readability and language of all manuscript sections. After using these tools, the authors reviewed and edited the content as needed and take full responsibility for the content of the publication.
Results
Mitrephorones combine anti-ferroptotic and anti-inflammatory activities
Our search for hepatoprotective natural products combining anti-ferroptotic and anti-inflammatory properties led to the discovery of two closely related diterpenoids, 1 and 2 (Figure 1). Both compounds effectively suppressed ferroptosis induced by the GPX4 inhibitor RSL3 in human HepaRG hepatocytes (Figure 2A), used as a surrogate for normal hepatocytes [103-105].
Structures of the natural products 1 and 2 and their derivatives 3 to 5.
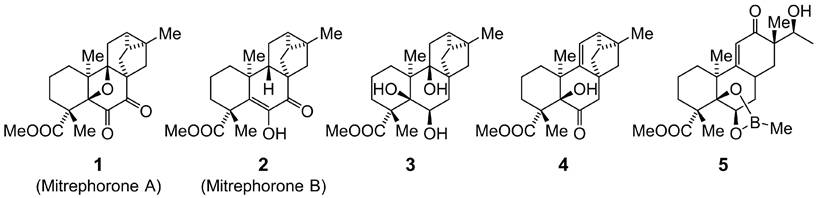
Mitrephorones 1 and 2 protect from ferroptosis, reduce pro-inflammatory cytokine release, and suppress leukotriene biosynthesis. (A) Metabolic activity of HepaRG hepatocytes (1×10⁴) incubated with vehicle (DMSO, 0.5%) or mitrephorones alone or in the presence of RSL3 (0.2 µM) for 48 h, measured by MTT assay. (B) PBMCs (1.4×10⁶) were pretreated with vehicle (DMSO, 0.1%) or mitrephorones for 30 min and then stimulated with LPS for 4 h (TNF-α, IL-8) or 18 h (IL-1β, IL-6, IL-10, MCP-1, IL-12 (p70), IL-23, IL-1ra). Cytokine and chemokine expression was determined by ELISA. (C) PBMCs (3.84×10⁶) were treated with vehicle (DMSO, 0.1%) or 2 for 30 min and stimulated with LPS for the indicated time points. NFKBIA phosphorylation and protein levels were determined by Western blot (representative of n = 3 independent experiments). Uncropped blots are shown in the raw image file. The vehicle controls are identical to Waltl et al. [83]. (D-F) PBMCs (5×10⁶) were preincubated with vehicle (DMSO, 0.1%) or mitrephorones for 10 min and then stimulated with A23187 for another 10 min. (D, left) ALOX5 products. (E) Heatmap of mean percentage changes in oxylipin and fatty acid levels relative to vehicle. (F) PGE2 and PUFA levels. (D, G) M1-like or M2-like macrophages (1-2×10⁶) were treated with vehicle (DMSO, 0.1%) or mitrephorones for 15 min and stimulated with SACM (1%) for 180 min. (D, right) ALOX5 product formation in M1-like macrophages. (G) Levels of ALOX5 products, PTGS products, and 8,9-EET in M2-like macrophages. Mean (B, E) or mean ± SEM (A) and single data (C, D, F, G) from n = 3 (A, C), n = 3-4 (B, D, E, F) and n = 4 (G) independent experiments. P values given vs. vehicle control (A-D, F, G); ordinary one-way ANOVA of log data + Tukey's post hoc tests (A) and repeated measures one-way ANOVA of log data (B) or mixed-effects model (REML) ANOVA of log data (B, D, F, G) + Dunnett's post hoc tests. Two-tailed paired Student's t test of log data for pairwise comparisons as indicated by bars and P values in brackets (C, D). The vehicle controls shown in B-G are identical to those published previously [83]. EPA, eicosapentaenoic acid; HDHA, hydroxydocosahexaenoic acid; HDPA, hydroxydocosapentaenoic acid; HEPE, hydroxyeicosapentaenoic acid; (di)HETE, (di)hydroxyeicosatetraenoic acid; TX, thromboxane.
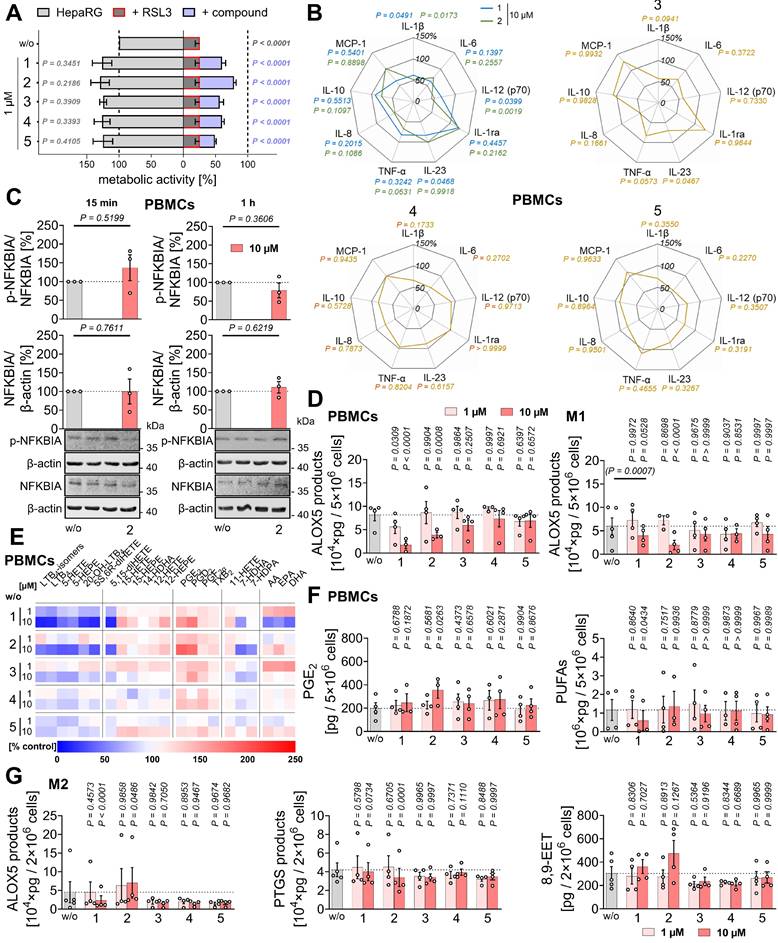
As a substitute for hepatic immune cells, including Kupffer cells, we employed human primary PBMCs and monocyte-derived M1 and M2 macrophages, which, like Kupffer cells, release a variety of immunomodulatory mediators [106-109]. Compounds 1 and 2 reduced the expression of pro-inflammatory and immunostimulatory cytokines and chemokines (IL-1β, IL-12 (p70) > IL-8, TNF-α), with IL-23 expression additionally affected by 1 in LPS-challenged PBMCs (Figure 2B, Figure S1A), seemingly independent of an interference with NF-κB signaling. Thus, compound 2 did not substantially affect NFKBIA phosphorylation or subsequent proteasomal degradation (Figure 2C). Acute cytotoxicity of the compounds was excluded under our experimental conditions (24 h). Neither compound reduced PBMC viability at 1 µM up to 48 h (Figure S1B). Mild cytotoxic effects of 2 (but not 1) were observed at 10 µM starting at 48 h, measured as decreased metabolic activity, without reaching significance and without compromising membrane integrity (Figure S1B).
In addition, compounds 1 and 2 potently inhibited ALOX5 product formation in activated PBMCs and macrophages, while especially 2 moderately increased PGE2 and prostaglandin D2 (PGD2) levels in A23187-activated PBMCs (Figure 2D-F, Figure S2A, B, Table S2), but not, or only minimally, in activated macrophages (Figure S2A, C), possibly by redirecting the common substrate AA/20:4. PGE2 and PGD2 exhibit both pro- and anti-inflammatory activities [25, 33, 110-112]. Levels of free PUFAs, including AA/20:4, were not substantially decreased, with one exception: compound 1 reduced PUFA release at higher concentrations (10 µM) in PBMCs (Figure 2E, F) and, to a lesser extent, in macrophages (Figure S2A, D), likely contributing to its greater efficacy compared to 2 in suppressing ALOX5 product formation in PBMCs. Due to variability between datasets, largely reflecting inter-individual differences among platelet donors, fold changes shown in the heatmap in Figure 2E do not necessarily indicate statistical significance. Heatmaps are therefore used throughout the manuscript solely for overview purposes, whereas conclusions are primarily based on bar or radar charts displaying statistical analyses (Figure 2F), with comprehensive datasets provided in the Supplementary Material (Table S2).
Conversely, compound 2 was more effective than 1 in suppressing ALOX5 product formation in M1 macrophages challenged with SACM, a physiological stimulus (Figure 2D). In activated M2 macrophages, 2 increased ALOX5 product formation by upregulating the production of 5S,6R-dihydroxyeicosatetraenoic acid (5S,6R-diHETE) (Figure 2G, Figure S2A, Table S3), a non-enzymatic hydrolysis product of LTA4 [93]. In these cells, this increase correlated with reduced PTGS product formation, mainly prostaglandin F2α (PGF2α) and thromboxane B2 (TXB2), and tendentially elevated cytochrome P450 monooxygenase-derived 8,9-epoxyeicosatrienoic acid (8,9-EET) levels (Figure 2G, Figure S2A), an anti-inflammatory mediator that limits inflammation and suppresses cell death [47].
Other lipid mediators were not or less affected (Figure 2E, Figure S2A), except for increased 12-lipoxygenase (ALOX12)/ALOX15 product formation, particularly in activated M1 macrophages treated with 1 (Figure S2A, D). These products serve as precursors of SPMs that were proposed to suppress leukocyte infiltration and activation, and promote phagocytosis, bacterial clearance, efferocytosis, and tissue repair [31, 34, 113-115]. However, the increased ALOX12/15 product levels upon treatment with 1 did not translate into increased biosynthesis of SPMs or their isomers (SPM/iso), including protectins (PD/iso) or maresins (MaR/iso) (Figure S2A, D), whose formation is independent of ALOX5 [30, 31, 116].
Collectively, compounds 1 and 2 protect liver cells from ferroptosis and limit the production of pro-inflammatory LTs, cytokines, and chemokines by activated innate immune cells, with effects on the lipid mediator profile strongly depending on the immune cell type and stimulus.
Inhibition of membrane peroxidation through an unconventional mechanism
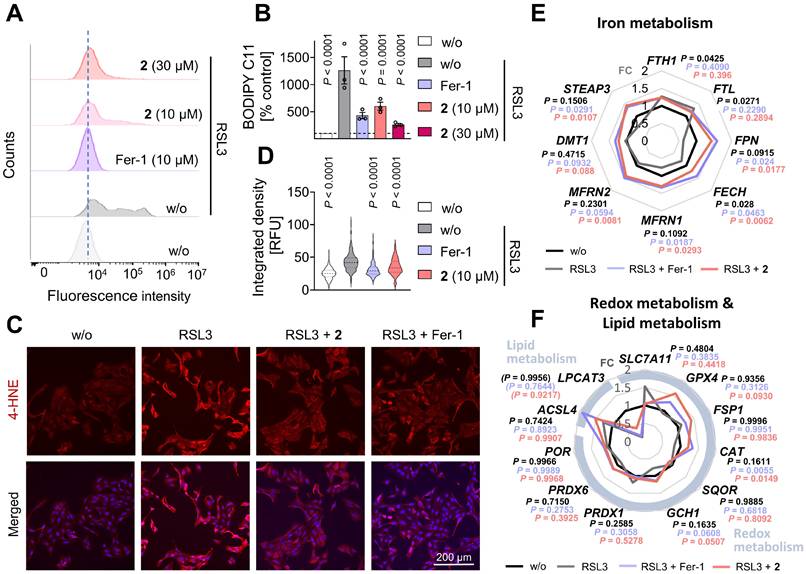
The diverse pathways leading to ferroptosis generally converge on elevated labile ferrous iron pools, dysregulated glutathione metabolism, and/or impaired antioxidative defense and lipid quality control, ultimately causing uncontrolled oxidative membrane stress and phospholipid peroxidation in a metabolic state-dependent manner [66, 70]. To confirm that 2 suppresses lipid peroxidation, HepaRG hepatocytes were challenged with the GPX4 inhibitor RSL3, stained with the lipid reactive oxygen species (ROS)-sensitive probe BODIPY-C11, and analyzed by flow cytometry (Figure 3A, B, Figure S3A). In a complementary approach, 4-hydroxynonenal (4-HNE), an oxidative lipid degradation product [65], was visualized by immunofluorescence microscopy (Figure 3C-D). As expected, treatment with 2 (10 µM) markedly reduced both membrane peroxidation readouts (Figure 3A-D). In addition, 2 attenuated the dysregulation of multiple ferroptosis markers, including FPN, FECH, MFRN1, STEAP3, SLC7A11, CAT, GCH1, PRDX1, PRDX6, and LPCAT3, at the mRNA level in RSL3-challenged hepatocytes (Figure 3E, F). Significant effects were observed for FPN and CAT, and the overall expression profile closely resembled that induced by the selective ferroptosis inhibitor ferrostatin-1. In contrast, the RSL3-induced upregulation of FTH1 and FTL expression was not, or only marginally, affected, by either 2 or ferrostatin-1 (Figure 3E).
Mitrephorone 2 suppresses lipid peroxidation and modulates ferroptosis-associated gene expression. (A, B) Lipid peroxidation in HepaRG cells (2×10⁵ cells/well) was assessed using BODIPY 581/591 C11 staining. Cells were pretreated with vehicle (DMSO, 0.25%), mitrephorone 2, or ferrostatin-1 (Fer-1, 10 µM) for 24 h, followed by exposure to vehicle (DMSO, 0.25%) or RSL3 (0.5 µM) for 2 h. Control experiments included cells treated with vehicle (DMSO, 0.5%) alone. (A) Representative histograms are shown. (B) Quantitative analysis of mean intensities of BODIPY-C11-stained cells. (C, D) HepaRG cells (2.5×10⁵ cells/well) were pre-treated (24 h) with vehicle (DMSO, 0.4%), mitrephorone 2 (10 µM), or Fer-1 (10 µM) and then challenged with RSL3 (0.5 µM, 2 h). (C) Immunofluorescence images (representative of 923-1152 single cells per group, n = 4) stained for 4-HNE and nuclei (DAPI). (D) Integrated density of the 4-HNE signal. (E, F) HepaRG cells (1×10⁶ cells/well) were treated for 48 h with vehicle (DMSO, 0.1 %), RSL3 (0.5 µM), or RSL3 (0.5 µM) in combination with mitrephorone 2 (10 µM) or ferrostatin-1 (Fer-1, 10 µM). Radar charts indicate the fold change (FC) of mRNA expression in cells treated with RSL3 alone or in combination with 2 or Fer-1, relative to vehicle-treated controls. Mean (E, F), mean and single data ± SEM (B), or mean, first and third quartiles, and data distribution (D) from n = 2 (F, LPCAT3), n = 3 (B, E, F, except LPCAT3), or n = 4 (D) independent experiments. P values given vs. RSL3-treated controls; repeated measures one-way ANOVA (B) of log data (E, F, except LPCAT3), mixed-effects model (REML) ANOVA of log data (F, LPCAT3) + Dunnett's post hoc tests, or ordinary one-way ANOVA (D) + Dunnett's post hoc tests.
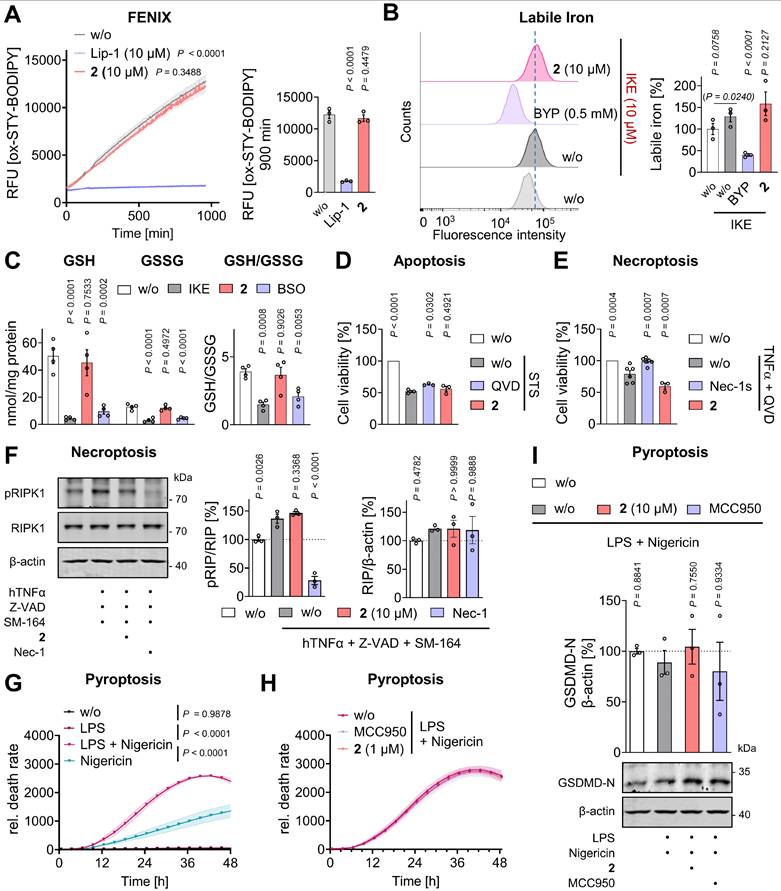
To obtain initial insights into the mechanism underlying the anti-ferroptotic activity of 2, we first examined whether it directly interferes with membrane lipid peroxidation as lipophilic radical trap or modulates iron or glutathione metabolism. In contrast to the ferroptosis inhibitor liproxstatin-1, compound 2 did not inhibit phospholipid peroxidation by a lipophilic radical generator in artificial membranes (Figure 4A). It also did not affect intracellular labile iron levels (Figure 4B, Figure S3B), intracellular glutathione (GSH) levels, glutathione disulfide (GSSG) levels, or the GSH/GSSG ratio, indicative of the cellular redox state (Figure 4C). Interestingly, compound 2 modulated the expression of several key ferroptosis-associated factors (MFRN2, DMT1, GPX4, FSP1) in RSL3-challenged hepatocytes, even in cases where RSL3 alone had no marked effect (Figure 3E, F). In other instances, the expression of ferroptosis regulators (FPN, FECH, MFRN1, STEAP3, CAT, PRDX6) was counter-regulated by 2 beyond a simple restoration of homeostasis. However, as comparable expression patterns were also observed for the selective ferroptosis inhibitor ferrostatin-1 (Figure 3E, F), we consider these transcriptional changes to be secondary consequences of ferroptosis inhibition rather than indicative of a primary molecular target. Together, these findings suggest that compound 2 inhibits ferroptosis via a non-canonical mechanism that does not primarily involve radical scavenging, regulation of iron availability, alteration of glutathione metabolism, or specific transcriptional regulation of major ferroptosis-associated proteins.
Mitrephorone 2 inhibits ferroptosis through an unconventional mechanism. (A) Time-course analysis of PC peroxidation in liposomes treated with mitrephorone 2 (10 µM) or liproxstatin-1 (Lip-1; 10 µM), measured using STY-BODIPY in the FENIX assay. Right panel: Bar graph showing the peroxidation levels at 900 min, based on the data presented in the left panel. (B) Labile iron levels in HepaRG cells (2.5×10⁵ cells/well) pretreated with vehicle (DMSO, 0.25%) or 2 (10 µM) for 24 h, followed by ferroptosis induction with vehicle (DMSO, 0.25%) or IKE (10 µM) for an additional 24 h, assessed using FerroOrange staining. 2,2′-Bipyridine (BYP, 0.5 mM) was included as a control. Representative histograms of n = 3 independent experiments are shown. Right panel: Quantification of mean fluorescence intensities derived from flow cytometry analysis of the FerroOrange-stained cells. (C) Cellular GSH and GSSG levels, as well as the GSH/GSSG ratio, were measured in HepaRG cells (3.6×10⁵ cells/well) treated with vehicle (DMSO, 0.1%), IKE (10 µM), BSO (20 µM), or 2 (10 µM) for 24 h. (D) Apoptosis was induced in HepaRG cells (1×10⁴ cells/well) using staurosporine (STS; 50 nM). Cells were co-treated with vehicle (DMSO, 0.5%) or 2 (1 µM), and metabolic activity was assessed after 48 h using the MTT assay. The pan-caspase inhibitor Q-VD-OPh (QVD, 50 µM) was used as control. (E) Necroptosis was induced by TNF-α (10 ng/mL) in the presence of QVD (50 µM). HepaRG cells (1×10⁴ cells/well) were co-treated with vehicle (DMSO, 0.5%) or 2 (1 µM), and metabolic activity was determined by MTT assay after 48 h. Necrostatin-1s (Nec-1s, 50 µM) was included as control. (F) RIPK1 protein expression and RIPK1 phosphorylation determined by Western blot (representative of n = 3 independent experiments). Uncropped blots are shown in the raw image file. Necrostatin-1 (Nec-1, 50 µM) was included as control. (G, H) Pyroptosis was induced by nigericin (10 µM) in LPS (10 ng/mL)-primed HepaRG cells (1×10⁴ cells/well). Cells were co-treated with vehicle (DMSO, 0.5%) or 2 (1 µM), and cell death was quantified by propidium iodide staining. The NLRP3 inhibitor MCC950 (1 µM) was used as a control. (I) Cleaved gasdermin levels determined by Western blot (representative of n = 3 independent experiments). Uncropped blots are shown in the raw image file. Mean ± SEM (A, G, H) or mean ± SEM and single data (A-E, F, I) from n = 3 (A, B, D, E: mitrephorone 2-treatment, F, I), and n = 4 (C, H), n = 6 (E: except mitrephorone 2-treatment, G) independent experiments. P values given vs. vehicle controls (A, C), vs. IKE-treated cells (B) or vs. respective cell death inducer (D-I); repeated measures two-way ANOVA + Dunnett's post hoc tests (A, left panel, G, H), repeated measures one-way ANOVA (A, right panel, C, E, F, I) of log data (B, D) + Dunnett's post hoc tests. Two-tailed paired Student's t test of log data for pairwise comparisons as indicated by bars and P values in brackets (B).
Preferential inhibition of ferroptosis over alternative cell death programs
Multiple cell death programs besides ferroptosis have been implicated in tissue degeneration during metabolic liver disease, including apoptosis, necroptosis, and pyroptosis [117]. We therefore investigated whether 2 preferentially inhibits ferroptosis or also modulates other cell death pathways. Apoptosis was induced in HepaRG hepatocytes using the pan-kinase inhibitor staurosporine. Necroptosis was triggered by TNF-α in the presence of the pan-caspase inhibitor z-VAD-FMK. All treatments robustly reduced metabolic activity as assessed by MTT assay, and this effect was attenuated by the selective apoptosis inhibitor Q-VD-OPh or the necroptosis inhibitor necrostatin-1s (Figure 4D, E). Necroptosis induction was further confirmed by phosphorylation of RIPK1 (Figure 4F), a key component of the necrosome [117]. In contrast to its potent anti-ferroptotic activity (Figure 2A, Figure 3), compound 2 had little effect on metabolic activity following apoptosis induction (Figure 4D) and even enhanced the loss of metabolic activity upon necroptosis induction (Figure 4E), without affecting RIPK1 phosphorylation (Figure 4F).
To assess whether 2 modulates pyroptosis, HepaRG cells were primed with LPS and exposed to the NLR Family Pyrin Domain Containing 3 (NLRP3) inflammasome activator nigericin, a commonly used approach to induce pyroptosis in immune and non-immune cells [118], and in a limited number of studies in hepatocytes [119]. Loss of membrane integrity was monitored by propidium iodide staining and automated live-cell microscopy. Nigericin induced cell death in HepaRG cells, which was further enhanced by LPS priming, as expected (Figure 4G). However, the selective NLRP3 inhibitor MCC950 did not prevent cell death (Figure 4H), and enhanced cleavage of gasdermin D into pore-forming fragments by LPS/nigericin-treatment - an established hallmark of pyroptosis [117] - was not detected (Figure 4I). These findings indicate that HepaRG cells are susceptible to nigericin-induced cell death under LPS-primed conditions without activation of canonical pyroptotic signaling. Consistently, compound 2 did not affect nigericin-induced cell death (Figure 4H) or gasdermin D cleavage (Figure 4I), further supporting its preferential protection against ferroptosis among the cell death programs investigated.
Mitrephorones antagonize 5-lipoxygenase-activating protein (ALOX5AP)
ALOX5 product formation can be suppressed by limiting AA/20:4 supply, inhibiting ALOX5 or LTA4 hydrolase, antagonizing ALOX5AP, or interfering with ALOX5-activating pathways [31, 98]. Because AA/20:4 levels were not reduced by 2 at concentrations that effectively decreased ALOX5 product formation (Figure 2D, E, Figure S2A, D), impaired AA/20:4 supply was excluded as a primary mechanism. Compounds 1 and 2 also did not significantly inhibit human recombinant ALOX5 in a cell-free assay (1 and 10 µM), ruling out direct enzyme inhibition as a major factor (Figure 5A).
Mitrephorone 2 antagonizes ALOX5AP. (A, B left) Human recombinant ALOX5 was pretreated with vehicle (DMSO, 0.1%) or mitrephorones for 10 min, and enzymatic activity was determined. Data shown in panel B for the recombinant enzyme are identical to panel A. (B, right) PBMCs (5×10⁶) were preincubated with vehicle (DMSO, 0.1%) or 2 for 10 min and then treated with A23187 in the presence or absence of exogenous AA/20:4 to assess the effect of AA/20:4 on ALOX5 product formation. (C) HEK-293 cells were transfected with an empty control vector ('ctrl') or expression vectors for ALOX5 or ALOX5AP. Protein levels of ALOX5 and ALOX5AP were determined by Western blot (representative of n = 3 independent experiments); uncropped blots are shown in the raw image file. To assess the capacity for LTB4 formation, cells were preincubated with vehicle (DMSO, 0.1%) or 2 (10 µM) for 15 min, followed by treatment with A23187 and AA/20:4. Mean ± SEM (A, B) and single data (C) from n = 3 (A, B left panel), n = 2-3 (C), and n = 4 (B right panel) independent experiments. P values given vs. the respective vehicle control (B, C) or compound-treated PBMCs (B blue P values) or ***P < 0.001 vs. vehicle control (A); repeated measures one-way ANOVA of log data (A 1, 2 and 4) or mixed-effects model (REML) ANOVA (C) of log data (B gray and green) + Dunnett's post hoc tests. Two-tailed paired Student's t test of log data for pairwise comparisons (A 3 and 5; B blue P values) as indicated by bars (C). The vehicle controls shown in A and B are identical to those published previously [83].
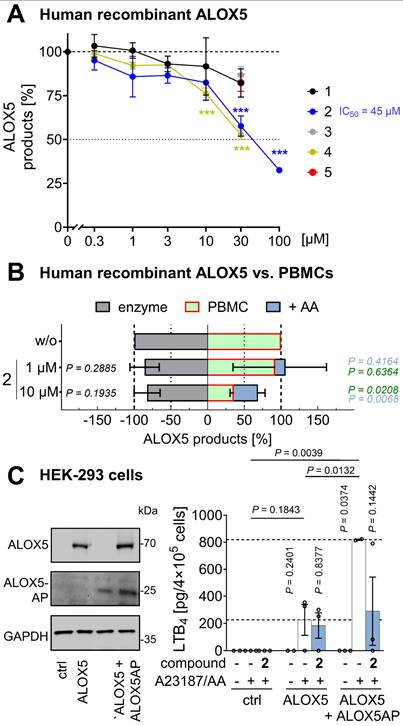
Additionally, LTB4 and 20-OH-LTB4 were not preferentially suppressed relative to other ALOX5 products, excluding LTA4 hydrolase as a target (Figure 2E, Figure S2A). ALOX5AP mediates transfer of AA/20:4 from cytosolic phospholipase A2α (PLA2G4A, cPLA2α) to ALOX5, but becomes unnecessary when AA/20:4 is supplied exogenously [32]. To test for potential ALOX5AP antagonism, PBMCs were treated with 2, and ALOX5 product formation was induced by Ca²⁺ influx and exogenous AA/20:4. As expected for a ALOX5AP antagonist, the ability of 2 to suppress ALOX5 products was strongly diminished in the presence of excess AA/20:4 (Figure 5B).
To confirm ALOX5AP as a target of 2, we overexpressed ALOX5 alone or together with ALOX5AP in human embryonic kidney (HEK)-293 cells, which otherwise lack efficient ALOX5 product formation. Robust LTB4 formation upon treatment with A23187 and AA/20:4 was observed in ALOX5-expressing cells and was further enhanced by co-expression of ALOX5AP (Figure 5C). Compound 2 suppressed LTB4 formation in cells co-expressing ALOX5 and ALOX5AP, whereas its inhibitory effect was markedly reduced in cells expressing ALOX5 alone (Figure 5C), supporting ALOX5AP as the primary cellular target mediating ALOX5 inhibition by 2.
Structural requirements for anti-ferroptotic and anti-inflammatory activity
To define the structural features in compounds 1 and 2 responsible for ferroptosis protection, ALOX5AP antagonism, and repressed cytokine expression, we screened a small library of derivatives (3-5) (Figure 1) [82]. These compounds lacked the 9-oxo group and featured additional modifications in rings B and C, including 4b,10a-dihydroxylation (3), 10a-hydroxylation plus Δ4b-desaturation (4), and more extensive structural changes (5).
All three derivatives retained moderate anti-ferroptotic activity, comparable to 1 but lower than 2 (Figure 2A), yet largely lost the ability to suppress ALOX5 product formation (Figure 2D, Figure S2A), suggesting that the 9-oxo group is critical for ALOX5AP antagonism. None of the derivatives exhibited acute cytotoxicity in PBMCs within 48 h (Figure S1B).
Cytokine expression revealed a more differentiated pattern: compound 3 resembled 2, significantly reducing IL-1β and IL-23 levels, and showing trends toward decreased TNF-α, IL-8 and IL-12 levels (Figure 2B, Figure S1A). Compounds 4 and 5 were considerably less active and displayed more heterogeneous responses across datasets (Figure 2B, Figure S1A). Notably, the shared structural modification of 2 and 3 is the 10-hydroxy group, which replaces the 5-oxo group present in 1 and 4.
Together, these findings indicate that mitrephorones are effective anti-ferroptotic agents, with the 9-oxo group required for ALOX5AP inhibition and the 10-hydroxy group likely contributing to pronounced suppression of pro-inflammatory cytokine and chemokine expression.
Mitrephorones manipulate the capacity of PBMCs to produce lipid mediators
The studies on lipid mediator production described above were designed to capture short-term effects of mitrephorones, without considering changes arising from macrophage polarization or gene expression. To assess whether compounds 1-5 influence macrophage polarization and indirectly alter the lipid mediator profile, they were applied during the differentiation of monocyte-derived macrophages: toward the M1 phenotype by stimulation with LPS and interferon-γ, or toward the M2 phenotype by treatment with IL-4. Only a few significant changes were observed, primarily in the levels of PGE2 and monohydroxylated fatty acids, including 15-HETE, during polarization to M1-like macrophages (Figure 6A, B, Table S3). Modest trends were noted for increased ALOX5 products in M1-like macrophages (1-3), ALOX12/15 products in M1-like macrophages (3), and EETs in M2-like macrophages (3, 5) (Figure 6C).
Effect of mitrephorones on lipid mediator profiles during macrophage polarization. Macrophages (2×10⁶) were treated with vehicle (DMSO, 0.1%) or mitrephorones during polarization to M1- or M2-like subtypes. Cells were stimulated with SACM (1%) for 180 min, and lipid mediator profiles were analyzed. (A) Heatmap of mean percentage changes in oxylipin and fatty acid levels relative to vehicle. Lipid mediators are grouped as ALOX5 products, PTGS products, SPM, monohydroxylated ALOX12/15 products, EETs, and free PUFAs. Crossed boxes indicate lipid mediators that were not detected. (B) Volcano plots depict differences in logarithmized means relative to vehicle control and -log10(P value) calculated vs. vehicle control; two-tailed multiple paired Student's t tests. (C) Formation of ALOX5 and ALOX12/15 products in M1-like macrophages and EETs in M2-like macrophages. Mean (A, B) or mean ± SEM and single data (C) from n = 2 (5 1 µM, M1) or n = 3 independent experiments. P values given vs. vehicle control (C); mixed-effects model (REML) ANOVA of log data or repeated measure one-way ANOVA of log data (C) + Dunnett's post hoc tests.
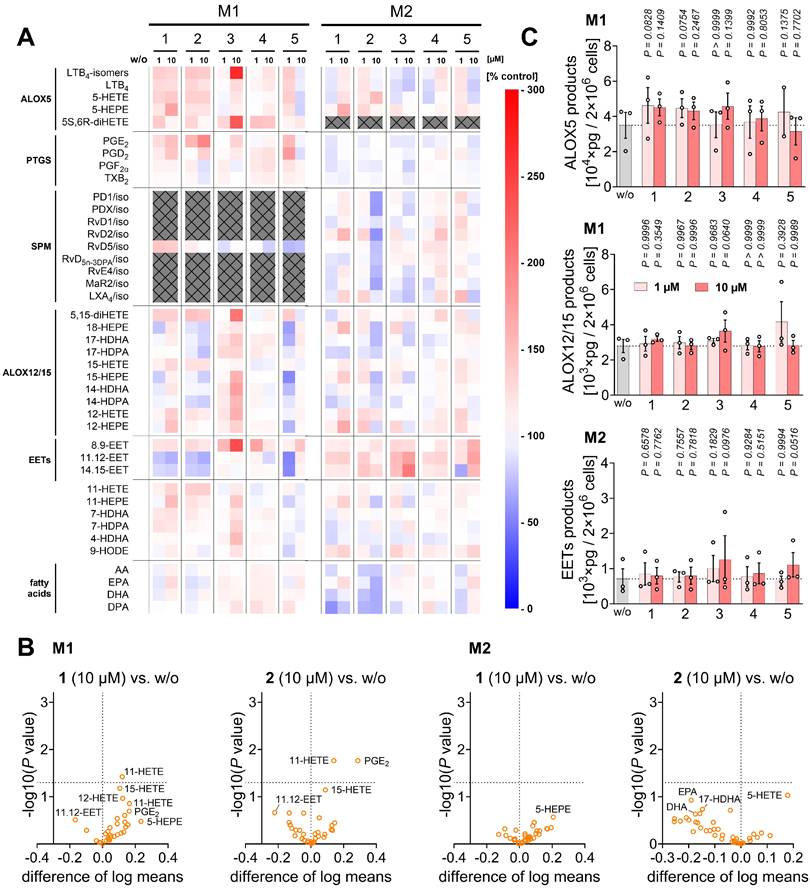
To assess whether compounds 1-5 alter the capacity of PBMCs to produce lipid mediators, cells were preincubated with the compounds for 48 h, then washed before eliciting lipid mediator production with the Ca²⁺ ionophore A23187. Because treatment with compound 2 (10 µM) slightly decreased PBMC metabolic activity (Figure S1B), lipid mediator concentrations were normalized to viable cell numbers to avoid overestimating inhibitory effects due to cytotoxicity.
Compounds 1 and 2, as well as 3 and 4, which were less potent in short-term incubations, showed a similar profile in the long-term experiments, characterized by inhibition of ALOX5 product formation (significant for 2 and 4) and tendentially increased EET levels (mainly 5,6-EET and 8,9-EET), except for 4 (Figure 7A, B, Table S4). Mechanistically, the reduced ALOX5 product formation was not due to decreased ALOX5 expression or phosphorylation by phospho-mitogen-activated protein kinase kinase 1/2 (p-MAP2K1/2, p-MEK1/2) (Figure 7C), which promotes ALOX5 nuclear translocation [120]. The modest reduction of PUFA release, particularly AA/20:4, may contribute to the decreased ALOX5 and PTGS product formation observed with 4, whereas 2 actually tended to enhance AA/20:4 release (Figure 7B, D).
Mitrephorone 2 reprograms PBMC lipid mediator production towards an anti-inflammatory profile. (A-D) PBMCs (1×10⁷) were preincubated with vehicle (DMSO, 0.1%) or mitrephorones for 48 h, washed (C), and subsequently treated with A23187 to induce lipid mediator formation (A, B, D). (A) Levels of ALOX5 products, EETs, and 8,9-EET. (B) Heatmap of mean percentage changes in oxylipin and fatty acid levels relative to vehicle. Lipid mediators are grouped as ALOX5 products, PTGS products, endocannabinoids (EC), monohydroxylated ALOX12/15 products, EETs, and free PUFAs. (C) ALOX5 and MAP2K1/2 protein expression and MAP2K1/2 phosphorylation determined by Western blot (representative of n = 3 independent experiments). Uncropped blots are shown in the raw image file. The vehicle controls are identical to Waltl et al. [83]. (D) Levels of PUFAs, ALOX12/15 products, PTGS products, and TXB2. Mean (B) or mean ± SEM and single data (A, C, D) from n = 3 (C) or n = 3-4 (A, B, D) independent experiments. P values given vs. vehicle control (A, C, D); repeated measures one-way ANOVA or mixed-effects model (REML) ANOVA of log data (A, D) + Dunnett's post hoc tests and two-tailed paired Student's t test of log data for pairwise comparisons as indicated by bars and P values (C) in brackets (A, D). The vehicle controls shown in A-D are identical to those published previously [83].
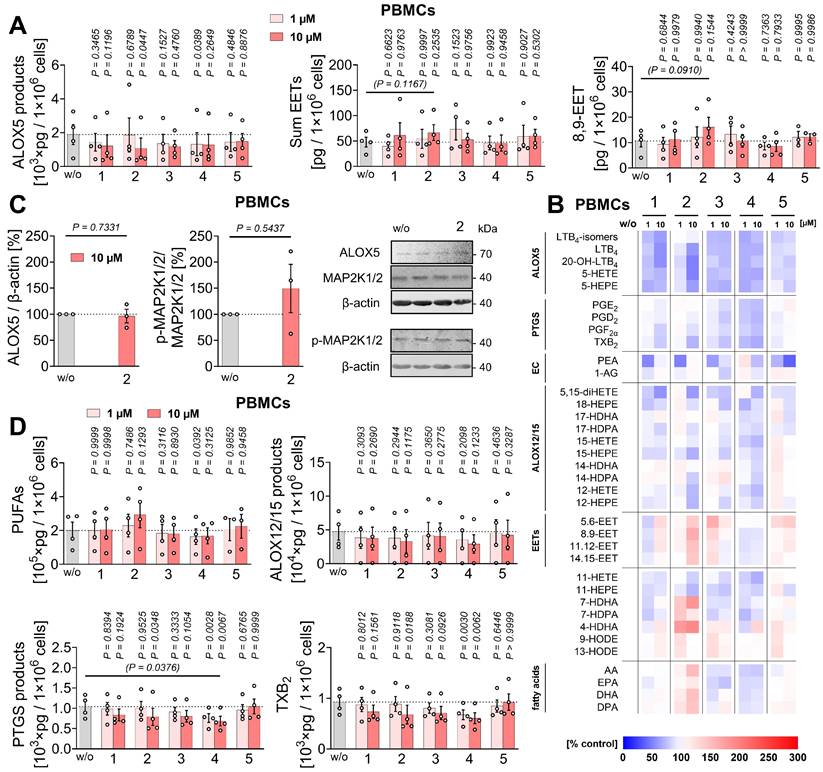
In contrast to short-term incubation, compounds 1-4 reduced overall PTGS-derived prostanoid formation (significant for 2 and 4), with 2 tending to increase PUFA release (Figure 7B, D), potentially facilitating EET production (Figure 7A, B). While 1 and 2 preferentially decreased TXB2 levels (mainly derived from platelet contamination via PTGS1 and TX synthase in PBMC preparations [121, 122]), 3 and 4 caused a more balanced reduction of major PTGS products (Figure 7B).
Overall, long-term treatment with 1-4 decreased ALOX5 and PTGS product formation, tended to increase EET levels, and exerted divergent different effects on PUFA release, with compounds 2 and 4 being most effective.
Compound 2 depletes cholesteryl esters (CEs) and promotes a peroxidation-protective lipid composition in PBMCs
The content and composition of phospholipids and neutral lipids are dysregulated in liver pathologies such as steatosis [5, 123-125], control cellular susceptibility to peroxidative damage and ferroptosis [57, 70], and determine the fatty acids available for the production of immunoregulatory lipid mediators [31, 116, 126]. Consequently, changes in the cellular lipid profile can have profound effects on liver function and disease progression [3, 127-129], while shaping ferroptosis sensitivity [57, 70] and the capacity for lipid mediator biosynthesis over time [116, 126, 130, 131].
We investigated whether compounds 1-5 exploit these mechanisms by quantitatively analyzing 202 lipids from 18 subclasses of glycerophospholipids, sphingolipids, neutral lipids, and free fatty acids in PBMCs (Figure 8A, Figure S4, Table S5). Notably, compound 2 strongly reduced cellular levels of CEs (Figure 8B), a major component of lipid droplets alongside TGs [132, 133], which are positively associated with metabolic diseases such as MASLD and atherosclerosis [134-137]. Free cholesterol levels did not decrease (Figure 8B), suggesting that the effect is not due to inhibition of de novo cholesterol biosynthesis, but rather relies on CE hydrolysis with subsequent cholesterol metabolism or excretion.
Mitrephorone 2 reduces CE levels and reorganizes the fatty acid composition of neutral lipids in PBMCs. (A-F) PBMCs (4×10⁶) were treated with vehicle (DMSO, 0.1%) or mitrephorones for 48 h, and cellular lipid composition was analyzed. (A) Heatmap of mean percentage changes in the amount of lipid subclasses relative to vehicle. (B) Total CE and cholesterol content. (C) Total TG and saturated TG levels. (D) Fatty acid composition of TG and CE, highlighting the fractions of SFAs, MUFAs, PUFAs, DPA/22:5 plus DHA/22:6, and AA/20:4. (E) Relative proportion of TG species (x-axis) plotted against their percentage differences following treatment with 2 (10 µM) compared to vehicle (difference of vehicle = 0%) (y-axis). (F) Heatmap of mean percentage changes in the relative proportions of TG and CE species relative to vehicle. Mean (A, E, F) or mean ± SEM (D top) and single data (B, C, D bottom) from n = 2 (A CL 3 - 1 µM, B cholesterol 4), n = 4 (A-F w/o), or n = 3 (A-F) independent experiments. P values given vs. vehicle control (B-D) or **P < 0.01 vs. vehicle control (D); mixed-effects model (REML) ANOVA (D top) of log data (B, C, D bottom) + Dunnett's post hoc tests and two-tailed paired Student's t test of log data (B, C, D bottom) for pairwise comparisons as indicated by bars and P values in brackets. The vehicle controls shown are identical to those published previously [83]. PC, phosphatidylcholine; LPC, lysophosphatidylcholine; PE, phosphatidylethanolamine; LPE, lysophosphatidylethanolamine; PG, phosphatidylglycerol; PI, phosphatidylinositol; PS, phosphatidylserine; CL, cardiolipin; TG, triglyceride; DG, diacylglycerol; CE, cholesteryl ester; So, sphingosine; (dh)Cer, (dihydro)ceramide; HexCer, hexosylceramide; C1P, ceramide-1-phosphate; (dh)SM, (dihydro)sphingomyelin; FFA, free fatty acid.
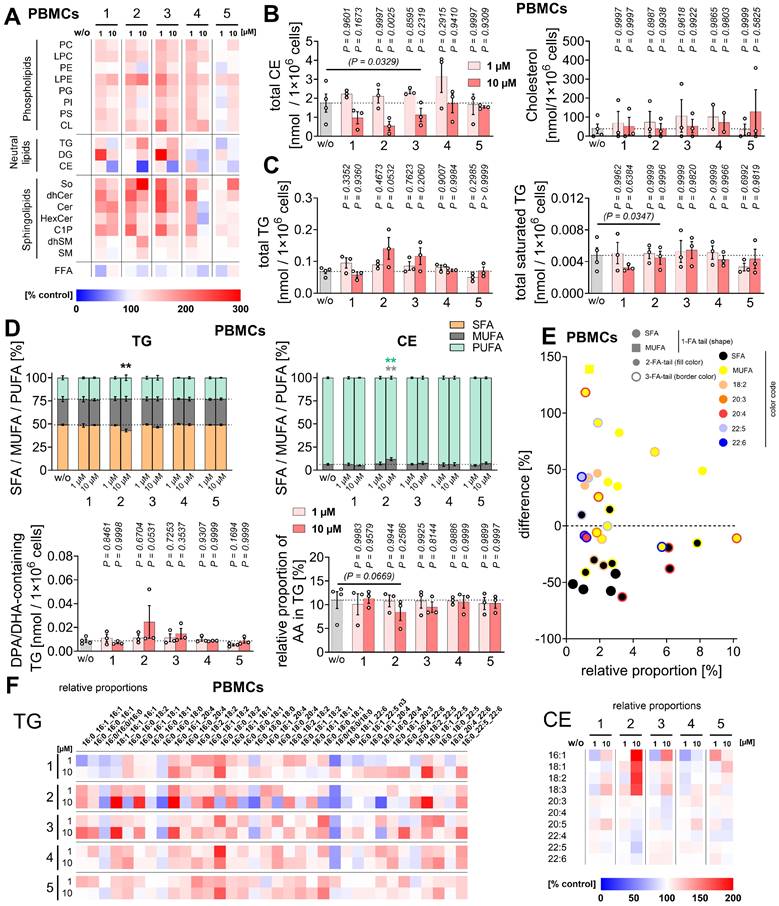
Intracellular TG levels, which like CEs are dysregulated in metabolic disease and can serve as an disease indicator [138-140], were increased (Figure 8C). This accumulation was mainly driven by monounsaturated fatty acid (MUFA)-containing species relative to SFA-containing ones, while the overall proportion of PUFAs remained constant despite AA/20:4 depletion (Figure 8C-F). Accordingly, compound 2 increased the proportion of MUFA-containing CEs at the expense of PUFA-containing species (Figure 8D, F).
These shifts in CE and TG fatty acid composition are consistent with a reduced susceptibility of lipid droplets to peroxidative damage [141, 142], given that lipid droplets have recently been identified as possible initiation sites for ferroptosis [143, 144]. In addition, compound 2 tended to increase total TG levels (including PUFA-containing species at an unchanged ratio). This alteration, together with enhanced lipid droplet formation, has been linked to ferroptosis protection by buffering excess free PUFAs and thereby limiting their incorporation into membrane phospholipids, which would otherwise sensitize cells to ferroptosis [70, 145, 146].
To explore lipid alterations induced by mitrephorones that may affect ferroptosis sensitivity, we constructed a global lipid co-regulation network. Pearson correlations were calculated from percentage changes in 202 lipid species measured in PBMCs. Lipids with strong positive correlations (r ≥ 0.7) were positioned close to each other and connected by edges (Figure 9). Changes in individual lipid species induced by compounds 1-5 were then correlated with protection of human HepaRG hepatocytes from RSL3-induced ferroptosis, assessed by measuring metabolic activity via MTT assay. Positive and negative correlations are indicated in red and blue, respectively. The strongest positive correlations with ferroptosis protection were observed for TG and CE species, particularly within a cluster of MUFA- and PUFA-containing TGs. Similar results were obtained when the network was based on relative lipid proportions normalized to 100% of the respective lipid subclasses (Figure S5). These findings suggest that mitrephorone-induced changes in neutral lipids, abundant in lipid droplets, are associated with ferroptosis protection, although whether this relationship is causal remains unresolved.
Compound 1-5-induced changes in TG fatty acid composition of PBMCs correlate with ferroptosis protection in hepatocytes. Correlation-based lipid network showing positive lipid-lipid correlations (r ≥ 0.7). Lipid species are represented as nodes (see Figure S4 for detailed information). The network combines data from PBMCs treated with compounds 1-5 (1 and 10 µM each) for 48 h and was calculated from the mean percentage changes in lipid amounts relative to vehicle control from n = 2 (CL 3 - 1 µM), n = 4 (w/o), or n = 3 independent experiments. Node color indicates the strength and direction of Pearson correlations between mitrephorone 1-5 (1 µM)-induced changes in PBMC lipid species and the mean percentage changes in the metabolic activity of RSL3-treated HepaRG cells (Figure 2A) within 48 h relative to vehicle control: positive correlations (r ≥ 0.7) are shown in red, negative correlations (r ≤ -0.7) in blue; n = 2 (CL 3 - 1 µM), n = 4 (w/o), or n = 3 independent experiments.
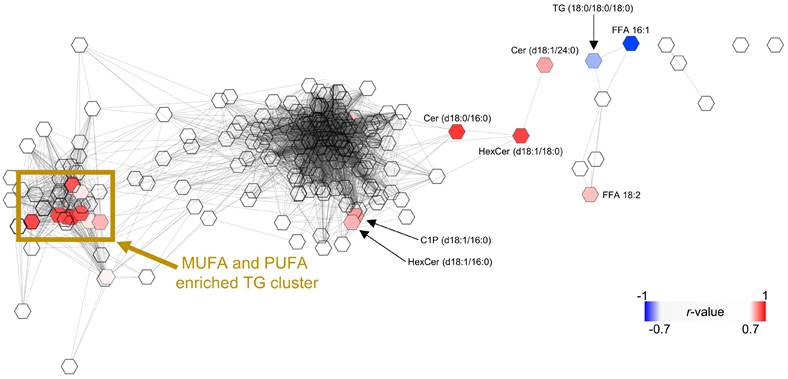
Membrane lipids are composed of glycerophospholipids and sphingolipids, the levels of which tended to increase upon treatment with compound 2 (Figure 8A), reaching significance for So, dhSM, and SM (Figure 10A, Figure S6A). The fatty acid composition, including PUFAs, was not markedly affected in either glycerophospholipids or sphingophospholipids (Figure 10B, C, Figure S6B), arguing against a redirection of AA/20:4 from TGs to phospholipids.
Mitrephorone 2 leads to the accumulation of sphingolipids and a PE remodeling intermediate in PBMCs. (A-D) PBMCs (4×10⁶) were preincubated with vehicle (DMSO, 0.1%) or mitrephorones for 48 h, and cellular lipid composition was analyzed. (A) Content of sphingosine (So) and (dihydro)sphingomyelin [(dh)SM]. (B) Fatty acid composition of glycerophospholipid and sphingolipid species, highlighting the fractions of SFAs, MUFAs, and PUFAs. (C) Heatmap of mean percentage changes in the relative proportions of sphingolipid species relative to vehicle. (D) Lyso-PE levels. Mean (C) or mean ± SEM (B) and single data (A, D) from n = 3 independent experiments. P values given vs. vehicle control; mixed-effects model (REML) ANOVA (B) of log data (A, D) + Dunnett's post hoc tests. The vehicle controls shown are identical to those published previously [83].
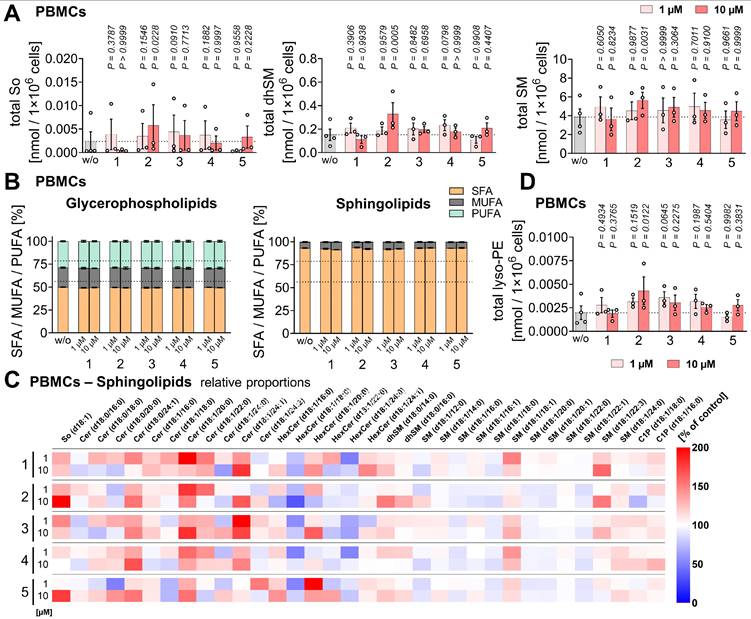
Interestingly, lysophosphatidylethanolamine (lyso-PE) levels were substantially increased in cells treated with 2 (Figure 10D, Figure S4), suggesting enhanced PE turnover by PLA1 or PLA2 isoenzymes [147]. Since PE is a major phospholipid subclass peroxidized during ferroptosis [54-56], and specific PLA2s protect against ferroptosis by releasing oxidized fatty acids [148, 149], it is tempting to speculate that increased PE remodeling removes peroxidized or truncated fatty acids that might otherwise disrupt membrane architecture [57, 58].
Other mitrephorones (1, 3, and 4) showed similar but less pronounced effects on PBMC lipid composition, with some differences (Figure 8A-D, E, Figure S4, Figure S6). For example, compound 4 did not substantially decrease CE or increase TG levels (Figure 8C, D, F). Overall, our data indicate that compound 2 in particular induces changes in neutral lipid and phospholipid composition that may alleviate (cholesterol-driven) steatosis and other diseases while decreasing susceptibility to ferroptosis.
Compound 2 reduces TG levels and mitigates loss of metabolic activity in an immunocompetent steatosis model in vitro
To better understand how the unique pharmacological profile of compound 2 might translate into clinical efficacy, we investigated its effects in four cell-based disease models at the intersection of (lipid) metabolic disease and inflammation. First, we assessed the uptake and accumulation of oxidized low-density lipoprotein (oxLDL) by human monocyte-derived macrophages, a critical step in atherosclerosis progression that generates foam cells and propagates arterial inflammation [137, 150]. Second, we co-cultured HepaRG hepatocytes and PBMCs, the latter serving as a surrogate for hepatic Kupffer cells, and challenged this immunocompetent 2D hepatocyte model with three lipid-based stressors. i) A balanced mixture of PA/16:0 and OA/18:1 (1:2) to induce massive lipid overload, mimicking steatosis [138, 151]; ii) excess saturated PA/16:0, causing severe lipotoxic stress [152, 153]; or iii) polyunsaturated AA/20:4, which promotes peroxidative stress and sensitizes cells to ferroptosis when incorporated into membranes [56, 70], while simultaneously boosting the production of AA/20:4-derived pro-inflammatory lipid mediators [28].
Compound 2 did not attenuate oxLDL-induced intracellular lipid accumulation in macrophages, as measured by Oil-Red-O staining (Figure 11A), nor did it reduce saturated or PUFA-induced stress in hepatocyte-PBMC co-cultures, as assessed by measuring metabolic activity (Figure 11B), viable cell number, and membrane integrity (Figure 11C). However, during lipid overload with PA/OA, 2 significantly increased cellular metabolic activity (Figure 11B, D) without affecting viable cell number or membrane integrity (Figure 11C). This increase in metabolic activity was accompanied by reduced levels of TGs, but not CE, reaching significance for individual species such as TG(16:0/16:0/16:0) (Figure 11E-G, Table S6), while Oil-Red-O staining of lipid droplets was not reduced and even tended to increase (Figure 11H, I, Figure S7A). In contrast, the peroxisome proliferator-activated receptor γ (PPARγ) agonist pioglitazone and, by trend, metformin and simvastatin, clinically used drugs that directly or indirectly target lipid metabolism in patients with metabolic syndrome [7-12], increased cellular TG levels (Figure S8A) and, in the case of simvastatin, reduced lipid droplet accumulation (Figure S8B, C) together with a trend toward lower CE levels (Figure S8A). However, none of these treatments increased metabolic activity (Figure S8D).
Mitrephorone 2 alleviates lipid overload in cocultures of hepatocytes and PBMCs. (A) Serum-starved MGM-CSF (2.5×10⁵) were preincubated with vehicle (DMSO, 0.1%), 2, or simvastatin ('SIM'; 100 µM) for 1 h and subsequently exposed to oxLDL for 48 h before Oil-Red-O (ORO) staining. (B-J) HepaRG cells and PBMCs were co-cultured (1:1) and preincubated with fatty acids (PA/16:0: 0.2 mM; PA/16:0 and OA/18:1: 1 mM, 1:2; AA/20:4 as indicated) for 24 h. Cells were then treated with vehicle (DMSO, 0.1%) or 2 (10 µM) and incubated for another 24 h. (B) Metabolic activity (MTT assay). (C) Membrane integrity and viable cell numbers. (D) Metabolic activity of PA/OA-treated cells (MTT assay). (E) Total TG and CE content. (F) Content of TG and selected TG species in PA/OA-treated cells. (G) Heatmap of mean percentage changes in the amount of TG and CE species relative to vehicle. Crossed boxes indicate CEs that were not detected. (H, I) ORO staining: absorbance of organic extracts (H) and microscopic images (I). (J) IL-1β levels; n.d., not detected. Mean (G) or mean ± SEM and single data (A-C, E, J) or interconnected single data (D, F, H) from n = 3 independent experiments. P values given vs. vehicle control (A-F, H, J); repeated measures one-way ANOVA of log data (A) + Dunnett's post hoc tests or two-tailed paired Student's t tests (C left) of log data (B, C right, D-F, H, J) for pairwise comparisons.
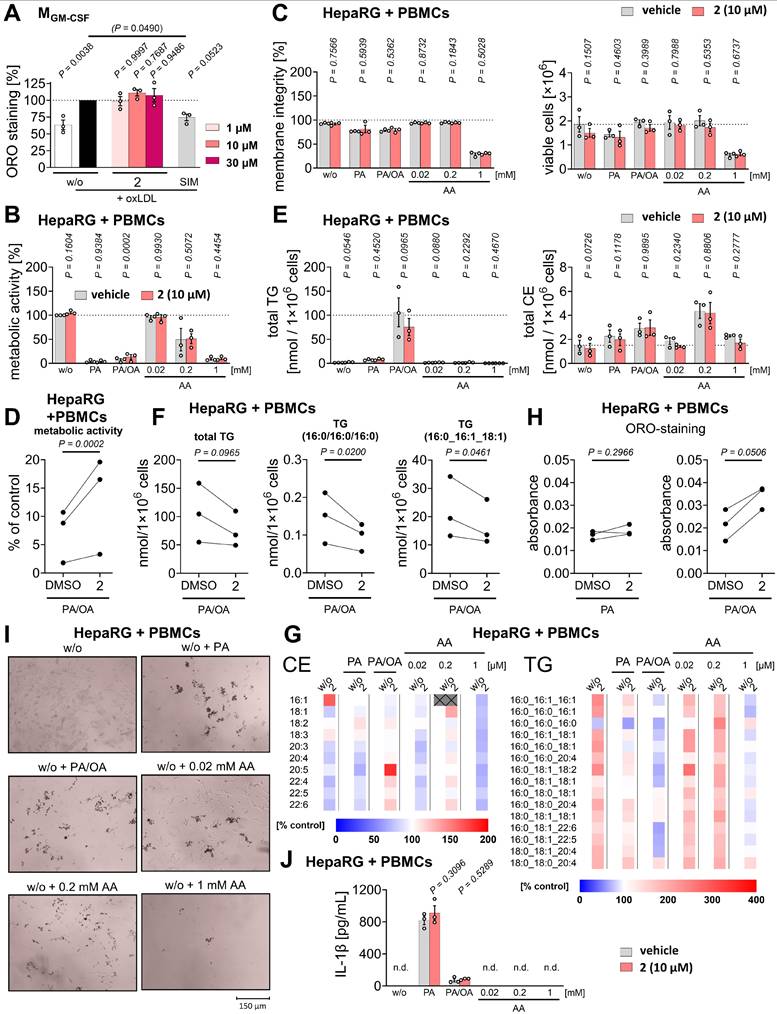
Interestingly, in unchallenged hepatocyte-PBMC co-cultures (Figure 11E, Figure S7B, C), compound 2 affected lipid metabolism similarly to PBMCs alone (Figure 8), depleting CEs (significant for AA/20:4-containing CEs) and tendentially enriching TGs, in contrast to its effect under PA/OA-induced lipid overload (Figure 11E-G). Compound 2 did not suppress the PA- or PA/OA-induced increase in cytokine expression, as exemplarily shown for IL-1β (Figure 11J).
In conclusion, in non-stressed hepatocyte-immune cell cultures reflecting pre-disease conditions, compound 2 adjusts neutral lipid metabolism, resulting in decreased CE levels that may contribute to prevention of metabolic disease. During acute lipid overload, 2 exhibits a distinct pharmacological profile, moderately buffering TG accumulation while enhancing cellular metabolic capacity under stress.
Discussion
Chronic liver diseases are driven by a variety of endogenous and exogenous factors and are influenced by diet, lifestyle, and genetic predisposition [6, 49, 50, 80, 138, 154]. Despite their mechanistic and phenotypic diversity, they share key processes that drive initiation and progression: metabolic dysregulation [155-158], low-grade persistent inflammation [159-161], and tissue degeneration with loss of function [51, 162]. Our search for small molecules that simultaneously target these three pillars led to the identification of ent-trachylobane diterpenoids that (i) inhibit GPX4-dependent ferroptosis in hepatocytes, (ii) suppress the production of pro-inflammatory lipid mediators (i.e., LTs) and cytokines (e.g., IL-1β, IL-12), (iii) modestly enhance the levels of anti-inflammatory mediators (i.e., EETs), and (iv) redirect neutral lipid composition in immune cells and hepatocyte-immune cell co-cultures.
Mechanistically, mitrephorones exert anti-ferroptotic activity in hepatocytes by protecting membranes from phospholipid peroxidation under radical stress, as demonstrated for the most active compound 2. Consistent with the absence of structural features characteristic of efficient radical scavengers, compound 2 requires a cellular context to confer protection against membrane peroxidation. Although the expression of several key factors involved in redox homeostasis, membrane quality control, iron metabolism, and lipid metabolism is modulated, these effects are largely comparable to those observed for the selective ferroptosis inhibitor ferrostatin-1. Moreover, central hallmarks of ferroptosis, including the labile iron pool and glutathione metabolism, remain unaffected, pointing toward an unconventional anti-ferroptotic mechanism. While the precise mechanisms remain incompletely defined, our data suggest that mitrephorone-mediated ferroptosis protection may involve adaptations in phospholipid and neutral lipid remodeling. Specifically, mitrephorones increase PE turnover, possibly facilitating the removal of membrane peroxides and truncated fatty acids [149, 163, 164]. In parallel, they deplete PUFAs from CEs while increasing the MUFA ratio of both CEs and TGs, the principal constituents of the lipid droplet core [132, 133], and expand total TG levels, potentially buffering excess PUFAs, at least under non-disease conditions.
How the PUFA ratio impacts ferroptosis sensitivity is not fully understood and seems to be context-dependent. Similar to SFAs, whose incorporation into lipid droplets protects cells from lipotoxic stress [153], sequestration of PUFAs in lipid droplets is widely thought to reduce ferroptosis susceptibility by limiting their incorporation into membrane phospholipids [58, 165]. Interestingly, lipid droplet biogenesis from exogenous fatty acids via ACSL3, an enzyme with substrate preference for palmitate [166, 167], has likewise been associated with increased ferroptosis resistance [165, 168-171]. By contrast, lipid droplet peroxidation can induce ferroptosis in certain contexts [172], and selective autophagic degradation of lipid droplets has also been shown to promote ferroptosis [173, 174]. How changes in lipid droplet fatty acid composition influence ferroptosis sensitivity remains less well understood, particularly under conditions where neither lipid droplet volume nor phospholipid composition are affected, and where it is unclear whether lipid droplet peroxidation alone can propagate oxidative damage to the plasma membrane. Mitrephorone 2 meets these criteria and thus enables us to address this question. It shifts TG fatty acid composition from SFAs toward MUFAs in PBMCs (used here as a surrogate for hepatic Kupffer cells), while conferring ferroptosis protection in hepatocytes. The total PUFA content of TG increased in parallel with total TG levels, leaving the PUFA proportion within TG unchanged. Although we cannot exclude that these effects arise from independent and possibly compensatory mechanisms, several observations argue for a causal link. First, ferroptosis can be initiated in different compartments and spread from the ER to the plasma membrane [143, 175]. Second, while lipid droplet peroxidation has not been systematically studied, lipid droplets are highly dynamic and establish contact sites with the ER, mitochondria, and lysosomes [133], all of which can initiate ferroptotic lipid peroxidation [141-143, 172, 176].
Mitrephorone 2 shows a preference for suppressing ferroptosis in hepatocytes. In contrast, it did not prevent apoptosis or necroptosis, nor did it attenuate an undefined type of cell death triggered by pyroptosis inducers. Under necroptotic conditions, 2 even reduced cellular metabolic activity, indicating a potential context-dependent liability that warrants further investigation, particularly with respect to necroptosis-driven degenerative diseases.
Mitrephorones limit inflammation by antagonizing ALOX5AP. In addition, they modulate PUFA release and prostanoid formation, and interfere with the long-term capacity of innate immune cells, including M1 and M2 macrophages, to produce lipid mediators. Notably, M2 macrophages can arise from M1-like Kupffer cells during high-fat feeding [177], possess anti-inflammatory and tissue-regenerative properties [22, 31, 178], and are critically involved in the pathogenesis of liver disease [22, 178]. The efficacy of mitrephorones, and in some cases even the direction of cytokine and lipid mediator regulation, varies considerably between experimental systems and stimuli. For instance, compounds 1 and 2 efficiently suppressed the expression of pro-inflammatory cytokines such as IL-1β in LPS-stimulated PBMCs, whereas 2 failed to reduce IL-1β levels in PBMC/hepatocyte co-cultures challenged with PA/16:0. These differences likely reflect distinct signaling mechanisms. LPS activates Toll-like receptor 4 (TLR4) signaling to induce cytokine expression [179], whereas PA/16:0 employs additional and less well-defined pathways. Reported mechanisms include immune cell activation via TLR4, voltage-gated potassium channels, lectin-type oxidized LDL receptor-1, and ROS generation [180-185]. Differences in experimental design may also contribute. In PBMC cultures, compound 2 was applied before LPS stimulation, thereby interfering with the initiation of cytokine expression. In contrast, in PA/16:0-challenged co-cultures, 2 was added after the challenge, when the prerequisites for efficient cytokine expression were already established, potentially involving altered lipid mediator profiles [34, 186, 187].
The effects of compound 2 on neutral lipid metabolism are mixed and difficult to interpret in the context of clinical efficacy. While CE levels are favorably reduced in hepatocyte-immune cell co-cultures and in immune cells, TG levels tend to increase, with this pattern being reversed under metabolic stress caused by lipid overload. How such a lipid profile translates into pre-clinical settings remains to be determined and likely depends on the precise metabolic disease state. On the one hand, 2 seems to protect healthy or pre-disease cells from metabolic dysregulation, particularly when driven by cholesterol accumulation.
On the other hand, 2 appears to preferentially rebalance TG-driven lipid alterations, which may have adverse consequences in hypercholesterolemia. Importantly, the TG-lowering effect coincides with enhanced metabolic activity of hepatocyte-immune cell co-cultures in a simplistic in vitro MASLD model, suggesting protection against cytotoxic stress induced by lipid overload. However, the systemic consequences remain difficult to predict, as plasma TG and cholesterol clearance rely on hepatic lipid uptake, storage, and metabolism [3, 188, 189]. Given these unique activities of 2 in rearranging lipid metabolism, the mitrephorone toolbox presented here provides a valuable resource to dissect these interrelationships and guide drug development. Small structural modifications enable, to some extent, the fine-tuning of cellular lipid profiles as well as lipid mediator and cytokine production, according to the requirements of specific disease contexts.
Despite the comprehensive mechanistic insights provided here into the action of 2 in primary cells, cell lines, and co-culture models, important questions regarding its precise molecular mechanism remain. We show that 2 inhibits ferroptosis by suppressing phospholipid peroxidation in a cellular context, without affecting other hallmark pathways of ferroptosis, including the glutathione-GPX4 axis, (phospho)lipid metabolism, or iron mobilization. With respect to lipid mediator modulation in innate immune cells, we attribute the most robust effect - the suppression of ALOX5 product formation - to antagonism of ALOX5AP. In contrast, the mechanistic basis for the inhibition of lipid peroxidation and the context-dependent modulation of other lipid mediator classes, as well as the direct molecular targets responsible for reduced TG levels and protection against lipid overload stress, remains unclear. Elucidation of these mechanisms will benefit from multi-omics approaches, including interactomics, ideally applied in a cell-type-specific manner.
Caution is also warranted when interpreting mitrephorone 2's potential hepatoprotective activity in vivo in metabolic liver disease. In vivo animal data are currently lacking, largely due to the limited availability of sufficient amounts of 2, which requires a 10-step stereoselective synthesis [82]. This limitation may be overcome by systematic optimization of the core structure of 2 to generate synthetically more accessible derivatives that retain the activity of the parent compound. Given the drug-like properties of compound 2 according to Lipinski's rule of five (Mr = 344, logP = 2.6, 1 hydrogen bond donor, 4 hydrogen bond acceptors) [190], the lipid-regulatory, anti-inflammatory, and anti-ferroptotic activities observed here at 1-10 µM fall within a pharmacologically relevant range, which now requires further delineation by pharmacodynamic and kinetic studies in vivo.
Few studies have previously addressed the biological activities of compounds 1 and 2. Reported effects include disruption of membrane integrity in human cancer cell lines (KB > MCF-7 > H460 > Sf-268; EC50 = 20-90 µM) as well as antibacterial (Micrococcus luteus, Mycobacterium smegmatis; ≥ 63 µM) and antifungal activities (Saccharomyces cerevisiae, Aspergillus niger; ≥ 63 µM), with 1 being more potent than 2 [81]. While the concentrations required for antitumor activity appear high, they might still be achievable in vivo after oral or intravenous administration, whereas antimicrobial effects are likely confined to cutaneous or gastrointestinal applications.
Conclusion
We have identified mitrephorones as drug-like small molecules occupying a largely unexplored chemical space that qualify for further pre-clinical evaluation as hepatoprotective agents. They act on the three central pillars of degenerative liver diseases in hepatocytes, immune cells, and co-cultures - aberrant neutral lipid storage and metabolism, persistent inflammation, and cell death under metabolic stress, particularly ferroptosis. Their molecular mechanisms include i) effective inhibition of membrane peroxidation, ii) ALOX5AP antagonism, iii) NF-κB-independent suppression of pro-inflammatory cytokine release, iv) reduced inducible capacity of immune cells to produce lipid mediators, v) redirection of neutral lipids to lower intracellular CE or TG levels, vi) adaptations in phospholipid remodeling and neutral lipid fatty acid composition that counteract (per)oxidative membrane stress, and vii) potentially an upregulation of anti-inflammatory EETs, alongside broader changes in global lipid composition. Importantly, these activities are tunable by small structural modifications, providing access to a new spectrum of derivatives with optimized activity profiles tailored to specific disease contexts. Small molecules with such multi-targeted activity may overcome the limitations of single-pathway interventions in the treatment or prevention of necroinflammatory liver diseases, which otherwise progress toward cirrhosis, fibrosis, and hepatocellular carcinoma - an aspect that needs to be addressed in future preclinical studies.
Abbreviations
AA/20:4: arachidonic acid; ALOX: lipoxygenase; ALOX5AP: 5-lipoxygenase-activating protein; C1P: ceramide-1-phosphate; CE: cholesteryl ester; (dh)CER: (dihydro)ceramide; CL: cardiolipin; PTGS: cyclooxygenase; CYP: cytochrome P450 monooxygenase; DG: diacylglycerol; EET: epoxyeicosatrienoic acid; FCS: fetal calf serum; GPX4: glutathione peroxidase 4; GSH: glutathione; GSSG: glutathione disulfide; HBSS: Hank's buffered salt solution; (di)HETE: (di)hydroxyeicosatetraenoic acid; HexCer: hexosylceramide; 4-HNE: 4-hydroxynonenal; IL: interleukin; IL-1ra: interleukin-1 receptor antagonist; iso: isomer; LPS: lipopolysaccharide; LT: leukotriene; MaR: maresin; MASLD: metabolic dysfunction-associated steatotic liver disease; MAP2K: mitogen-activated protein kinase kinase; MRM: multiple reaction monitoring; MUFA: monounsaturated fatty acid; MTT: 3-(4:5-dimethylthiazol-2-yl)-2:5-diphenyltetrazolium bromide; NF-κB: nuclear factor kappa B; NFKBI: nuclear factor kappa B inhibitor; NLRP3: NLR family pyrin domain containing 3; OA/18:1: oleic acid; oxLDL: oxidized low-density lipoprotein; PA/16:0: palmitic acid; PBMC: peripheral blood mononuclear cell; PC: phosphatidylcholine; PD: protectin; PE: phosphatidylethanolamine; PG: phosphatidylglycerol; PI: phosphatidylinositol; PLA2: phospholipase A2: PS: phosphatidylserine; PUFA: polyunsaturated fatty acid; ROS: reactive oxygen species; RIPK1: receptor interacting serine/threonine kinase 1; Rv: resolvin; SA: sphinganine; SACM: Staphylococcus aureus-conditioned medium; SFA: saturated fatty acid; (dh)SM: (dihydro)sphingomyelin; So: sphingosine; SPM: specialized pro-resolving mediator; TG: triglyceride; TNF: tumor necrosis factor; TX: thromboxane.
Supplementary Material
Supplementary Figures S1-S8 and Table S1.
Tables S2-S6 as well as raw images.
Acknowledgements
The authors thank Gabriel Knoll and Julia Grander for excellent technical assistance.
Illustrations in the graphical abstract were created with BioRender.com.
For the purpose of open access, the authors have applied a CC BY public copyright license to any Author Accepted Manuscript version arising from this submission.
Funding
Research activities of A.K. related to the subject of this article were funded in part by the Austrian Science Fund (FWF) (10.55776/I4968, 10.55776/P36299, 10.55776/PAT9018824). T.M. acknowledges support from the Austrian Science Fund (FWF) (10.55776/P33894), the Austrian Academy of Sciences (OeAW), and the Center for Molecular Biosciences CMBI. S.C.K. was supported by the Austrian Science Fund (FWF) (10.55776/RIC4054324). L.A.W. received funding from the Tyrolean Science Fund (TWF, F.16642/5- 2019), and L.L.X was supported by an Ernst Mach Grant (ASEA-UNINET) from Austria's Agency for education and internationalization (OeAD) (MPC-2022-02487).
AI usage statement
The authors declare that AI tools were used during the writing process.
Data availability
The mass spectrometric lipidomics data generated in this study have been deposited in the Metabolomics Workbench database (an international repository for metabolomics data and metadata, metabolite standards, protocols, tutorials and training, and analysis tools [191]) under the accession code PR002799 [ST004429, ST004485, ST004540, ST004487; https://doi.org/http://dx.doi.org/10.21228/M8VN9M]. All other data supporting the findings of the present study are either shown in the manuscript and Supporting Information or available from the corresponding author upon reasonable request.
Author contributions
Lorenz Waltl - Methodology, Investigation, Visualization, Writing - Original Draft, Writing - Review & Editing. Lukas A. Wein - Methodology, Investigation, Writing - Review & Editing. Leonhard Bereuter - Investigation, Visualization, Writing - Review & Editing. Fengting Su - Investigation, Visualization, Writing - Review & Editing. Henriett Barta - Investigation, Visualization, Writing - Review & Editing. Loc Le Xuan - Investigation, Writing - Review & Editing. David Holubek - Investigation, Visualization. Zahra Mahmoudi Eshkaftaki - Investigation. Katharina Puskac - Investigation. Anita Siller - Resources, Writing - Review & Editing. Harald Schennach - Resources, Writing - Review & Editing, Supervision. Eva-Maria Pferschy-Wenzig - Methodology, Writing - Review & Editing. Hans Schött - Methodology, Investigation, Writing - Review & Editing. Silvia Racedo - Investigation, Visualization, Writing - Review & Editing. Solveigh Koeberle - Methodology, Data Curation, Visualization, Writing - Review & Editing, Supervision, Funding acquisition. Thomas Magauer - Writing - Review & Editing, Supervision, Funding acquisition. Andreas Koeberle: Project administration, Conceptualization, Data Curation, Writing - Original Draft, Writing - Review & Editing, Supervision, Funding acquisition.
Competing Interests
The authors have declared that no competing interest exists.
References
1. Albillos A, Lario M, Alvarez-Mon M. Cirrhosis-associated immune dysfunction: distinctive features and clinical relevance. J Hepatol. 2014;61:1385-96
2. You M, Arteel GE. Effect of ethanol on lipid metabolism. J Hepatol. 2019;70:237-48
3. Bechmann LP, Hannivoort RA, Gerken G, Hotamisligil GS, Trauner M, Canbay A. The interaction of hepatic lipid and glucose metabolism in liver diseases. J Hepatol. 2012;56:952-64
4. Jeon YG, Kim YY, Lee G, Kim JB. Physiological and pathological roles of lipogenesis. Nat Metab. 2023;5:735-59
5. Gluchowski NL, Becuwe M, Walther TC, Farese RV Jr. Lipid droplets and liver disease: from basic biology to clinical implications. Nat Rev Gastroenterol Hepatol. 2017;14:343-55
6. Loomba R, Friedman SL, Shulman GI. Mechanisms and disease consequences of nonalcoholic fatty liver disease. Cell. 2021;184:2537-64
7. Ferraro RA, Leucker T, Martin SS, Banach M, Jones SR, Toth PP. Contemporary Management of Dyslipidemia. Drugs. 2022;82:559-76
8. Barter PJ, Rye KA. New Era of Lipid-Lowering Drugs. Pharmacol Rev. 2016;68:458-75
9. Harrison SA, Allen AM, Dubourg J, Noureddin M, Alkhouri N. Challenges and opportunities in NASH drug development. Nat Med. 2023;29:562-73
10. Zhang X, Lau HC, Yu J. Pharmacological treatment for metabolic dysfunction-associated steatotic liver disease and related disorders: Current and emerging therapeutic options. Pharmacol Rev. 2025;77:100018
11. Khan RS, Bril F, Cusi K, Newsome PN. Modulation of Insulin Resistance in Nonalcoholic Fatty Liver Disease. Hepatology. 2019;70:711-24
12. Sangro P, de la Torre Alaez M, Sangro B, D'Avola D. Metabolic dysfunction-associated fatty liver disease (MAFLD): an update of the recent advances in pharmacological treatment. J Physiol Biochem. 2023;79:869-79
13. Theodoridis X, Kalopitas G, Vadarlis A, Bakaloudi DR, Gkiourtzis N, Dionysopoulos G. et al. Comparative efficacy of different treatment modalities in the management of pediatric non-alcoholic fatty liver disease: A systematic review and network meta-analysis. Pharmacol Ther. 2022;240:108294
14. Koeberle SC, Kipp AP, Stuppner H, Koeberle A. Ferroptosis-modulating small molecules for targeting drug-resistant cancer: Challenges and opportunities in manipulating redox signaling. Med Res Rev. 2023;43:614-82
15. Mishima E, Conrad M. Nutritional and Metabolic Control of Ferroptosis. Annu Rev Nutr. 2022;42:275-309
16. Wallert M, Schmolz L, Koeberle A, Krauth V, Glei M, Galli F. et al. alpha-Tocopherol long-chain metabolite alpha-13'-COOH affects the inflammatory response of lipopolysaccharide-activated murine RAW264.7 macrophages. Mol Nutr Food Res. 2015;59:1524-34
17. Schmolz L, Wallert M, Rozzino N, Cignarella A, Galli F, Glei M. et al. Structure-Function Relationship Studies In vitro Reveal Distinct and Specific Effects of Long-Chain Metabolites of Vitamin E. Mol Nutr Food Res. 2017;61:1700562
18. Wallert M, Kluge S, Schubert M, Koeberle A, Werz O, Birringer M. et al. Diversity of Chromanol and Chromenol Structures and Functions: An Emerging Class of Anti-Inflammatory and Anti-Carcinogenic Agents. Front Pharmacol. 2020;11:362
19. Pein H, Ville A, Pace S, Temml V, Garscha U, Raasch M. et al. Endogenous metabolites of vitamin E limit inflammation by targeting 5-lipoxygenase. Nat Commun. 2018;9:3834
20. Guilliams M, Scott CL. Liver macrophages in health and disease. Immunity. 2022;55:1515-29
21. Liu R, Scimeca M, Sun Q, Melino G, Mauriello A, Shao C. et al. Harnessing metabolism of hepatic macrophages to aid liver regeneration. Cell Death Dis. 2023;14:574
22. Chen J, Deng X, Liu Y, Tan Q, Huang G, Che Q. et al. Kupffer Cells in Non-alcoholic Fatty Liver Disease: Friend or Foe? Int J Biol Sci. 2020;16:2367-78
23. Li JH, Hepworth MR, O'Sullivan TE. Regulation of systemic metabolism by tissue-resident immune cell circuits. Immunity. 2023;56:1168-86
24. Panigrahy D, Gilligan MM, Serhan CN, Kashfi K. Resolution of inflammation: An organizing principle in biology and medicine. Pharmacol Ther. 2021;227:107879
25. Koeberle A, Werz O. Natural products as inhibitors of prostaglandin E(2) and pro-inflammatory 5-lipoxygenase-derived lipid mediator biosynthesis. Biotechnol Adv. 2018;36:1709-23
26. Shimizu T. Lipid mediators in health and disease: enzymes and receptors as therapeutic targets for the regulation of immunity and inflammation. Annu Rev Pharmacol Toxicol. 2009;49:123-50
27. Gilbert NC, Newcomer ME, Werz O. Untangling the web of 5-lipoxygenase-derived products from a molecular and structural perspective: The battle between pro- and anti-inflammatory lipid mediators. Biochem Pharmacol. 2021;193:114759
28. Wang B, Wu L, Chen J, Dong L, Chen C, Wen Z. et al. Metabolism pathways of arachidonic acids: mechanisms and potential therapeutic targets. Signal Transduct Target Ther. 2021;6:94
29. Rouzer CA, Marnett LJ. Structural and Chemical Biology of the Interaction of Cyclooxygenase with Substrates and Non-Steroidal Anti-Inflammatory Drugs. Chem Rev. 2020;120:7592-641
30. Serhan CN, Gupta SK, Perretti M, Godson C, Brennan E, Li Y. et al. The Atlas of Inflammation Resolution (AIR). Mol Aspects Med. 2020;74:100894
31. Jordan PM, Werz O. Specialized pro-resolving mediators: biosynthesis and biological role in bacterial infections. FEBS J. 2022;289:4212-27
32. Radmark O, Werz O, Steinhilber D, Samuelsson B. 5-Lipoxygenase, a key enzyme for leukotriene biosynthesis in health and disease. Biochim Biophys Acta. 2015;1851:331-9
33. Levy BD, Clish CB, Schmidt B, Gronert K, Serhan CN. Lipid mediator class switching during acute inflammation: signals in resolution. Nat Immunol. 2001;2:612-9
34. Chiang N, Serhan CN. Specialized pro-resolving mediator network: an update on production and actions. Essays Biochem. 2020;64:443-62
35. Liu S, Alexander RK, Lee CH. Lipid metabolites as metabolic messengers in inter-organ communication. Trends Endocrinol Metab. 2014;25:356-63
36. Brennan E, Kantharidis P, Cooper ME, Godson C. Pro-resolving lipid mediators: regulators of inflammation, metabolism and kidney function. Nat Rev Nephrol. 2021;17:725-39
37. Lee ML, Matsunaga H, Sugiura Y, Hayasaka T, Yamamoto I, Ishimoto T. et al. Prostaglandin in the ventromedial hypothalamus regulates peripheral glucose metabolism. Nat Commun. 2021;12:2330
38. White PJ, St-Pierre P, Charbonneau A, Mitchell PL, St-Amand E, Marcotte B. et al. Protectin DX alleviates insulin resistance by activating a myokine-liver glucoregulatory axis. Nat Med. 2014;20:664-9
39. Liu X, Wang K, Wang L, Kong L, Hou S, Wan Y. et al. Hepatocyte leukotriene B4 receptor 1 promotes NAFLD development in obesity. Hepatology. 2023;78:562-77
40. Feigenson M, Eliseev RA, Jonason JH, Mills BN, O'Keefe RJ. PGE2 Receptor Subtype 1 (EP1) Regulates Mesenchymal Stromal Cell Osteogenic Differentiation by Modulating Cellular Energy Metabolism. J Cell Biochem. 2017;118:4383-93
41. Zhao H, Wu L, Yan G, Chen Y, Zhou M, Wu Y. et al. Inflammation and tumor progression: signaling pathways and targeted intervention. Signal Transduct Target Ther. 2021;6:263
42. Biswas P, Datta C, Rathi P, Bhattacharjee A. Fatty acids and their lipid mediators in the induction of cellular apoptosis in cancer cells. Prostaglandins Other Lipid Mediat. 2022;160:106637
43. Wang D, Dubois RN. Eicosanoids and cancer. Nat Rev Cancer. 2010;10:181-93
44. Haeggstrom JZ. Leukotriene biosynthetic enzymes as therapeutic targets. J Clin Invest. 2018;128:2680-90
45. Dennis EA, Norris PC. Eicosanoid storm in infection and inflammation. Nat Rev Immunol. 2015;15:511-23
46. Serhan CN, Yacoubian S, Yang R. Anti-inflammatory and proresolving lipid mediators. Annu Rev Pathol. 2008;3:279-312
47. Morisseau C, Hammock BD. Impact of soluble epoxide hydrolase and epoxyeicosanoids on human health. Annu Rev Pharmacol Toxicol. 2013;53:37-58
48. Tsurusaki S, Tsuchiya Y, Koumura T, Nakasone M, Sakamoto T, Matsuoka M. et al. Hepatic ferroptosis plays an important role as the trigger for initiating inflammation in nonalcoholic steatohepatitis. Cell Death Dis. 2019;10:449
49. Wu X, Fan X, Miyata T, Kim A, Cajigas-Du Ross CK, Ray S. et al. Recent Advances in Understanding of Pathogenesis of Alcohol-Associated Liver Disease. Annu Rev Pathol. 2023;18:411-38
50. Chen J, Li X, Ge C, Min J, Wang F. The multifaceted role of ferroptosis in liver disease. Cell Death Differ. 2022;29:467-80
51. Gautheron J, Gores GJ, Rodrigues CMP. Lytic cell death in metabolic liver disease. J Hepatol. 2020;73:394-408
52. Mao L, Zhao T, Song Y, Lin L, Fan X, Cui B. et al. The emerging role of ferroptosis in non-cancer liver diseases: hype or increasing hope? Cell Death Dis. 2020;11:518
53. Cui S, Ye J. MAFLD: a ferroptotic disease. Trends Mol Med. 2025
54. Tang D, Kang R, Berghe TV, Vandenabeele P, Kroemer G. The molecular machinery of regulated cell death. Cell Res. 2019;29:347-64
55. Wiernicki B, Dubois H, Tyurina YY, Hassannia B, Bayir H, Kagan VE. et al. Excessive phospholipid peroxidation distinguishes ferroptosis from other cell death modes including pyroptosis. Cell Death Dis. 2020;11:922
56. Kagan VE, Mao G, Qu F, Angeli JP, Doll S, Croix CS. et al. Oxidized arachidonic and adrenic PEs navigate cells to ferroptosis. Nat Chem Biol. 2017;13:81-90
57. Pope LE, Dixon SJ. Regulation of ferroptosis by lipid metabolism. Trends Cell Biol. 2023;33:1077-87
58. Aldrovandi M, Fedorova M, Conrad M. Juggling with lipids, a game of Russian roulette. Trends Endocrinol Metab. 2021;32:463-73
59. Saraev DD, Pratt DA. Reactions of lipid hydroperoxides and how they may contribute to ferroptosis sensitivity. Curr Opin Chem Biol. 2024;81:102478
60. Tang D, Chen X, Kang R, Kroemer G. Ferroptosis: molecular mechanisms and health implications. Cell Res. 2021;31:107-25
61. Yan B, Ai Y, Sun Q, Ma Y, Cao Y, Wang J. et al. Membrane Damage during Ferroptosis Is Caused by Oxidation of Phospholipids Catalyzed by the Oxidoreductases POR and CYB5R1. Mol Cell. 2021;81:355-69 e10
62. Zou Y, Li H, Graham ET, Deik AA, Eaton JK, Wang W. et al. Cytochrome P450 oxidoreductase contributes to phospholipid peroxidation in ferroptosis. Nat Chem Biol. 2020;16:302-9
63. Wenzel SE, Tyurina YY, Zhao J, St Croix CM, Dar HH, Mao G. et al. PEBP1 Wardens Ferroptosis by Enabling Lipoxygenase Generation of Lipid Death Signals. Cell. 2017;171:628-41 e26
64. Pratt DA. Targeting lipoxygenases to suppress ferroptotic cell death. Proc Natl Acad Sci U S A. 2023;120:e2309317120
65. Li Z, Lange M, Dixon SJ, Olzmann JA. Lipid Quality Control and Ferroptosis: From Concept to Mechanism. Annu Rev Biochem. 2024;93:499-528
66. Zheng J, Conrad M. Ferroptosis: when metabolism meets cell death. Physiol Rev. 2025;105:651-706
67. Berndt C, Alborzinia H, Amen VS, Ayton S, Barayeu U, Bartelt A. et al. Ferroptosis in health and disease. Redox Biol. 2024;75:103211
68. Yi J, Zhu J, Wu J, Thompson CB, Jiang X. Oncogenic activation of PI3K-AKT-mTOR signaling suppresses ferroptosis via SREBP-mediated lipogenesis. Proc Natl Acad Sci U S A. 2020;117:31189-97
69. Liang D, Minikes AM, Jiang X. Ferroptosis at the intersection of lipid metabolism and cellular signaling. Mol Cell. 2022;82:2215-27
70. Stockwell BR. Ferroptosis turns 10: Emerging mechanisms, physiological functions, and therapeutic applications. Cell. 2022;185:2401-21
71. Su F, Koeberle A. Regulation and targeting of SREBP-1 in hepatocellular carcinoma. Cancer Metastasis Rev. 2024;43:673-708
72. Bell HN, Stockwell BR, Zou W. Ironing out the role of ferroptosis in immunity. Immunity. 2024;57:941-56
73. Chen X, Kang R, Kroemer G, Tang D. Ferroptosis in infection, inflammation, and immunity. J Exp Med. 2021 218
74. Kim R, Hashimoto A, Markosyan N, Tyurin VA, Tyurina YY, Kar G. et al. Ferroptosis of tumour neutrophils causes immune suppression in cancer. Nature. 2022;612:338-46
75. Smith WL, Urade Y, Jakobsson PJ. Enzymes of the cyclooxygenase pathways of prostanoid biosynthesis. Chem Rev. 2011;111:5821-65
76. Dixon SJ, Pratt DA. Ferroptosis: A flexible constellation of related biochemical mechanisms. Mol Cell. 2023;83:1030-42
77. Koeberle SC, Gollowitzer A, Laoukili J, Kranenburg O, Werz O, Koeberle A. et al. Distinct and overlapping functions of glutathione peroxidases 1 and 2 in limiting NF-kappaB-driven inflammation through redox-active mechanisms. Redox Biol. 2020;28:101388
78. Proneth B, Conrad M. Ferroptosis and necroinflammation, a yet poorly explored link. Cell Death Differ. 2019;26:14-24
79. Werz O, Steinhilber D. Selenium-dependent peroxidases suppress 5-lipoxygenase activity in B-lymphocytes and immature myeloid cells. The presence of peroxidase-insensitive 5-lipoxygenase activity in differentiated myeloid cells. Eur J Biochem. 1996;242:90-7
80. Friedman SL, Neuschwander-Tetri BA, Rinella M, Sanyal AJ. Mechanisms of NAFLD development and therapeutic strategies. Nat Med. 2018;24:908-22
81. Li C, Lee D, Graf TN, Phifer SS, Nakanishi Y, Burgess JP. et al. A hexacyclic ent-trachylobane diterpenoid possessing an oxetane ring from Mitrephora glabra. Org Lett. 2005;7:5709-12
82. Wein LA, Wurst K, Angyal P, Weisheit L, Magauer T. Synthesis of (-)-Mitrephorone A via a Bioinspired Late Stage C-H Oxidation of (-)-Mitrephorone B. J Am Chem Soc. 2019;141:19589-93
83. Waltl L, Speck K, Wildermuth R, Haut F, Permann P, D'Avino D. et al. Reorganization of innate immune cell lipid profiles by bioinspired meroterpenoids to limit inflammation. bioRxiv. 2024: doi: https://doi.org/10.1101/2024.05.24.595516.
84. Schoenthaler M, Waltl L, Hasenoehrl T, Seher D, Lutz A, Aulinger L. et al. Novel thiazolopyridine derivatives of diflapolin as dual sEH/FLAP inhibitors with improved solubility. Bioorg Chem. 2023;139:106685
85. Salamone S, Waltl L, Pompignan A, Grassi G, Chianese G, Koeberle A. et al. Phytochemical Characterization of Cannabis sativa L. Chemotype V Reveals Three New Dihydrophenanthrenoids That Favorably Reprogram Lipid Mediator Biosynthesis in Macrophages. Plants (Basel). 2022;11:2130
86. Neukirch K, Alsabil K, Dinh CP, Bilancia R, Raasch M, Ville A. et al. Exploration of Long-Chain Vitamin E Metabolites for the Discovery of a Highly Potent, Orally Effective, and Metabolically Stable 5-LOX Inhibitor that Limits Inflammation. J Med Chem. 2021;64:11496-526
87. Thurmer M, Gollowitzer A, Pein H, Neukirch K, Gelmez E, Waltl L. et al. PI(18:1/18:1) is a SCD1-derived lipokine that limits stress signaling. Nat Commun. 2022;13:2982
88. Koeberle A, Munoz E, Appendino GB, Minassi A, Pace S, Rossi A. et al. SAR studies on curcumin's pro-inflammatory targets: discovery of prenylated pyrazolocurcuminoids as potent and selective novel inhibitors of 5-lipoxygenase. J Med Chem. 2014;57:5638-48
89. Rao Z, Caprioglio D, Gollowitzer A, Kretzer C, Imperio D, Collado JA. et al. Rotational constriction of curcuminoids impacts 5-lipoxygenase and mPGES-1 inhibition and evokes a lipid mediator class switch in macrophages. Biochem Pharmacol. 2022;203:115202
90. Su F, Descher H, Bui-Hoang M, Stuppner H, Skvortsova I, Rad EB. et al. Iron(III)-salophene catalyzes redox cycles that induce phospholipid peroxidation and deplete cancer cells of ferroptosis-protecting cofactors. Redox Biol. 2024;75:103257
91. Mishima E, Ito J, Wu Z, Nakamura T, Wahida A, Doll S. et al. A non-canonical vitamin K cycle is a potent ferroptosis suppressor. Nature. 2022;608:778-83
92. Shah R, Farmer LA, Zilka O, Van Kessel ATM, Pratt DA. Beyond DPPH: Use of Fluorescence-Enabled Inhibited Autoxidation to Predict Oxidative Cell Death Rescue. Cell Chem Biol. 2019;26:1594-607 e7
93. Kampschulte N, Kirchhoff R, Lowen A, Schebb NH. Deducing formation routes of oxylipins by quantitative multiple heart-cutting achiral-chiral 2D-LC-MS. J Lipid Res. 2024;65:100694
94. Koeberle A, Shindou H, Harayama T, Shimizu T. Role of lysophosphatidic acid acyltransferase 3 for the supply of highly polyunsaturated fatty acids in TM4 Sertoli cells. FASEB J. 2010;24:4929-38
95. Pfänder P, Hensen L, Navas PR, Solvay M, Prentzell MT, Sadik A. et al. Tryptophan stress activates EGFR-RAS-signaling to MTORC1 and p38/MAPK to sustain translation and AHR-dependent autophagy. bioRxiv. 2023: doi: https://doi.org/10.1101/2023.01.16.523931.
96. Koeberle A, Shindou H, Koeberle SC, Laufer SA, Shimizu T, Werz O. Arachidonoyl-phosphatidylcholine oscillates during the cell cycle and counteracts proliferation by suppressing Akt membrane binding. Proc Natl Acad Sci U S A. 2013;110:2546-51
97. Koeberle A, Pergola C, Shindou H, Koeberle SC, Shimizu T, Laufer SA. et al. Role of p38 mitogen-activated protein kinase in linking stearoyl-CoA desaturase-1 activity with endoplasmic reticulum homeostasis. FASEB J. 2015;29:2439-49
98. Filipek A, Mikolajczyk TP, Guzik TJ, Naruszewicz M. Oleacein and Foam Cell Formation in Human Monocyte-Derived Macrophages: A Potential Strategy Against Early and Advanced Atherosclerotic Lesions. Pharmaceuticals (Basel). 2020;13:64
99. Shin HY, Lee JY, Kim EJ, Kim SW. Rapid quantification of lipids in Acremonium chrysogenum using Oil red O. Curr Microbiol. 2011;62:1023-7
100. Shannon P, Markiel A, Ozier O, Baliga NS, Wang JT, Ramage D. et al. Cytoscape: a software environment for integrated models of biomolecular interaction networks. Genome Res. 2003;13:2498-504
101. Koberlin MS, Snijder B, Heinz LX, Baumann CL, Fauster A, Vladimer GI. et al. A Conserved Circular Network of Coregulated Lipids Modulates Innate Immune Responses. Cell. 2015;162:170-83
102. Basu S, Duren W, Evans CR, Burant CF, Michailidis G, Karnovsky A. Sparse network modeling and metscape-based visualization methods for the analysis of large-scale metabolomics data. Bioinformatics. 2017;33:1545-53
103. Bachour-El Azzi P, Chesne C, Uehara S. Expression and functional activity of cytochrome P450 enzymes in human hepatocytes with sustainable reproducibility for in vitro phenotyping studies. Adv Pharmacol. 2022;95:285-305
104. Mayati A, Moreau A, Le Vee M, Bruyere A, Jouan E, Denizot C. et al. Functional polarization of human hepatoma HepaRG cells in response to forskolin. Sci Rep. 2018;8:16115
105. Lubberstedt M, Muller-Vieira U, Mayer M, Biemel KM, Knospel F, Knobeloch D. et al. HepaRG human hepatic cell line utility as a surrogate for primary human hepatocytes in drug metabolism assessment in vitro. J Pharmacol Toxicol Methods. 2011;63:59-68
106. Slevin E, Baiocchi L, Wu N, Ekser B, Sato K, Lin E. et al. Kupffer Cells: Inflammation Pathways and Cell-Cell Interactions in Alcohol-Associated Liver Disease. Am J Pathol. 2020;190:2185-93
107. Dixon LJ, Barnes M, Tang H, Pritchard MT, Nagy LE. Kupffer cells in the liver. Compr Physiol. 2013;3:785-97
108. Werz O, Gerstmeier J, Libreros S, De la Rosa X, Werner M, Norris PC. et al. Human macrophages differentially produce specific resolvin or leukotriene signals that depend on bacterial pathogenicity. Nat Commun. 2018;9:59
109. Murray PJ, Wynn TA. Protective and pathogenic functions of macrophage subsets. Nat Rev Immunol. 2011;11:723-37
110. Vong L, Ferraz JG, Panaccione R, Beck PL, Wallace JL. A pro-resolution mediator, prostaglandin D(2), is specifically up-regulated in individuals in long-term remission from ulcerative colitis. Proc Natl Acad Sci U S A. 2010;107:12023-7
111. Schmid T, Brune B. Prostanoids and Resolution of Inflammation - Beyond the Lipid-Mediator Class Switch. Front Immunol. 2021;12:714042
112. Koeberle A, Werz O. Perspective of microsomal prostaglandin E2 synthase-1 as drug target in inflammation-related disorders. Biochem Pharmacol. 2015;98:1-15
113. Schebb NH, Kuhn H, Kahnt AS, Rund KM, O'Donnell VB, Flamand N. et al. Formation, Signaling and Occurrence of Specialized Pro-Resolving Lipid Mediators-What is the Evidence so far? Front Pharmacol. 2022;13:838782
114. Vidar Hansen T, Serhan CN. Protectins: Their biosynthesis, metabolism and structure-functions. Biochem Pharmacol. 2022;206:115330
115. Basil MC, Levy BD. Specialized pro-resolving mediators: endogenous regulators of infection and inflammation. Nat Rev Immunol. 2016;16:51-67
116. Dyall SC, Balas L, Bazan NG, Brenna JT, Chiang N, da Costa Souza F. et al. Polyunsaturated fatty acids and fatty acid-derived lipid mediators: Recent advances in the understanding of their biosynthesis, structures, and functions. Prog Lipid Res. 2022;86:101165
117. Newton K, Strasser A, Kayagaki N, Dixit VM. Cell death. Cell. 2024;187:235-56
118. Coll RC, Schroder K, Pelegrin P. NLRP3 and pyroptosis blockers for treating inflammatory diseases. Trends Pharmacol Sci. 2022;43:653-68
119. Yan S, Yu L, Chen Z, Xie D, Huang Z, Ouyang S. ZBP1 promotes hepatocyte pyroptosis in acute liver injury by regulating the PGAM5/ROS pathway. Ann Hepatol. 2024;29:101475
120. Haeggstrom JZ, Funk CD. Lipoxygenase and leukotriene pathways: biochemistry, biology, and roles in disease. Chem Rev. 2011;111:5866-98
121. Patrono C, Rocca B. Measurement of Thromboxane Biosynthesis in Health and Disease. Front Pharmacol. 2019;10:1244
122. Pfister SL, Hughes MJ, Rosolowsky M, Campbell WB. Role of contaminating platelets in thromboxane synthesis in primary cultures of human umbilical vein endothelial cells. Prostaglandins Other Lipid Mediat. 2002;70:39-49
123. Ooi GJ, Meikle PJ, Huynh K, Earnest A, Roberts SK, Kemp W. et al. Hepatic lipidomic remodeling in severe obesity manifests with steatosis and does not evolve with non-alcoholic steatohepatitis. J Hepatol. 2021;75:524-35
124. Kartsoli S, Kostara CE, Tsimihodimos V, Bairaktari ET, Christodoulou DK. Lipidomics in non-alcoholic fatty liver disease. World J Hepatol. 2020;12:436-50
125. Beland-Bonenfant S, Rouland A, Petit JM, Verges B. Concise review of lipidomics in nonalcoholic fatty liver disease. Diabetes Metab. 2023;49:101432
126. Jarc E, Petan T. A twist of FATe: Lipid droplets and inflammatory lipid mediators. Biochimie. 2020;169:69-87
127. Willis SA, Bawden SJ, Malaikah S, Sargeant JA, Stensel DJ, Aithal GP. et al. The role of hepatic lipid composition in obesity-related metabolic disease. Liver Int. 2021;41:2819-35
128. Scorletti E, Carr RM. A new perspective on NAFLD: Focusing on lipid droplets. J Hepatol. 2022;76:934-45
129. Gorden DL, Myers DS, Ivanova PT, Fahy E, Maurya MR, Gupta S. et al. Biomarkers of NAFLD progression: a lipidomics approach to an epidemic. J Lipid Res. 2015;56:722-36
130. Norris PC, Skulas-Ray AC, Riley I, Richter CK, Kris-Etherton PM, Jensen GL. et al. Identification of specialized pro-resolving mediator clusters from healthy adults after intravenous low-dose endotoxin and omega-3 supplementation: a methodological validation. Sci Rep. 2018;8:18050
131. Sobrino A, Walker ME, Colas RA, Dalli J. Protective activities of distinct omega-3 enriched oils are linked to their ability to upregulate specialized pro-resolving mediators. PLoS One. 2020;15:e0242543
132. Zadoorian A, Du X, Yang H. Lipid droplet biogenesis and functions in health and disease. Nat Rev Endocrinol. 2023;19:443-59
133. Olzmann JA, Carvalho P. Dynamics and functions of lipid droplets. Nat Rev Mol Cell Biol. 2019;20:137-55
134. Liu D, Wong CC, Fu L, Chen H, Zhao L, Li C. et al. Squalene epoxidase drives NAFLD-induced hepatocellular carcinoma and is a pharmaceutical target. Sci Transl Med. 2018;10:eaap9840
135. Vvedenskaya O, Rose TD, Knittelfelder O, Palladini A, Wodke JAH, Schuhmann K. et al. Nonalcoholic fatty liver disease stratification by liver lipidomics. J Lipid Res. 2021;62:100104
136. Ioannou GN. The Role of Cholesterol in the Pathogenesis of NASH. Trends Endocrinol Metab. 2016;27:84-95
137. Libby P, Buring JE, Badimon L, Hansson GK, Deanfield J, Bittencourt MS. et al. Atherosclerosis. Nat Rev Dis Primers. 2019;5:56
138. Brunt EM, Wong VW, Nobili V, Day CP, Sookoian S, Maher JJ. et al. Nonalcoholic fatty liver disease. Nat Rev Dis Primers. 2015;1:15080
139. Thelwall PE, Smith FE, Leavitt MC, Canty D, Hu W, Hollingsworth KG. et al. Hepatic cholesteryl ester accumulation in lysosomal acid lipase deficiency: non-invasive identification and treatment monitoring by magnetic resonance. J Hepatol. 2013;59:543-9
140. Bril F, Barb D, Portillo-Sanchez P, Biernacki D, Lomonaco R, Suman A. et al. Metabolic and histological implications of intrahepatic triglyceride content in nonalcoholic fatty liver disease. Hepatology. 2017;65:1132-44
141. Lange M, Wagner PV, Fedorova M. Lipid composition dictates the rate of lipid peroxidation in artificial lipid droplets. Free Radic Res. 2021;55:469-80
142. Papsdorf K, Miklas JW, Hosseini A, Cabruja M, Morrow CS, Savini M. et al. Lipid droplets and peroxisomes are co-regulated to drive lifespan extension in response to mono-unsaturated fatty acids. Nat Cell Biol. 2023;25:672-84
143. von Krusenstiern AN, Robson RN, Qian N, Qiu B, Hu F, Reznik E. et al. Identification of essential sites of lipid peroxidation in ferroptosis. Nat Chem Biol. 2023;19:719-30
144. Lange M, Wolk M, Li VW, Doubravsky CE, Hendricks JM, Kato S. et al. FSP1-mediated lipid droplet quality control prevents neutral lipid peroxidation and ferroptosis. Nat Cell Biol. 2025;27:1902-13
145. Lange M, Olzmann JA. Ending on a sour note: Lipids orchestrate ferroptosis in cancer. Cell Metab. 2021;33:1507-9
146. Danielli M, Perne L, Jarc Jovicic E, Petan T. Lipid droplets and polyunsaturated fatty acid trafficking: Balancing life and death. Front Cell Dev Biol. 2023;11:1104725
147. Valentine WJ, Shimizu T, Shindou H. Lysophospholipid acyltransferases orchestrate the compositional diversity of phospholipids. Biochimie. 2023;215:24-33
148. Oh M, Jang SY, Lee JY, Kim JW, Jung Y, Kim J. et al. The lipoprotein-associated phospholipase A2 inhibitor Darapladib sensitises cancer cells to ferroptosis by remodelling lipid metabolism. Nat Commun. 2023;14:5728
149. Chen D, Chu B, Yang X, Liu Z, Jin Y, Kon N. et al. iPLA2beta-mediated lipid detoxification controls p53-driven ferroptosis independent of GPX4. Nat Commun. 2021;12:3644
150. Wolf D, Ley K. Immunity and Inflammation in Atherosclerosis. Circ Res. 2019;124:315-27
151. Ipsen DH, Lykkesfeldt J, Tveden-Nyborg P. Molecular mechanisms of hepatic lipid accumulation in non-alcoholic fatty liver disease. Cell Mol Life Sci. 2018;75:3313-27
152. Ogawa Y, Imajo K, Honda Y, Kessoku T, Tomeno W, Kato S. et al. Palmitate-induced lipotoxicity is crucial for the pathogenesis of nonalcoholic fatty liver disease in cooperation with gut-derived endotoxin. Sci Rep. 2018;8:11365
153. Koeberle A, Loser K, Thurmer M. Stearoyl-CoA desaturase-1 and adaptive stress signaling. Biochim Biophys Acta. 2016;1861:1719-26
154. Liu K, Wang FS, Xu R. Neutrophils in liver diseases: pathogenesis and therapeutic targets. Cell Mol Immunol. 2021;18:38-44
155. Herman MA. Metabolic liver disease - what's in a name? Nat Rev Endocrinol. 2021;17:79-80
156. Tilg H, Adolph TE, Dudek M, Knolle P. Non-alcoholic fatty liver disease: the interplay between metabolism, microbes and immunity. Nat Metab. 2021;3:1596-607
157. Brissot P, Pietrangelo A, Adams PC, de Graaff B, McLaren CE, Loreal O. Haemochromatosis. Nat Rev Dis Primers. 2018;4:18016
158. Czlonkowska A, Litwin T, Dusek P, Ferenci P, Lutsenko S, Medici V. et al. Wilson disease. Nat Rev Dis Primers. 2018;4:21
159. Robinson MW, Harmon C, O'Farrelly C. Liver immunology and its role in inflammation and homeostasis. Cell Mol Immunol. 2016;13:267-76
160. Peiseler M, Schwabe R, Hampe J, Kubes P, Heikenwalder M, Tacke F. Immune mechanisms linking metabolic injury to inflammation and fibrosis in fatty liver disease - novel insights into cellular communication circuits. J Hepatol. 2022;77:1136-60
161. Sun B, Karin M. Obesity, inflammation, and liver cancer. J Hepatol. 2012;56:704-13
162. Wang K. Molecular mechanisms of hepatic apoptosis. Cell Death Dis. 2014;5:e996
163. Beharier O, Tyurin VA, Goff JP, Guerrero-Santoro J, Kajiwara K, Chu T. et al. PLA2G6 guards placental trophoblasts against ferroptotic injury. Proc Natl Acad Sci U S A. 2020;117:27319-28
164. Sun WY, Tyurin VA, Mikulska-Ruminska K, Shrivastava IH, Anthonymuthu TS, Zhai YJ. et al. Phospholipase iPLA(2)beta averts ferroptosis by eliminating a redox lipid death signal. Nat Chem Biol. 2021;17:465-76
165. Bailey AP, Koster G, Guillermier C, Hirst EM, MacRae JI, Lechene CP. et al. Antioxidant Role for Lipid Droplets in a Stem Cell Niche of Drosophila. Cell. 2015;163:340-53
166. Klett EL, Chen S, Yechoor A, Lih FB, Coleman RA. Long-chain acyl-CoA synthetase isoforms differ in preferences for eicosanoid species and long-chain fatty acids. J Lipid Res. 2017;58:884-94
167. Padanad MS, Konstantinidou G, Venkateswaran N, Melegari M, Rindhe S, Mitsche M. et al. Fatty Acid Oxidation Mediated by Acyl-CoA Synthetase Long Chain 3 Is Required for Mutant KRAS Lung Tumorigenesis. Cell Rep. 2016;16:1614-28
168. Bai Y, Meng L, Han L, Jia Y, Zhao Y, Gao H. et al. Lipid storage and lipophagy regulates ferroptosis. Biochem Biophys Res Commun. 2019;508:997-1003
169. Klasson TD, LaGory EL, Zhao H, Huynh SK, Papandreou I, Moon EJ. et al. ACSL3 regulates lipid droplet biogenesis and ferroptosis sensitivity in clear cell renal cell carcinoma. Cancer Metab. 2022;10:14
170. Lee H, Horbath A, Kondiparthi L, Meena JK, Lei G, Dasgupta S. et al. Cell cycle arrest induces lipid droplet formation and confers ferroptosis resistance. Nat Commun. 2024;15:79
171. Cao Y, Li J, Chen Y, Wang Y, Liu Z, Huang L. et al. Monounsaturated fatty acids promote cancer radioresistance by inhibiting ferroptosis through ACSL3. Cell Death Dis. 2025;16:184
172. Ferrada L, Barahona MJ, Vera M, Stockwell BR, Nualart F. Dehydroascorbic acid sensitizes cancer cells to system x(c)(-) inhibition-induced ferroptosis by promoting lipid droplet peroxidation. Cell Death Dis. 2023;14:637
173. Chen X, Yu C, Kang R, Kroemer G, Tang D. Cellular degradation systems in ferroptosis. Cell Death Differ. 2021;28:1135-48
174. Liu J, Liu Y, Wang Y, Li C, Xie Y, Klionsky DJ. et al. TMEM164 is a new determinant of autophagy-dependent ferroptosis. Autophagy. 2023;19:945-56
175. Xu L, Zhang W, Sanchez Tejeda JF, Holovan D, McCain J, Lovell TC. et al. Live-cell imaging with fluorogenic radical-trapping antioxidant probes reveals the onset and progression of ferroptosis. Nat Chem. 2025;17:1963-73
176. Caneque T, Baron L, Muller S, Carmona A, Colombeau L, Versini A. et al. Activation of lysosomal iron triggers ferroptosis in cancer. Nature. 2025;642:492-500
177. Luo W, Xu Q, Wang Q, Wu H, Hua J. Effect of modulation of PPAR-gamma activity on Kupffer cells M1/M2 polarization in the development of non-alcoholic fatty liver disease. Sci Rep. 2017;7:44612
178. Wang C, Ma C, Gong L, Guo Y, Fu K, Zhang Y. et al. Macrophage Polarization and Its Role in Liver Disease. Front Immunol. 2021;12:803037
179. Li D, Wu M. Pattern recognition receptors in health and diseases. Signal Transduct Target Ther. 2021;6:291
180. Chang PY, Chang SF, Chang TY, Su HM, Lu SC. Synergistic effects of electronegative-LDL- and palmitic-acid-triggered IL-1beta production in macrophages via LOX-1- and voltage-gated-potassium-channel-dependent pathways. J Nutr Biochem. 2021;97:108767
181. Shirasuna K, Takano H, Seno K, Ohtsu A, Karasawa T, Takahashi M. et al. Palmitic acid induces interleukin-1beta secretion via NLRP3 inflammasomes and inflammatory responses through ROS production in human placental cells. J Reprod Immunol. 2016;116:104-12
182. Shi H, Kokoeva MV, Inouye K, Tzameli I, Yin H, Flier JS. TLR4 links innate immunity and fatty acid-induced insulin resistance. J Clin Invest. 2006;116:3015-25
183. Wong SW, Kwon MJ, Choi AM, Kim HP, Nakahira K, Hwang DH. Fatty acids modulate Toll-like receptor 4 activation through regulation of receptor dimerization and recruitment into lipid rafts in a reactive oxygen species-dependent manner. J Biol Chem. 2009;284:27384-92
184. Wang Z, Liu D, Wang F, Liu S, Zhao S, Ling EA. et al. Saturated fatty acids activate microglia via Toll-like receptor 4/NF-kappaB signalling. Br J Nutr. 2012;107:229-41
185. Cullberg KB, Larsen JO, Pedersen SB, Richelsen B. Effects of LPS and dietary free fatty acids on MCP-1 in 3T3-L1 adipocytes and macrophages in vitro. Nutr Diabetes. 2014;4:e113
186. Yao C, Narumiya S. Prostaglandin-cytokine crosstalk in chronic inflammation. Br J Pharmacol. 2019;176:337-54
187. Brandt SL, Serezani CH. Too much of a good thing: How modulating LTB(4) actions restore host defense in homeostasis or disease. Semin Immunol. 2017;33:37-43
188. Alves-Bezerra M, Cohen DE. Triglyceride Metabolism in the Liver. Compr Physiol. 2017;8:1-8
189. Ma DW, Arendt BM, Hillyer LM, Fung SK, McGilvray I, Guindi M. et al. Plasma phospholipids and fatty acid composition differ between liver biopsy-proven nonalcoholic fatty liver disease and healthy subjects. Nutr Diabetes. 2016;6:e220
190. Lipinski CA. Lead- and drug-like compounds: the rule-of-five revolution. Drug Discov Today Technol. 2004;1:337-41
191. Sud M, Fahy E, Cotter D, Azam K, Vadivelu I, Burant C. et al. Metabolomics Workbench: An international repository for metabolomics data and metadata, metabolite standards, protocols, tutorials and training, and analysis tools. Nucleic Acids Res. 2016;44:D463-70
Author contact
![]() Corresponding author: Andreas Koeberle; Tel.: +43 316 380 - 8630, E-mail: andreas.koeberleat.
Corresponding author: Andreas Koeberle; Tel.: +43 316 380 - 8630, E-mail: andreas.koeberleat.