Impact Factor
- Issue 14; 2026
- Issue 13; 2026
- Issue 12; 2026
- Issue 11; 2026
- Issue 10; 2026
- Volume 16; 2026
- Advance Articles
- Past Issues
- Cover Images
- Cover Suggestion
- Index & Coverage
- Special Issues
Introduction
Materials and Methods
Results
Discussion
Conclusions
Abbreviations
Supplementary Material
Acknowledgements
References
International Journal of Biological Sciences
International Journal of Medical Sciences
 Global reach, higher impact

Theranostics 2026; 16(10):5501-5517. doi:10.7150/thno.126134 This issue Cite
Research Paper
Cholesterol sulfate replenishment rejuvenates aged hematopoietic stem cell phenomes
Yunyu Feng1*, Ning Li1*, Nan Wang1, Wei He1,2, Hongjian Li3, Xue Cui1, Bochuan Wang1, Runkuan Qin1, Huandi Qiu1,2, Qiang Qiu4, Li Zheng1,5, Yuanyuan Sun1,2, Linye He6,7, Cong Pan8,9, Anping Su6,7, Zhihui Li6,7, Yiguo Hu1,7 ![]()
1. State Key Laboratory of Biotherapy, West China Hospital, Sichuan University, Chengdu, China.
2. Department of Clinical Translational Innovation Center and Molecular Medicine Research Center, West China Hospital, Sichuan University, Chengdu, China.
3. Institute for Immunology and School of Medicine, Tsinghua University, Beijing, China.
4. Department of Hematology and Research Laboratory of Hematology, West China Hospital, Sichuan University, Chengdu, China.
5. Institute of Cardiovascular Surgery, West China Hospital, Sichuan University, Chengdu, China.
6. Laboratory of thyroid and parathyroid disease, Frontiers Science Center for Disease-related Molecular Network, West China Hospital, Sichuan University, Chengdu, China.
7. Department of Thyroid Surgery, West China Hospital, Sichuan University, Chengdu, China.
8. School of Biological Sciences, Guizhou Education University, Guiyang, China.
9. Translational Medicine Research Center, eBond Pharmaceutical Technology Co., Ltd., Chengdu, China.
* Yunyu Feng and Ning Li contributed equally to this work.
Received 2025-9-30; Accepted 2026-2-3; Published 2026-3-17
Abstract

The aging of hematopoietic stem cells (HSCs) impairs their regenerative and self-renewal capacities, contributing to immune dysfunction and hematologic diseases, yet safe and effective rejuvenation strategies remain elusive.
Methods: This study employed a human data-driven, metabolism-centered approach to identify endogenous compounds with rejuvenating potential for aged HSCs. Genome-scale metabolic models and single-cell transcriptomic analyses were used to characterize metabolic changes in human and mouse HSCs. Aged mice were treated with cholesterol sulfate (CS), and HSC functionality was assessed via proliferation assays, DNA damage analysis, and bone marrow transplantation. Molecular docking and in vivo experiments further explored the role of the nuclear receptor RORA.
Results: Supplementation with CS in aged mice enhanced HSC proliferation, reduced DNA damage, and restored hematopoietic output. Metabolic modeling revealed increased CS hydrolysis as a key alteration in aged HSCs, while single-cell transcriptomics showed that CS treatment suppressed inflammatory signaling and eliminated stress-responsive HSC subpopulations. Mechanistically, CS was identified as a potent ligand that activates RORA. Functional studies suggested that RORA functions as a key mediator in this process.
Conclusion: CS supplementation reverses aging-associated HSC decline by enhancing proliferation, reducing DNA damage, and modulating inflammatory pathways, with RORA serving as an essential mediator. These findings highlight the CS-RORA axis as a promising therapeutic target for rejuvenating aged HSCs and preserving hematopoietic function.
Keywords: Aging, hematopoietic stem cells (HSCs), Cholesterol sulfate (CS), rejuvenation, DNA damage
Introduction
Aging is the progressive, systemic deterioration of biological function and stress resilience, culminating in organ dysfunction and elevated mortality risk [1]. The hematopoietic system is particularly vulnerable to aging, as it relies on hematopoietic stem cells (HSCs) to sustain lifelong blood and immune cell production. Age-associated HSC dysfunction manifests as impaired immune competence, anemia, myeloid lineage bias, and an increased incidence of hematological malignancies, including chronic myeloid leukemia (CML) and myelodysplastic syndromes (MDS) [2, 3]. Hematopoietic aging is driven by multiple interconnected processes, including genomic instability, telomere attrition, and mitochondrial dysfunction, collectively leading to the functional exhaustion of HSCs [4, 5]. Clinically, this decline is exemplified by the reduced efficacy of bone marrow transplantation (BMT) from elderly donors, underscoring the urgent need to identify strategies that restore HSC function during aging [6-9].
While hematopoietic aging is evolutionarily conserved, most mechanistic insights have been derived from murine models [3, 10, 11]. Fundamental differences between mouse and human HSCs, particularly in telomere dynamics, transcriptional regulation, and stress responses, limit the direct translational relevance of these findings [12]. Recent advances in high-throughput sequencing and systems-level analyses have enabled comprehensive interrogation of human hematopoiesis at unprecedented resolution [2, 13, 14]. However, converting descriptive human aging signatures into actionable interventions that restore HSC function with clear mechanisms and acceptable safety remains a major challenge.
Metabolic regulation has emerged as a central determinant of stem cell aging and tissue regeneration [15]. Consistent with a causal role for metabolism in hematopoietic aging, a recent metabolic atlas identified uridine as a metabolite capable of rejuvenating aged HSCs in vivo [16]. However, many pharmacological interventions targeting aging rely on repurposed drugs with systemic toxicity or poorly defined mechanisms, such as rapamycin, metformin, and senolytics [17-20]. In contrast, endogenous metabolites may provide a more physiological and potentially better-tolerated modality for modulating aging-associated dysfunction. While several endogenous compounds, such as NAD⁺ precursors and α-ketoglutarate, have shown promise in delaying age-related decline [21-23], a systematic, human-data-guided framework to identify metabolites that rejuvenate aged human HSCs is still lacking.
To address this gap, we established a human data-driven, metabolism-centered strategy to systematically identify endogenous compounds with rejuvenating potential in aged HSCs. Through this pipeline, we identified Cholesterol Sulfate (CS), a sulfated sterol metabolite, as a key molecule specifically depleted in aged HSCs. While previously known for its roles in skin barrier function and membrane stability, our findings reveal a surprising and pivotal function of CS in maintaining HSC homeostasis. Supplementation with CS reversed aging-associated phenotypes, enhancing proliferation, reducing DNA damage, and eliminating stress-responsive cell populations. Mechanistically, we uncovered activation of the nuclear receptor RORA as a key downstream effector of CS signaling, linking sterol metabolism to the transcriptional control of HSC homeostasis. These findings establish the CS-RORA axis as a novel, targetable pathway for restoring hematopoietic health and define endogenous metabolic regulation as a promising therapeutic avenue for rejuvenation.
Materials and Methods
Ethics statement and experimental animals
Human sample collection and analysis were approved by the Ethics Committee on Biomedical Research, West China Hospital of Sichuan University (Approval No. 1020). Written informed consent was obtained from all donors. All animal procedures adhered strictly to the guidelines established by the Animal Care and Use Committee of the State Key Laboratory of Biotherapy, Sichuan University (Approval No. 2021967A). The C57BL/6J (CD45.2) strain was sourced from the Jackson Laboratory (Bar Harbor, ME). Animal husbandry was conducted within the specialized facility of the State Key Laboratory of Biotherapy under standard conditions. To minimize experimental variability, study groups comprised age- and sex-matched littermates, with young cohorts aged 8-12 weeks and aged cohorts at 12-24 months.
Generation of conditional knockout models
To assess the functional necessity of RORA, a hematopoietic-specific knockout line was established by crossing Rorafl/fl mice (generated on a C57BL/6J background by Biocytogen, Beijing) with Mx1-Cre transgenic mice (Jackson Laboratory). Genetic deletion was induced in 8-week-old Rorafl/fl Mx1-Cre progeny via intraperitoneal (IP) administration of polyinosinic:polycytidylic acid (pIpC) at 15 mg/kg. The induction regimen comprised five doses administered every other day. Littermate Rorafl/fl controls received an identical pIpC regimen. HSCs were isolated for phenotypic analysis at 4- and 12-weeks post-induction.
Pharmacological interventions and irradiation models
For rejuvenation studies, aged mice (1-2 years old) received twice-daily IP injections of either CS (25 mg/kg, n = 3) or vehicle (DMSO, n = 3) for 14 days. To delineate the differential impact of CS versus supraphysiological mTOR activation, a mechanistic comparison was performed. C57BL/6 mice (n = 4-5 per group) were randomized into three cohorts and subjected to a short-term (3-day) regimen: CS treatment (25 mg/kg); treatment with the mTOR agonist MHY1485 (5 mg/kg); and vehicle control. Following the 3-day window, LSK (Linlow-Sca1+-c-Kit+) cells were purified by FACS to evaluate mTOR pathway activation markers via immunofluorescence.
To evaluate DNA repair dynamics, a sublethal irradiation model was employed. Young mice were pre-conditioned with three doses of PBS or CS (25 mg/kg, IP, 12 h intervals) prior to exposure to 2 Gy γ irradiation. Bone marrow was harvested at 1, 2, or 6 h post-irradiation for subsequent γH2AX foci quantification and comet assays.
Flow cytometry and cell sorting
Hematopoietic populations were analyzed and isolated with BD FACSAria III or BD Fortessa X instruments. Data were processed with FlowJo software (v10). Bone marrow cells were flushed from femurs and tibias, followed by red blood cell lysis. For HSC enrichment, lineage-positive cells were depleted. This was achieved using the Lineage Cell Depletion Kit (Miltenyi Biotec) with anti-PE microbeads designed to target a cocktail of lineage markers (Mac-1, Gr-1, Ter-119, B220, Il-7Rα, CD3, CD4, CD8). The resulting lineage-negative fraction was stained with fluorophore-conjugated antibodies to define specific progenitor subsets. Detailed antibody panels and surface marker definitions are provided in Table S1 [24-26]. Propidium iodide was utilized to exclude non-viable cells during sorting.
Single-cell gel electrophoresis
DNA strand breaks were quantified with the Trevigen Comet Assay kit. Briefly, sorted HSCs were suspended in low-melting-point agarose and layered onto CometSlides to ensure uniform processing. Cells were lysed overnight at 4 °C, followed by alkaline unwinding to reveal single-strand breaks. Electrophoresis was conducted under alkaline conditions. DNA tails were visualized by SYBR Green staining. Comet metrics, including Tail DNA% and Olive Tail Moment, were calculated to assess genomic integrity.
Cell culture
HEK293T cells were maintained in DMEM supplemented with 10% fetal bovine serum (FBS) and 1% penicillin/streptomycin in a humidified 37 °C incubator.
Immunofluorescence microscopy
Purified HSCs were subjected to a 30-min fixation using BD Cytofix Buffer at ambient temperature. Following fixation, cells were adhered to fibronectin-precoated glass slides. After PBS washing, cells were permeabilized with 0.2% Triton X-100 and blocked with 10% Donkey Serum (Sigma-Aldrich) to minimize non-specific binding. Primary antibodies targeting key proteins (detailed in Table S2) were incubated for 1 h, followed by fluorophore-conjugated secondary antibodies. Nuclei were counterstained with DAPI included in the ProLong Gold Antifade Mountant (Thermo Fisher). Confocal microscopy was executed utilizing Zeiss LSM710 and AxioObserver Z1 systems. High-resolution captures were obtained with 633 nm objectives. Image analysis was conducted using AxioVision 4.6 software. Image deconvolution and 3D reconstruction were accomplished with Volocity software (v6.0, Perkin Elmer), and quantitative analysis of Mean Fluorescence Intensity (MFI) was executed using ZEN software.
Transcriptomic data mining and metabolic modeling
A comprehensive HSC transcriptomic dataset was curated by querying the Gene Expression Omnibus (GEO) repository (https://www.ncbi.nlm.nih.gov/geo/), with strict donor stratification by age. Metabolic phenotypes were simulated through the construction of context-specific Genome-Scale Metabolic Models (GEMs) utilizing the ftINIT algorithm in MATLAB R2023a [27, 28]. For bulk RNA-seq data, transcript abundance was quantified and converted to Transcripts Per Million (TPM) to normalize for gene length and sequencing depth. Similarly, scRNA-seq data from HSCs were preprocessed and transformed into TPM values to ensure consistency across datasets. These TPM-converted transcriptomes were integrated into ftINIT, which leverages metabolic network constraints and expression profiles to generate cell-specific GEMs. Human- and mouse-GEM frameworks were downloaded to provide the reference metabolic reaction networks. Models were analyzed to infer metabolic differences linked to HSC states [28, 29]. The heatmaps were generated with the pheatmap R package (v1.0.12) [30].
Single-cell library preparation and sequencing
Following FACS sorting, single HSCs were partitioned into nanoliter-scale gel beads-in-emulsion with the 10x Genomics Chromium Controller. Libraries were constructed utilizing the Chromium Single Cell 3' Library and Gel Bead Kit v2, following the manufacturer's standard instructions, with a target recovery of approximately 10,000 cells per sample. cDNA synthesis and amplification (12 cycles) were performed on a Bio-Rad C1000 Touch thermal cycler. Library quality control, including fragment size distribution, was assessed on a Fragment Analyzer (Advanced Analytical) with the High Sensitivity NGS Analysis Kit. Final libraries were quantified via qPCR (Kapa Biosystems), normalized to 2 nM, and sequenced on an Illumina NovaSeq 6000 platform.
Bulk RNA-seq pipeline
Total RNA was extracted from sorted populations with Trizol (Thermo Fisher Scientific), followed by poly(A) mRNA enrichment from 1 μg of total RNA input (NEBNext Magnetic Isolation Module). Stranded RNA libraries were constructed utilizing the NEBNext Ultra Directional RNA Library Prep Kit, followed by sequencing on the Illumina HiSeq X Ten system (150 bp paired-end). To remove adapter sequences and filter out low-quality bases (Phred score < 20), Trim Galore (v0.2.7) was employed for raw read processing. The alignment of high-quality reads to the mm10 reference genome was performed by Hisat2 (v0.2.4) [31], and gene counts were generated via HTSeq (v0.9.0) [32].
Single-cell RNA-seq data analysis
Primary sequencing outputs were processed using Cell Ranger (v6.0.1) for demultiplexing and alignment against the mm10 reference genome. Downstream analysis, including quality filtering and cell clustering, was executed within the R environment (v4.1.0) utilizing the Seurat package (v4.0.5) [33]. To ensure high-quality data, rigorous cell-filtering criteria were applied. Only those cells containing more than 500 UMIs and 250 detected genes were considered. Furthermore, any cells with a mitochondrial read proportion exceeding 20% were excluded from the final analysis. Data were log-normalized, and batch effects were corrected through Canonical Correlation Analysis (CCA) on the top 2,000 variable features. Dimensionality reduction was achieved via Principal Component Analysis (PCA), with selection of PCs that contributed more than 5% standard deviation or accounted for 90% of the cumulative variance. Clusters were defined via graph-based clustering and visualized within Uniform Manifold Approximation and Projection (UMAP) space. Cell identity was assigned based on canonical lineage markers [26].
Trajectory inference and functional scoring
Differentiation dynamics were modeled with Monocle3 (v1.0.0) [34] to reconstruct HSC differentiation trajectories. Cells were ordered along a pseudotemporal trajectory, with LT-HSCs set as the root. Genes that varied in expression in correlation to pseudotime were found using the “graph_test” function in Monocle3. Genes were grouped by k-means clustering (k = 4) and visualized along pseudotime. To quantify pathway activation at the single-cell level, UCell scores (v1.1.0) were calculated for aging-related gene signatures curated from the MSigDB H, C2, and C5 collections [35].
Differential analysis and enrichment analysis
Platform-specific statistical frameworks were utilized to perform differential expression analysis. Seurat FindMarkers (Wilcoxon rank-sum test) for scRNA-seq was applied (log2FC > 0.263, P < 0.05). RNA-seq and microarray data were processed through the DESeq2 (v1.32.0) [36] and limma (v3.48.3) [37] packages, respectively, where a cutoff of |log2FC| > 1 and P < 0.05 was maintained. The Benjamini-Hochberg procedure was used to control the false discovery rate (FDR). Functional enrichment was assessed via Fisher's exact test for Gene Ontology (GO) terms [38] and fgsea (v1.18.0) for Gene Set Enrichment Analysis (GSEA).
Protein and ligand preparation and molecular docking
The three-dimensional structure of CS was downloaded from the PubChem database (CID: 636741). The crystal structure of the human RORα ligand-binding domain (LBD) was retrieved from the Protein Data Bank (PDB ID: 4S15), which contains a co-crystallized sterol-like ligand (4ACD8).
Protein and ligand structures were prepared in MGLTools (v1.5.7), including removal of water molecules, addition of polar hydrogens, calculation of Gasteiger charges, and definition of rotatable bonds. The docking site was defined as a 10 Å radius region centered on the co-crystallized ligand. Molecular docking was executed with AutoDock Vina (v1.1.2) under default parameters. Multiple independent docking runs were carried out, and the conformation with the lowest predicted binding free energy was selected for subsequent molecular dynamics simulations.
Molecular dynamics simulation and analysis
Molecular dynamics (MD) simulations were conducted in GROMACS (v2024.03) [39] to evaluate the stability and interaction dynamics of the RORA-ligand complexes. The Amber14SB force field [40] was applied to the protein, whereas ligand parameters and topologies were generated with ACPYPE based on the General Amber Force Field (GAFF). The complex was solvated in a dodecahedral box with TIP3P water molecules [41], and neutralized by adding Na⁺ and Cl⁻ ions to achieve a physiological concentration of 0.150 mol/L.
Energy minimization was performed with the steepest descent algorithm for 50,000 steps to remove steric clashes. The system was equilibrated sequentially under 100 ps under constant number, volume, and temperature (NVT) conditions, followed by 100 ps under constant number, pressure, and temperature (NPT), during which positional restraints were applied to protein heavy atoms. Temperature and pressure were maintained at 300 K and 1 bar via the V-rescale thermostat and Parrinello-Rahman barostat, respectively. Production simulations were run for 100 ns with a 2-fs integration timestep and without restraints. Long-range electrostatics were treated with the Particle Mesh Ewald (PME) method, and coordinates were recorded every 10 ps, yielding 10,000 frames for analysis.
Structural stability and flexibility were assessed via root-mean-square deviation (RMSD) and root-mean-square fluctuation (RMSF) calculations for the entire complex and the ligand. Global structural compactness was assessed via Radius of Gyration (Rg), while interaction stability was characterized by hydrogen bond occupancy. PCA of backbone atoms was employed to capture dominant collective motions. For free energy estimation, stable segments from the final phase of the simulation were subjected to MM-PBSA analysis with the gmx_MMPBSA tool [42], decomposing the total binding free energy into van der Waals, electrostatic, polar solvation, and nonpolar contributions.
Structural visualization and interaction analyses were performed in PyMOL.
Quantification and statistical analysis
Statistical analyses were performed using GraphPad Prism. Data distribution was first assessed via Shapiro-Wilk test (3 ≤ n ≤ 50), D'Agostino-Pearson test (50 < n < 1000), or Anderson-Darling test as appropriate. For normally distributed datasets, a two-tailed Student's t-test was used. Otherwise, the non-parametric Mann-Whitney U test was applied. All data are presented as mean ± SEM (or SD as indicated). Statistical significance was defined as P < 0.05 and denoted as follows: * (P < 0.05), ** (P < 0.01), *** (P < 0.001), **** (P < 0.0001) and ns (not significant). Exact n values representing independent biological replicates are provided in each figure legend.
Results
HSC aging alters steroid metabolism
Previous studies have reported substantial metabolic alterations in aged mouse hematopoietic stem and progenitor cells (HSPCs) [16]. To investigate metabolic changes associated with human HSC aging, gene expression profiles associated with human HSC senescence were interrogated, followed by over-representation analysis (ORA) with a focus on metabolic pathways from publicly available datasets [2]. Metabolic processes involving small molecules, nucleic acids, ketones, and carbohydrates were significantly enriched, consistent with prior findings [16, 43-47]. Notably, biological processes related to steroid metabolism were also significantly enriched (Figure 1A).
Steroid metabolism is altered during HSC senescence. (A) Dot plot showing Gene Ontology (GO) metabolic pathway enrichment of the differentially expressed genes (DEGs) during human HSC aging. (B) Workflow of GEMs constructed from RNA-seq (Young n = 10, Old n = 10) and scRNA-seq (Young n = 5, Old n = 3) data to prioritize metabolic changes in aging HSCs. (C) Comparison of relative subsystem coverage between young and aged human HSCs GEMs, showing only subsystems with top deviation between the two models, based on RNA-seq (left) and scRNA-seq data (right). (D) Top 10 metabolic reactions within the steroid metabolism pathway exhibiting the largest increase in reaction ratio in aged compared to young HSCs, based on GEM simulation results.
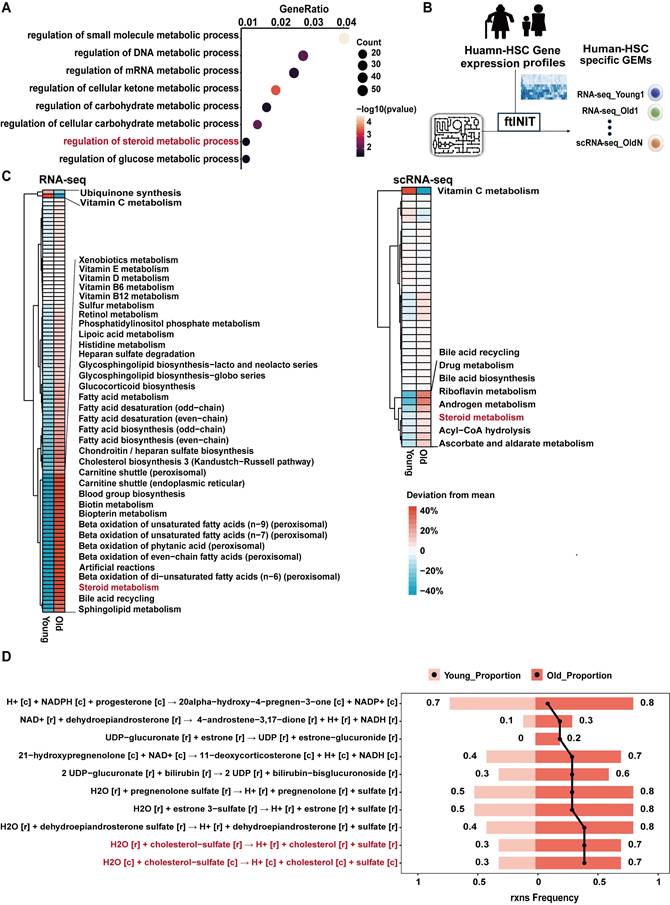
Given that changes in transcript abundance do not necessarily reflect metabolic flux, GEMs were constructed to prioritize metabolic alterations in silico. GEMs based on bulk RNA-seq and scRNA-seq data from human HSCs revealed marked metabolic differences associated with HSC aging (Figure 1B). Comparative analysis of subsystem coverage revealed significant divergence between young and aged HSCs, particularly in steroid metabolism, across both transcriptomic platforms (Figure 1C).
To further refine these observations, reaction-level flux analysis within the steroid metabolism network was conducted. Several reactions displayed increased predicted activity in aged HSCs, among which CS hydrolysis ranked as one of the most prominently altered nodes (Figure 1D). These data suggest that altered CS metabolism may represent a conserved metabolic feature of HSC aging.
CS treatment rejuvenated aged HSPC phenotypes
Based on the predicted increase in CS hydrolysis in aged HSCs, the functional consequences of CS supplementation were evaluated in vivo. Aged mice were treated with CS to explore this possibility.
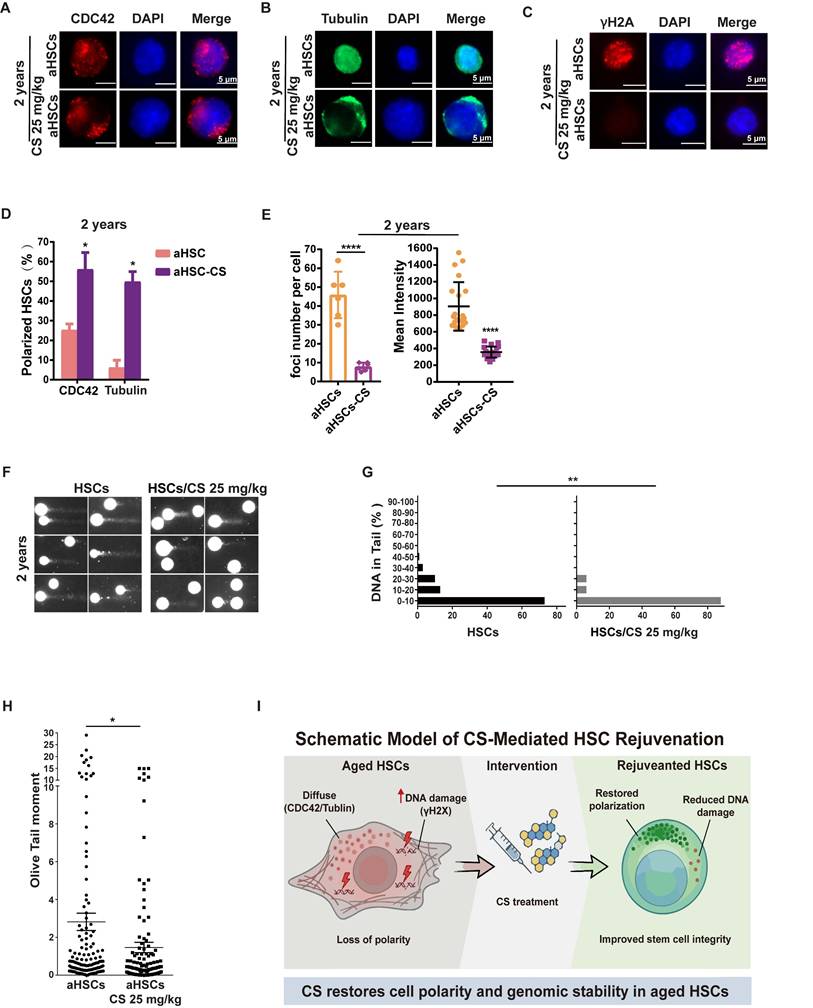
Loss of cell polarity and elevated CDC42 activity are established hallmarks of aged HSCs [48, 49]. IF assays on CDC42 and Tubulin (TUBA1A) revealed that the majority of aged HSPCs were re-polarized post CS treatment (Figure 2A-B, D and Figure S1A-B, D). DNA damage burden and repair capacity are important indicators of cellular senescence [50]. Aged HSPCs displayed increased γH2AX foci, whereas CS-treated cells showed a marked reduction, with only rare foci detected (Figure 2C, E and Figure S1C, E). Moreover, there was a significant reduction in the HSPC DNA damage burden following CS treatment when compared to untreated cells (Figure 2F-H and Figure S1F-H). Together, these results indicate that CS treatment restores cell polarity and reduces genomic instability in aged HSCs, as summarized in the schematic model in Figure 2I.
CS treatment rejuvenates aged HSPC phenotypes. (A and B) Immunofluorescence staining of CDC42 (red) (A) and tubulin (B) for a polarity analysis using HSCs isolated from 2-year-old mice treated with CS or vehicle, DAPI (blue) was used to indicate nuclear localization (n = 3, each group). (Scale bar, 5 μm.) (C) Immunofluorescence staining of γH2AX (red) in HSCs isolated from 2-year-old mice treated with CS or vehicle for DNA damage analysis; DAPI (blue) for indicating nuclei localization (n = 3, each group). (Scale bar, 5 μm.) (D) The percentage of polar cells in each sample from 2-year-old mice was analyzed, and scored as indicated (n = 3, each group). (E) For 2-year-old mice, the γH2AX MFI and the number of foci per cell are presented as shown. Four independent replicates were performed. (F) Alkaline comet results for HSCs isolated from 2-year-old mice treated with vehicle (F-I) or CS (F-II) as indicated. (G and H) Percentage of DNA in tail (G-I, II) and (H) olive tail moment of HSCs from 2-year-old mice treated with vehicle or CS as indicated. (I) Schematic model of CS-mediated rejuvenation of aged HSCs. Results were represented with the mean ± SEM. *P < 0.05, **P < 0.01, ***P < 0.001 and ****P < 0.0001 were considered as significant difference.
CS treatment also resulted in increased proliferation and elevated absolute numbers of HSPCs, including long-term HSCs (LT-HSCs), short-term HSCs (ST-HSCs), and multipotent progenitors (MPPs) (Figure S2A-F). Hematopoietic progenitor cells (HPCs), including Common Myeloid Progenitors (CMPs), Granulocyte-Monocyte Progenitors (GMPs), and Megakaryocyte-Erythroid Progenitors (MEPs) were similarly expanded (Figure S2G-L). Correspondingly, the total white blood cell counts in the peripheral blood (PB), spleen (SPL) and bone marrow (BM) were increased in CS-treated mice (Figure S3A-F). Collectively, these data support a broad enhancement of hematopoietic output following CS treatment.
CS restores transcriptional and metabolic programs in aged HSCs
To investigate the molecular mechanisms underlying CS-mediated rejuvenation, HSPCs (LSK, Linlow-Sca1+-c-Kit+) were isolated from aged mice treated with vehicle or CS (Figure 3A) [51]. After stringent cell filtration, 19,324 cells were retained for subsequent analyses. We visualized global LSK populations using uniform manifold approximation and projection (UMAP) and identified three distinct HSPC populations corresponding to LT-HSCs, ST-HSCs, and MPPs based on established transcriptional signatures (Figure 3B) [52]. CS treatment increased the proportion of cells in S and G2/M phases across compartments, indicating enhanced cell cycle activity (Figure 3C).
Single-cell transcriptomic profiling of CS-treated HSCs. (A) Schematic workflow outlining the process of scRNA-seq (n = 3, each group), phenotypic characterization, and mechanistic validation following CS injection in aged mice. (B) UMAP visualization of LSK cells from aged and CS-treated aged mice, colored by group (top). UMAP visualization of LT-HSC, ST-HSC, and MPP subpopulations based on their transcriptional profiles (bottom). (C) Distribution of cell cycle phases (G1, S, and G2/M) across indicated HSC subsets, quantified via bar charts (chi-square test). (D) Pseudotime trajectory of HSCs from combined scRNA-seq data, colored by pseudotime. Pseudotime-ordered analysis of HSCs from the aged and CS-treated aged samples. (E) Heatmap showing dynamic changes of highly variable genes along the pseudotime (cataloged hierarchically into four gene modules). Adjusted p value < 0.05 was considered statistically significant for GO enrichment analysis. (F) Comparison of relative subsystem coverage between aged and CS-treated aged HSCs GEMs, based on scRNA-seq and RNA-seq data. (G) Heatmap of enriched pathways from RNA-seq (n = 3, each group). Differential pathway enrichment between CS-treated and control aged HSCs was determined via GSEA against the MSigDB collection (*P < 0.05, permutation test).
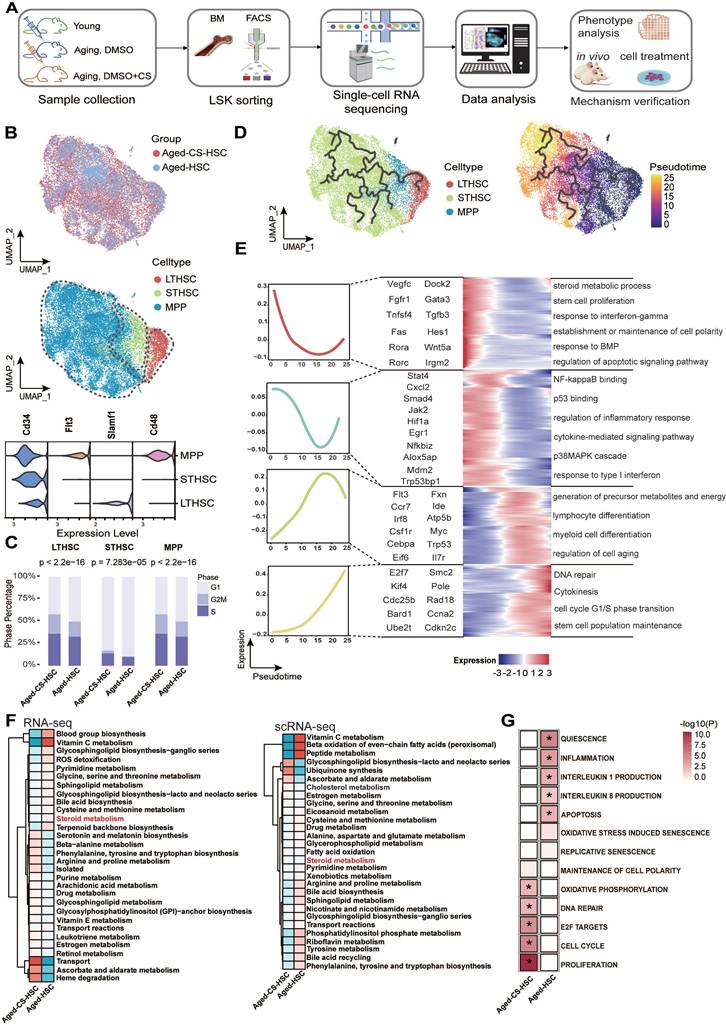
Previous studies have demonstrated that hallmarks of HSC aging, including elevated γH2AX foci, loss of polarity (CDC42, tubulin), and chronic inflammation, are progressive with age [48, 53, 54]. To further elucidate dynamic changes, a pseudotime trajectory from the combined single-cell dataset of HSCs was reconstructed (Figure 3D). By ordering highly variable genes along this trajectory, we observed an enrichment of genes involved in stem cell proliferation (e.g., Vegfc, Wnt5a), DNA repair (e.g., Bard1, Ube2t), and other pathways associated with HSC self-renewal (Figure 3E) [55, 56]. Gene set scores calculated over pseudotime demonstrated that pathways linked to the unfolded protein response, cellular senescence, and inflammation were significantly downregulated in the CS-treated group compared to the untreated aged group (Figure S4A). Given the central role of mTOR signaling in stem cell regulation and aging, we specifically evaluated this pathway. Genes in the “Hallmark mTORC1 signaling” pathway were significantly upregulated following CS treatment (Figure S4C and D), suggesting reactivation of anabolic and proliferative programs. Along the pseudotime trajectory, expression of Mtor, Trp53, and Myc increased, while the senescence marker Cdkn1a (p21) was markedly reduced in CS-treated cells (Figure S4B).
Bulk RNA-seq analysis corroborated these findings, demonstrating reversal of age-associated transcriptional signatures, activation of DNA repair pathways, and suppression of inflammatory signaling (Figure 3G). Integration of transcriptomic data into GEMs revealed partial restoration of metabolic subsystems, including steroid metabolism, following CS treatment (Figure 3F).
At the protein level, immunofluorescence analysis demonstrated increased expression of total mTOR and phosphorylated mTOR (p-mTOR) in CS-treated aged HSPCs (Figure S4E-H). Given the complex role of mTOR in HSC aging, where hyperactivation drives exhaustion but basal activity is essential for maintenance, we sought to clarify the nature of CS-induced mTOR signaling [57]. To assess the magnitude of pathway activation, aged HSCs treated with vehicle, CS, or the potent synthetic mTOR agonist MHY1485 were compared. CS treatment significantly increased p-mTOR, p-S6K, and p-4EBP1 levels relative to vehicle-treated controls, whereas MHY1485 induced substantially higher p-mTOR and p-S6K levels (Figure S5). These results indicate that CS induces a distinct pattern and magnitude of mTOR pathway activation compared with strong pharmacologic stimulation.
In parallel, the DNA repair proteins ATM and PARP1 were upregulated following CS treatment (Figure S4K-N). Interestingly, E2F1 protein levels were reduced despite enrichment of E2F target gene signatures (Figure S4I-J), suggesting post-transcriptional regulation.
CS treatment clears stress-responsive HSCs
In the single-cell atlas of HSCs, a distinct cluster of MPPs characterized by high expression of Hspb1 was identified exclusively in aged mice, but not in CS-treated aged mice (Figure 4A and B). Based on enrichment of inflammatory, stress-response, and DNA repair pathways, this population was designated as stress-responsive HSCs (Figure 4H). This cluster was labeled and projected onto the UMAP dimension reduction space of young, aged, and CS-treated aged MPPs. SrHSCs were uniquely present in the aged group, with hardly detectable presence in young or CS-treated aged mice (Figure 4C). Notably, Hspb1 shows differential expression in HSCs from normal aged mice and elderly human donors compared to their younger counterparts (Figure 4D and E).
CS treatment clears senescent-like HSCs. (A) UMAP-based visualization of cell density distributions for CS-treated (left) and untreated (right) aged HSCs, shown as Galaxy plots. (B) UMAP plot highlighting a srHSC cluster with high Hspb1 expression in aged mice. (C) UMAP visualization of MPPs from young, aged, and CS-treated aged mice, colored by group (bottom), srHSC across groups (top), and Hspb1 expression (middle). (D) HSPB1 gene expression of HSCs between elderly and young people by Wilcoxon test, ****P < 0.0001. (E) Differential gene expression analysis showing up- and down-regulated genes across eight healthy aged mice versus young mice HSCs. All adjusted p value < 0.01 dots were shown. up-regulated genes are indicated in red, while down-regulated genes are indicated in blue. Genes with an adjusted p value < 0.01 and log2 fold change > 0.263 were considered DEGs. Among these DEGs, Hspb1 is highlighted, with a total of five instances. (F) Cell clusters between aged-CS and aged group were visualized using UMAP (top). UMAP plots showing Hspb1 gene expression in LTHSCs (bottom left). Identification of 6 subclusters of LTHSCs across all samples (bottom right). (G) The proportions of 6 subclusters in HSCs from aged-CS and aged groups. (H) UMAP plot of gene signatures for inflammation, DNA repair, and cellular stress pathways in HSCs, generated by UCell. (I) Heat map showing the scaled expression of top 5 marker genes in each cell cluster. (J) Dot plot showing Gene Ontology (GO) enrichment of highly expressed genes in C3 subcluster.
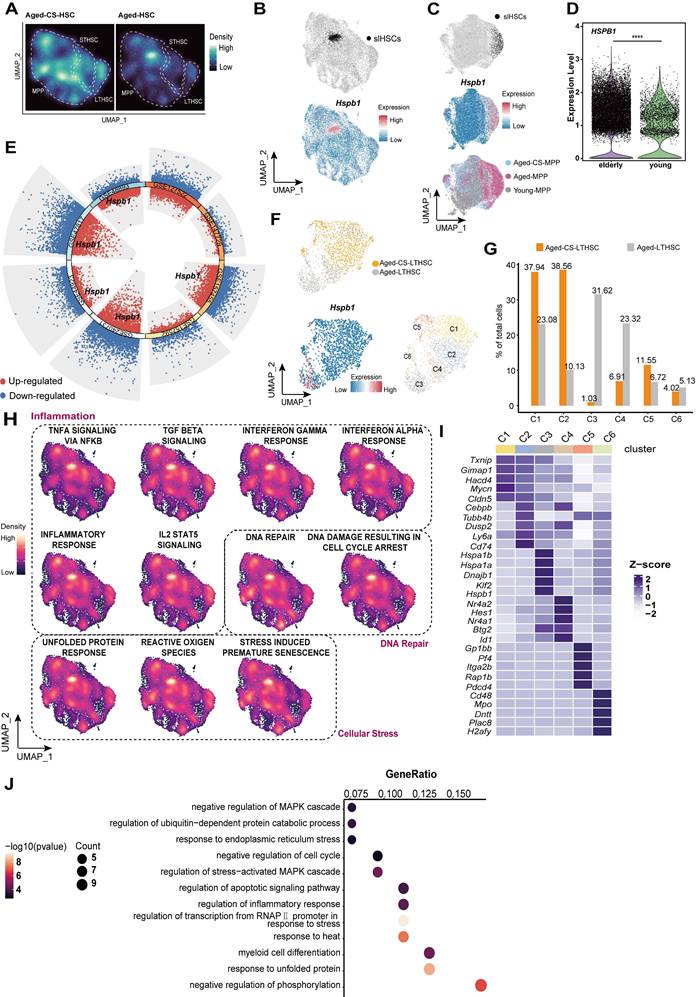
Unsupervised clustering of LT-HSCs further revealed a similar srHSCs, cluster C3 in aged mice, which high expressed Hspb1 and other genes associated with cellular senescence (Figure 4F and I-J). This cluster was nearly abolished following CS treatment (Figure 4F and G).
Collectively, these findings indicate that CS treatment mitigates aging-associated stress-responsive transcriptional states.
CS accelerates DNA repair following acute genotoxic stress
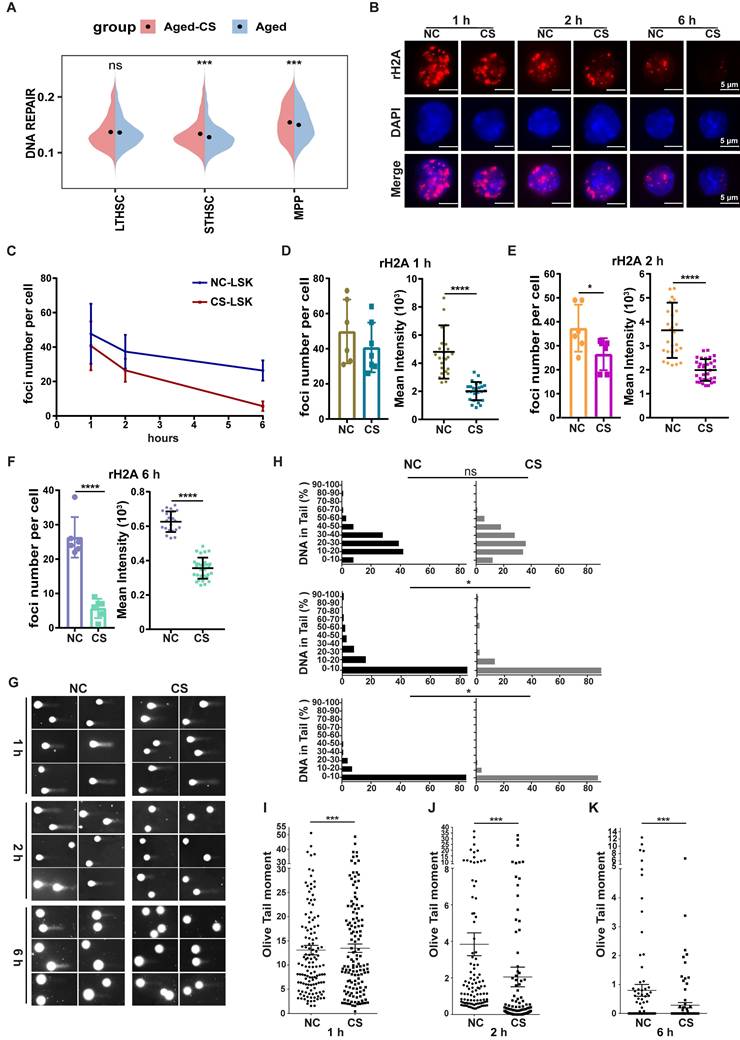
The data contained herein demonstrated that CS reversed the amount of DNA damage level in HSPCs from aged mice (Figure 2G-H), which suggests that CS influences DNA damage repair processes. The transcriptome sequencing analysis also revealed that there was an expression increase of genes involved in DNA repair pathways following CS treatment (Figure 5A). To further demonstrate the role of CS in DNA damage repair, an acute DNA damage mouse model was constructed by use with low-dose gamma-ray irradiation. Post irradiation mice were sacrificed at different time points and HSPCs were isolated for an analysis to identify DNA damage lesions. At the examined time points, the DNA repair process was significantly faster, reflected by fewer γH2AX foci within HSCs from the CS treated group (Figure 5B, D-F). The rate of γH2AX foci decline was greater in the CS treatment group than the decline in the control group mice, which indicates that CS treatment also accelerated the DNA repair speed (Figure 5C). To assess the accumulation of DNA damage in irradiated HSCs, a quantitative assessment of DNA damage was performed. The comet assay demonstrated that the accumulation of DNA damage burden in HSPCs from CS treated mice was significantly lower (Figure 5H-K). These results indicate that CS treatment is associated with accelerated DNA repair following genotoxic stress.
CS treatment accelerates DNA repair. (A) Violin plots showing the UCell scores of DNA repair pathway in different cell types of aged-CS and aged groups. (two-sided Wilcoxon rank-sum test). (B) Following γ-irradiation, γH2AX staining was performed on HSPCs isolated from DMSO- or CS-treated mice at specific intervals (red). DAPI (blue) was to indicate nuclei (n = 3, each group). (Scale bar, 5 μm.) (C-F) The average number of γH2AX foci (C) and the average MFI intensity value in each sample at 1 (D), 2 (E) and 6 h (F) were summarized and indicated. All the data were summarized from at least three individual mice and for a total of no less than 80 cells. (G-K) The post irradiation alkaline comet results for HSCs from DMSO or CS treated at 1, 2, 6 h (G). Summary of the percentage of DNA in tails (H) and the olive distance (I, J and K) for HSCs from experimental and control mice at each time period (n = 3, each group). Error bars indicate the mean ± SEM. Comparisons between groups were performed via the Mann-Whitney test. *P < 0.05, **P < 0.01, ***P < 0.001, and ****P < 0.0001 were considered statistically significant, whereas 'ns' indicates no significance (D-F and H-K).
CS-induced HSCs Proliferation via RORA activation
To identify functional targets mediating the pro-regenerative effects of CS, SEA-predicted targets (Table S3) were intersected with pathways associated with inflammation and steroid metabolism. This analysis revealed RORA and NR1H4 as overlapping candidates (Figure 6A). Given the established role of RORA in regulating HSC function and maintenance, subsequent analyses focused on this receptor [58]. In contrast, NR1H4 primarily associated with bile acid metabolism, has limited reported relevance in HSC biology.
CS treatment promotes HSC proliferation via RORA activation. (A) Venn plot showing the number of genes shared among gene sets related to inflammation, steroid metabolism, and SEA-predicted targets of CS, identifying Rora and Nr1h4 as common nodes. (B) Molecular dynamics simulation snapshot of the RORA-CS complex at the final time point. The RORA protein is visualized in both atomic surface and cartoon representations, while the bound CS molecule is highlighted as red spheres, illustrating its stable positioning within the LBD. (C) Immunofluorescence staining of RORA in HSCs from young mice, treated with or without CS, as indicated (n = 3, each group). (Scale bar, 5 μm.) (D) The MFI in each individual cell was analyzed and the dots indicate the individual counted cells (n = 3, each group).(E)Immunofluorescence staining of RORA (green) in young HSCs (E-I), DAPI (E-II), and merge (E-III); aged HSCs (E-IV), DAPI (E-V), and merge (E-VI); aged HSCs treated with CS (E-VII), DAPI (E-VIII), and merge (E-IX) (n = 3, each group). (Scale bar, 5 μm.) (F) MFI of RORA in each individual cell, the total cell counts were as indicated. (G) RORA protein in human HSCs (CD34+ cells) (young and aged, n = 3, each group). (Scale bar, 5 μm.) (H) The MFI in each individual cell was analyzed and indicated using dots (n = 3, each group). (I and J) FACS diagram (I) showing the number and percentage (J) of HSCs in BM from recipients that received wild-type (WT) BM cells transduced with MIG or MIG-Rora retroviruses four weeks post BMT (n = 3, each group). Results were represented with the mean ± SEM. *P < 0.05, **P < 0.01, ***P < 0.001 and ****P < 0.0001 were considered as significant difference (Mann-Whitney test).
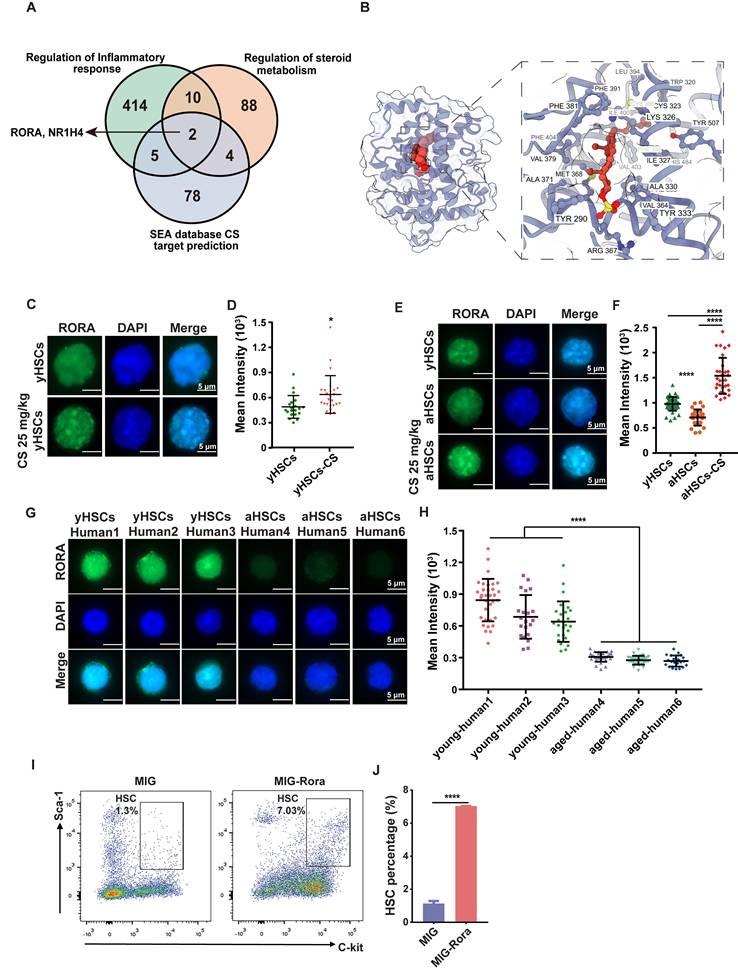
We next examined whether CS directly binds to RORA using molecular docking and molecular dynamics simulations. Docking predicted a stable binding pose of CS within the LBD of RORA (Figure 6B). CS formed more frequent hydrogen bonds and exhibited a lower binding free energy than 4ACD8, a sterol-like RORA ligand co-crystallized in the RORα structure (PDB: 4S15), which was used as a positive control (Figure S6E-H, Figure S7E-G). Although the RMSD and RMSF values of the CS-RORA complex were slightly higher, they remained within the stable range of 1-3 Å, indicating acceptable conformational stability (Figure S6A-D, Figure S7A-D, Table S4). These findings are consistent with earlier crystallographic studies identifying CS as a physiological ligand of RORA [59, 60].
Immunofluorescence staining revealed that RORA protein was downregulated in aged mice and human HSCs compared to young controls (Figure 6C-H). Notably, CS treatment significantly enhanced RORA expression in HSCs from young mice compared to untreated controls (Figure 6C-D), and restored RORA expression in HSCs from aged mice to youthful levels (Figure 6E-F). We further tested whether RORA is functionally sufficient to drive HSC expansion. Rora was overexpressed in HSPCs via retroviral transduction, followed by BMT. HSPCs were analyzed four weeks post BMT and a greater number of HSPCs were detected in the recipients of the cells with high Rora expression compared to the vector group recipients (Figure 6I-J).
Conversely, conditional deletion of Rora in young HSCs resulted in premature aging phenotypes, including loss of polarity and increased DNA damage by employing a lineage-specific knockout model (Rorafl/fl Mx1-Cre) (Figure S8). These findings suggest that RORA is essential for maintaining the core homeostatic hallmarks of youthful HSCs. Collectively, these findings support the CS-RORA axis as a key mechanistic contributor to CS-mediated rejuvenation of aged HSCs.
Discussion
While significant progress has been made in characterizing the transcriptional and epigenetic changes accompanying HSC aging, effective and safe strategies to reverse these phenotypes remain limited. Over the past decade, transcriptomic technologies have generated vast public datasets across developmental, aging, and disease contexts, yet strategies to systematically integrate and functionally mine these resources remain underdeveloped. To address this gap, we established a human data-driven, metabolism-centered strategy to systematically identify endogenous compounds with rejuvenating potential in aged HSCs. By constructing GEMs from transcriptomic profiles of purified human HSCs, we captured aging-associated metabolic alterations and prioritized naturally depleted metabolites that may underlie functional decline (Figure 1). This approach bridges systems biology with clinically relevant compound discovery and is guided by the broadly accepted principle of restoring what is lost, a concept rooted in both traditional medicine and modern metabolic therapy frameworks [9,10].
Herein, we identified CS, a naturally occurring sterol conjugate, as a key metabolic regulator of HSC aging. CS supplementation in aged mice reversed multiple hallmarks of aging across transcriptional, metabolic, and functional dimensions (Figure 2-3 and Figure S1-4), highlighting its potential as a safe and physiologically compatible therapeutic candidate. At the single-cell level, CS eliminated a transcriptionally defined population of srHSCs marked by elevated Hspb1 (Figure 4), a change that was also observed in independent aging datasets, suggesting conserved relevance. Due to the role CS plays in accelerating DNA damage repair (Figure 5), CS has potential applications for the reduction of DNA damage following irradiation therapy and accidental radiation expose.
Mechanistically, our data support a model in which RORA functions as a key mediator downstream of CS. This link is supported by prior structural studies that solved the RORA ligand-binding domain and identified cholesterol sulfate as a natural ligand [59, 60]. In our study, CS activated a RORA-associated transcriptional program, and enforced Rora expression was sufficient to reproduce a major component of the CS phenotype, namely HSC expansion (Figure 6). Importantly, to begin addressing necessity, we leveraged an inducible conditional knockout model and found that Rora deletion in young mice elicited premature aging-like defects in HSC polarity and genomic integrity (Figure S8), two mechanistic features strongly implicated by our CS response data. In conclusion, RORA was identified as a pivotal functional mediator that sustains juvenile HSC homeostasis and orchestrates the primary effects of CS. Furthermore, mTOR signaling influences HSC senescence in a sophisticated, context-specific manner. While mTOR activity is increased in old HSCs, more recent studies suggest that subsets of aged HSCs exhibit suppressed mTORC1 activity [53, 57]. Our transcriptomic and protein-level analyses revealed that CS treatment modestly reactivated mTOR signaling (Figure S5). This pattern supports a model in which CS promotes a restrained, physiologically balanced reactivation of the mTOR network, potentially sufficient to support repair and proliferative competence without forcing the pathway into a hyperactivated exhaustion-prone state. Additionally, we observed that CS treatment enriched E2F target gene expression while reducing E2F1 protein levels. This apparent paradox may reflect post-transcriptional feedback or regulatory cross-talk. Prior work has shown that RORA can bind and repress E2F1 transcriptional activity, suggesting that RORA activation may help balance proliferative signaling without triggering aberrant hyperproliferation [61].
We also acknowledge several limitations that will need to be addressed in future work. Although we observed improved proliferation, reduced DNA damage, and enhanced hematopoietic output, competitive transplantation or serial transplantation assays are lacking. Thus, the extent to which CS restores long-term self-renewal and clonal durability remains to be determined. The computational discovery pipeline is based on human datasets. However, functional testing was primarily conducted in mice. Direct ex vivo validation in primary human CD34+HSPCs, such as CS-responsive transcriptomic profiling, will be an important next step to enhance translational relevance. Given that CS is a cholesterol-derived sterol conjugate, potential off-target effects through other sterol-sensing nuclear receptors should also be considered. Notably, LXR activation has been reported to induce the sterol sulfotransferase SULT2B1b [62], and SULT2B1b-mediated formation of sulfated sterols can suppress LXR/SREBP-1c signaling [63]. Consistently, LXR-linked cholesterol efflux via ABCA1/ABCG1 and HDL restrains HSC proliferation in vivo [64], which contrasts with the robust HSC expansion observed with CS supplementation in aged mice. These considerations argue against LXR activation being the dominant driver of the CS phenotype in our setting. Nevertheless, we cannot formally exclude auxiliary contributions from LXR- or FXR-associated mechanisms, particularly via indirect or systemic effects. Therefore, while our data support RORA as a key mediator of CS responsiveness, future studies combining CS administration with receptor-specific genetic ablation or pharmacologic perturbation will be required to rigorously dissect the relative contributions of RORA versus other sterol-sensing pathways.
Our identification of CS adds to the expanding repertoire of metabolites reported to modulate aging-associated stem cell phenotypes. Uridine was reported to activate FoxO signaling, enhance self-renewal, and suppress inflammation in aged HSCs [16]. In parallel, α-ketoglutarate has been shown to extend adult C. elegans lifespan by binding and inhibiting ATP synthase subunit β, leading to reduced ATP production and oxygen consumption, increased autophagy, and a TOR-dependent longevity program [65]. Distinct from these nucleoside- and mitochondrial energy-linked mechanisms, our study supports a model in which CS, as a sterol-derived signaling metabolite, engages the nuclear receptor RORA as a key mediator to restore HSC polarity and genomic integrity while suppressing inflammatory programs. Together, these findings highlight that metabolic interventions may influence aging through complementary nodes, ranging from transcription factor networks to mitochondrial energy metabolism and autophagy.
Conclusions
In summary, this study identifies CS as a critical endogenous metabolite that declines during HSC aging. CS supplementation effectively rejuvenates aged HSCs by restoring cell polarity, mitigating genomic instability, and enhancing hematopoietic output. Mechanistically, the CS-RORA axis functions as a key mediator of this metabolic rejuvenation. Given the endogenous nature and safety of CS, these results highlight the potential of CS replenishment as a promising and translational metabolic strategy to reverse age-related hematopoietic decline.
Abbreviations
scRNA-seq: single-cell RNA sequencing; CS: cholesterol sulfate; BM: Bone marrow; HSPC: Hematopoietic Stem and Progenitor Cell; HSC: Hematopoietic stem cell; PCA: Principal component analysis; ORA: over-representation analysis; GSEA: Gene Set Enrichment Analysis; CML: chronic myeloid leukemia; MDS: myelodysplastic syndromes; GEM: Genome-scale Metabolic; TPM: Transcripts Per Million; CCA: Canonical Correlation Analysis; LT-HSC: Long-Term HSC; ST-HSC: Short-Term HSC; RMSF: root-mean-square fluctuation; MPP: Multi-Potent Progenitors; UMAP: uniform manifold approximation and projection; CMP: Common Myeloid Progenitors; GMP: granulocyte-monocyte progenitor; LBD: canonical ligand-binding domain; srHSCs: stress-responsive HSCs; PME: Particle Mesh Ewald; RMSD: root-mean-square deviation; NVT: constant number, volume, and temperature; MEP: Megakaryocyte-Erythroid Progenitor; NPT: constant number, pressure, and temperature; BMT: bone marrow transplantation; LXR: Liver X Receptor; WT: Wild-type.
Supplementary Material
Supplementary figures and tables.
Acknowledgements
The authors would like to express their gratitude to the State Key Laboratory of Biotherapy and the Collaborative Innovation Center for Biotherapy for their technical and infrastructural support. We also appreciate the assistance provided by the personnel at the core facility and the laboratory animal center of West China Hospital.
Funding
Financial support for this research was provided by the National Natural Science Foundation of China (Grants 82170114 and 81770103 awarded to Y.H.). Additional funding was obtained from the Sichuan Provincial Haiju Program for High-End Talent Introduction (2025HJRC0029), the Key Research and Development Project of Sichuan Province (2023YFWZ0005), Guizhou Provincial Clinical Medical Research Center-Cancer Disease Research (Qiankehe Platform LCZX [2025] 002) and the Science and Technology Foundation of Guizhou Province (Qiankehe foundation ZK [2023] 213).
Author contributions
Y.H. was responsible for the study's conceptualization and proofreading. Methodology and the initial draft were prepared by Y.F. and N.L. Experimental investigations were conducted by Y.F., N.L., N.W., W.H., X.C., B.W., R.Q., H.Q., Q.Q., L.Z., Y.S., L.H. and C.P. The resulting data were analyzed by Y.H., N.L., N.W., W.H. and H.L. The final manuscript underwent review and editing by Y.H., Y.F., N.L. and H.L. Supervision of the project was carried out by H.L., Z.L. and A.S.
Availability of data and material
The transcriptomic datasets utilized in this research are publicly accessible via the Gene Expression Omnibus (GEO) repository (https://www.ncbi.nlm.nih.gov/geo/). Specific sample details, including group designations and accession IDs, are compiled in Table S5. The primary RNA-seq and scRNA-seq files generated during this work have been archived at the Genome Sequence Archive (GSA) under the identifiers CRA022372 and CRA021800, respectively. Computational scripts are hosted on GitHub at https://github.com/ziweihf/CS-Replenishment-Rejuvenates-Aged-HSC. All other data necessary to support the conclusions of this paper are provided within the manuscript or its supplementary files. Further inquiries regarding data reanalysis should be directed to the corresponding author.
Ethics
Human Study: All procedures involving human biological samples were conducted in strict accordance with the Declaration of Helsinki. The study protocol was reviewed and approved by the Ethics Committee on Biomedical Research of West China Hospital, Sichuan University (Approval No. 1020). Informed consent was obtained from all participants prior to their inclusion in the study.
Animal Study: All animal experiments were performed under the approval of the Institutional Animal Care and Use Committee (IACUC) of the State Key Laboratory of Biotherapy, Sichuan University (Approval No. 2021967A). The researchers followed the national guidelines for the care and use of laboratory animals to ensure the ethical treatment and welfare of all animals used in this research.
Competing Interests
The authors have declared that no competing interest exists.
References
1. Tidwell TR, Soreide K, Hagland HR. Aging, Metabolism, and Cancer Development: from Peto's Paradox to the Warburg Effect. Aging and disease. 2017;8:662-76
2. Adelman ER, Huang HT, Roisman A, Olsson A, Colaprico A, Qin T. et al. Aging Human Hematopoietic Stem Cells Manifest Profound Epigenetic Reprogramming of Enhancers That May Predispose to Leukemia. Cancer discovery. 2019;9:1080-101
3. Verovskaya EV, Dellorusso PV, Passegue E. Losing Sense of Self and Surroundings: Hematopoietic Stem Cell Aging and Leukemic Transformation. Trends in molecular medicine. 2019;25:494-515
4. McHugh D, Gil J. Senescence and aging: Causes, consequences, and therapeutic avenues. The Journal of cell biology. 2018;217:65-77
5. Munoz-Espin D, Serrano M. Cellular senescence: from physiology to pathology. Nature reviews Molecular cell biology. 2014;15:482-96
6. Kollman C, Howe CW, Anasetti C, Antin JH, Davies SM, Filipovich AH. et al. Donor characteristics as risk factors in recipients after transplantation of bone marrow from unrelated donors: the effect of donor age. Blood. 2001;98:2043-51
7. Sadighi Akha AA. Aging and the immune system: An overview. Journal of immunological methods. 2018;463:21-6
8. Geiger H, Van Zant G. The aging of lympho-hematopoietic stem cells. Nature immunology. 2002;3:329-33
9. Min H, Montecino-Rodriguez E, Dorshkind K. Effects of aging on early B- and T-cell development. Immunological reviews. 2005;205:7-17
10. Pang WW, Price EA, Sahoo D, Beerman I, Maloney WJ, Rossi DJ. et al. Human bone marrow hematopoietic stem cells are increased in frequency and myeloid-biased with age. Proceedings of the National Academy of Sciences of the United States of America. 2011;108:20012-7
11. Geiger H, de Haan G, Florian MC. The ageing haematopoietic stem cell compartment. Nature reviews Immunology. 2013;13:376-89
12. Doulatov S, Notta F, Laurenti E, Dick JE. Hematopoiesis: a human perspective. Cell stem cell. 2012;10:120-36
13. Ainciburu M, Ezponda T, Berastegui N, Alfonso-Pierola A, Vilas-Zornoza A, San Martin-Uriz P. et al. Uncovering perturbations in human hematopoiesis associated with healthy aging and myeloid malignancies at single-cell resolution. Elife. 2023 12
14. Velten L, Haas SF, Raffel S, Blaszkiewicz S, Islam S, Hennig BP. et al. Human haematopoietic stem cell lineage commitment is a continuous process. Nat Cell Biol. 2017;19:271-81
15. de Morree A, Rando TA. Regulation of adult stem cell quiescence and its functions in the maintenance of tissue integrity. Nature Reviews Molecular Cell Biology. 2023;24:334-54
16. Zeng X, Shi C, Han Y, Hu K, Li X, Wei C. et al. A metabolic atlas of blood cells in young and aged mice identifies uridine as a metabolite to rejuvenate aged hematopoietic stem cells. Nat Aging. 2024;4:1477-92
17. Rivera D, Onisko N, Cao JD, Koyfman A, Long B. High risk and low prevalence diseases: Metformin toxicities. The American Journal of Emergency Medicine. 2023;72:107-12
18. Zhang L, Pitcher LE, Prahalad V, Niedernhofer LJ, Robbins PD. Targeting cellular senescence with senotherapeutics: senolytics and senomorphics. The FEBS Journal. 2022;290:1362-83
19. Wilkinson JE, Burmeister L, Brooks SV, Chan CC, Friedline S, Harrison DE. et al. Rapamycin slows aging in mice. Aging Cell. 2012;11:675-82
20. Lee DJW, Hodzic Kuerec A, Maier AB. Targeting ageing with rapamycin and its derivatives in humans: a systematic review. The Lancet Healthy Longevity. 2024;5:e152-e62
21. Yoshino J, Baur JA, Imai S-i. NAD+ Intermediates: The Biology and Therapeutic Potential of NMN and NR. Cell Metabolism. 2018;27:513-28
22. Chin RM, Fu X, Pai MY, Vergnes L, Hwang H, Deng G. et al. The metabolite α-ketoglutarate extends lifespan by inhibiting ATP synthase and TOR. Nature. 2014;510:397-401
23. Ryu D, Mouchiroud L, Andreux PA, Katsyuba E, Moullan N, Nicolet-dit-Félix AA. et al. Urolithin A induces mitophagy and prolongs lifespan in C. elegans and increases muscle function in rodents. Nature Medicine. 2016;22:879-88
24. Sasaki Y, Jensen CT, Karlsson S, Jacobsen SE. Enforced expression of cyclin D2 enhances the proliferative potential of myeloid progenitors, accelerates in vivo myeloid reconstitution, and promotes rescue of mice from lethal myeloablation. Blood. 2004;104:986-92
25. Yang L, Bryder D, Adolfsson J, Nygren J, Mansson R, Sigvardsson M. et al. Identification of Lin(-)Sca1(+)kit(+)CD34(+)Flt3- short-term hematopoietic stem cells capable of rapidly reconstituting and rescuing myeloablated transplant recipients. Blood. 2005;105:2717-23
26. Matsuoka Y, Sasaki Y, Nakatsuka R, Takahashi M, Iwaki R, Uemura Y. et al. Low level of c-kit expression marks deeply quiescent murine hematopoietic stem cells. Stem cells. 2011;29:1783-91
27. Gustafsson J, Anton M, Roshanzamir F, Jornsten R, Kerkhoven EJ, Robinson JL. et al. Generation and analysis of context-specific genome-scale metabolic models derived from single-cell RNA-Seq data. Proceedings of the National Academy of Sciences of the United States of America. 2023;120:e2217868120
28. Robinson JL, Kocabas P, Wang H, Cholley PE, Cook D, Nilsson A. et al. An atlas of human metabolism. Sci Signal. 2020 13
29. Wang H, Robinson JL, Kocabas P, Gustafsson J, Anton M, Cholley PE. et al. Genome-scale metabolic network reconstruction of model animals as a platform for translational research. Proceedings of the National Academy of Sciences of the United States of America. 2021 118
30. Kolde R. pheatmap: Pretty heatmaps [Software]. 2015.
31. Kim D, Paggi JM, Park C, Bennett C, Salzberg SL. Graph-based genome alignment and genotyping with HISAT2 and HISAT-genotype. Nat Biotechnol. 2019;37:907-15
32. Anders S, Pyl PT, Huber W. HTSeq-a Python framework to work with high-throughput sequencing data. Bioinformatics. 2015;31:166-9
33. Butler A, Hoffman P, Smibert P, Papalexi E, Satija R. Integrating single-cell transcriptomic data across different conditions, technologies, and species. Nature biotechnology. 2018;36:411-20
34. Qiu X, Mao Q, Tang Y, Wang L, Chawla R, Pliner HA. et al. Reversed graph embedding resolves complex single-cell trajectories. Nature Methods. 2017;14:979-82
35. Andreatta M, Carmona SJ. UCell: Robust and scalable single-cell gene signature scoring. Computational and Structural Biotechnology Journal. 2021;19:3796-8
36. Love MI, Huber W, Anders S. Moderated estimation of fold change and dispersion for RNA-seq data with DESeq2. Genome biology. 2014;15:550
37. Ritchie ME, Phipson B, Wu D, Hu Y, Law CW, Shi W. et al. limma powers differential expression analyses for RNA-sequencing and microarray studies. Nucleic Acids Res. 2015;43:e47-e
38. Harris MA, Clark J, Ireland A, Lomax J, Ashburner M, Foulger R. et al. The Gene Ontology (GO) database and informatics resource. Nucleic acids research. 2004;32:D258-61
39. Abraham MJ, Murtola T, Schulz R, Páll S, Smith JC, Hess B. et al. GROMACS: High performance molecular simulations through multi-level parallelism from laptops to supercomputers. SoftwareX. 2015;1-2:19-25
40. Zahn D, Schilling B, Kast SM. Enhancement of the Wolf Damped Coulomb Potential: Static, Dynamic, and Dielectric Properties of Liquid Water from Molecular Simulation. The Journal of Physical Chemistry B. 2002;106:10725-32
41. Hornak V, Abel R, Okur A, Strockbine B, Roitberg A, Simmerling C. Comparison of multiple Amber force fields and development of improved protein backbone parameters. Proteins: Structure, Function, and Bioinformatics. 2006;65:712-25
42. Valdés-Tresanco MS, Valdés-Tresanco ME, Valiente PA, Moreno E. gmx_MMPBSA: A New Tool to Perform End-State Free Energy Calculations with GROMACS. Journal of Chemical Theory and Computation. 2021;17:6281-91
43. Connor KM, Hsu Y, Aggarwal PK, Capone S, Colombo AR, Ramsingh G. Understanding metabolic changes in aging bone marrow. Exp Hematol Oncol. 2018;7:13
44. Nakamura-Ishizu A, Ito K, Suda T. Hematopoietic Stem Cell Metabolism during Development and Aging. Dev Cell. 2020;54:239-55
45. Tadokoro Y, Hirao A. The Role of Nutrients in Maintaining Hematopoietic Stem Cells and Healthy Hematopoiesis for Life. Int J Mol Sci. 2022 23
46. Schumacher B, Pothof J, Vijg J, Hoeijmakers JHJ. The central role of DNA damage in the ageing process. Nature. 2021;592:695-703
47. van der Werf I, Sneifer J, Jamieson C. RNA Modifications Shape Hematopoietic Stem Cell Aging: Beyond the Code. FEBS letters. 2024;598:2774-5
48. Florian MC, Dorr K, Niebel A, Daria D, Schrezenmeier H, Rojewski M. et al. Cdc42 activity regulates hematopoietic stem cell aging and rejuvenation. Cell stem cell. 2012;10:520-30
49. Xing Z, Ryan MA, Daria D, Nattamai KJ, Van Zant G, Wang L. et al. Increased hematopoietic stem cell mobilization in aged mice. Blood. 2006;108:2190-7
50. Beerman I, Seita J, Inlay MA, Weissman IL, Rossi DJ. Quiescent hematopoietic stem cells accumulate DNA damage during aging that is repaired upon entry into cell cycle. Cell stem cell. 2014;15:37-50
51. Pereira CF, Chang B, Qiu J, Niu X, Papatsenko D, Hendry CE. et al. Induction of a hemogenic program in mouse fibroblasts. Cell stem cell. 2013;13:205-18
52. Grover A, Sanjuan-Pla A, Thongjuea S, Carrelha J, Giustacchini A, Gambardella A. et al. Single-cell RNA sequencing reveals molecular and functional platelet bias of aged haematopoietic stem cells. Nature communications. 2016;7:11075
53. Young K, Eudy E, Bell R, Loberg MA, Stearns T, Sharma D. et al. Decline in IGF1 in the bone marrow microenvironment initiates hematopoietic stem cell aging. Cell stem cell. 2021;28:1473-82.e7
54. Rossi DJ, Bryder D, Seita J, Nussenzweig A, Hoeijmakers J, Weissman IL. Deficiencies in DNA damage repair limit the function of haematopoietic stem cells with age. Nature. 2007;447:725-9
55. Seita J, Weissman IL. Hematopoietic stem cell: self-renewal versus differentiation. WIREs Systems Biology and Medicine. 2010;2:640-53
56. Wilkinson AC, Igarashi KJ, Nakauchi H. Haematopoietic stem cell self-renewal in vivo and ex vivo. Nature Reviews Genetics. 2020;21:541-54
57. Chen C, Liu Y, Liu Y, Zheng P. mTOR Regulation and Therapeutic Rejuvenation of Aging Hematopoietic Stem Cells. Science Signaling. 2009 2
58. Doulatov S, Vo LT, Chou SS, Kim PG, Arora N, Li H. et al. Induction of multipotential hematopoietic progenitors from human pluripotent stem cells via respecification of lineage-restricted precursors. Cell stem cell. 2013;13:459-70
59. Kallen J, Schlaeppi J-M, Bitsch F, Delhon I, Fournier B. Crystal Structure of the Human RORα Ligand Binding Domain in Complex with Cholesterol Sulfate at 2.2 Å. Journal of Biological Chemistry. 2004;279:14033-8
60. Kallen JA, Schlaeppi J-M, Bitsch F, Geisse S, Geiser M, Delhon I. et al. X-ray structure of the hRORalpha LBD at 1.63 A: structural and functional data that cholesterol or a cholesterol derivative is the natural ligand of RORalpha. Structure. 2002;10:1697-707
61. Xiong G, Xu R. RORalpha binds to E2F1 to inhibit cell proliferation and regulate mammary gland branching morphogenesis. Molecular and cellular biology. 2014;34:3066-75
62. Jiang YJ, Kim P, Elias PM, Feingold KR. LXR and PPAR activators stimulate cholesterol sulfotransferase type 2 isoform 1b in human keratinocytes. J Lipid Res. 2005;46:2657-66
63. Bai Q, Zhang X, Xu L, Kakiyama G, Heuman D, Sanyal A. et al. Oxysterol sulfation by cytosolic sulfotransferase suppresses liver X receptor/sterol regulatory element binding protein-1c signaling pathway and reduces serum and hepatic lipids in mouse models of nonalcoholic fatty liver disease. Metabolism. 2012;61:836-45
64. Yvan-Charvet L, Pagler T, Gautier EL, Avagyan S, Siry RL, Han S. et al. ATP-binding cassette transporters and HDL suppress hematopoietic stem cell proliferation. Science. 2010;328:1689-93
65. Chin RM, Fu X, Pai MY, Vergnes L, Hwang H, Deng G. et al. The metabolite alpha-ketoglutarate extends lifespan by inhibiting ATP synthase and TOR. Nature. 2014;510:397-401
Author contact
![]() Corresponding author: Yiguo Hu (Email: huyiguoedu.cn).
Corresponding author: Yiguo Hu (Email: huyiguoedu.cn).