Impact Factor
- Issue 14; 2026
- Issue 13; 2026
- Issue 12; 2026
- Issue 11; 2026
- Issue 10; 2026
- Volume 16; 2026
- Advance Articles
- Past Issues
- Cover Images
- Cover Suggestion
- Index & Coverage
- Special Issues
Introduction
Methods
Results
Discussion and Conclusion
Supplementary Material
Acknowledgements
References
International Journal of Biological Sciences
International Journal of Medical Sciences
 Global reach, higher impact

Theranostics 2026; 16(10):5589-5608. doi:10.7150/thno.124748 This issue Cite
Research Paper
Macrophage membrane-biomimetic cinnamaldehyde nanomedicine ameliorates inflammatory bowel disease by suppressing macrophage M1 polarization
Zebin Huang1,2*, Lingna Xie1*, Qi Shu1, Yongyu Xu1, Xiao-Chun Guo1, Shimin Wang1, Shuyi Li1, Yaoxun Zeng1, Xiu-Cai Chen1, Mingtao Huang2, Fujun Jin1 ![]() , Yu-Jing Lu1
, Yu-Jing Lu1 ![]()
1. School of Biomedical and Pharmaceutical Sciences, Guangdong University of Technology, Guangzhou, China.
2. School of Food Science and Engineering, South China University of Technology, Guangzhou, China.
*These authors made equal contribution to this work.
Received 2025-9-5; Accepted 2026-3-14; Published 2026-3-25
Abstract

Rationale: Inflammatory bowel disease (IBD), known for its complexity and frequent relapses, urgently demands novel therapeutics due to the limited efficacy of current treatments. Cinnamaldehyde (CMA), a bioactive compound derived from Cinnamomum cassia Presl, has exhibited therapeutic potential for IBD. However, the therapeutic mechanism of CMA remains incompletely elucidated, and clinical translation is hampered by its poor oral pharmacokinetics.
Methods: Using RAW 264.7 cells stimulated with either LPS or IL-4, we evaluated the effects of CMA on macrophage polarization. Subsequently, the impact of CMA on glucose metabolism in M1 macrophages was analyzed. RNA sequencing identified the signaling pathways through which CMA inhibits M1 macrophage polarization, and this was further validated through genetic or pharmacological blockade. To overcome the pharmacokinetic challenges of CMA, macrophage membrane-biomimetic CMA-loaded nanoparticles (MM@CMANP) were designed, and their pharmacokinetics and targeting to intestinal inflammation sites were evaluated. Finally, the efficacy of MM@CMANP was assessed in DSS-induced IBD mice.
Results: CMA suppresses M1 macrophage polarization in vitro. Notably, CMA disrupted M1 macrophage glucose metabolic reprogramming, characterized by glycolysis suppression and enhanced oxidative phosphorylation. RNA sequencing demonstrated a clear association with mitophagy pathway following CMA treatment, and mechanistic studies verified that CMA promotes BCL2/adenovirus E1B 19 kDa-interacting protein 3 (BNIP3)-mediated mitophagy activation. Crucially, CMA-induced inhibition of M1 macrophages was mitigated by BNIP3 knockdown or autophagy inhibitors. MM@CMANP enhanced CMA accumulation in inflamed colonic tissues. In IBD mice, MM@CMANP significantly alleviated epithelial barrier disruption and mucosal inflammation. Consistent with in vitro findings, CMA modulated macrophage polarization and autophagy in vivo.
Conclusions: These results establish mitophagy as a central mechanism underlying anti-IBD effects of CMA and position MM@CMANP as a clinically translatable nanotherapeutic platform for IBD.
Keywords: cinnamaldehyde, macrophage polarization, mitophagy, IBD, macrophage membrane-biomimetic nanoplatform
Introduction
Inflammatory bowel disease (IBD) represents a persistent, immune-driven inflammatory state of the gut, typically characterized by diarrhea with blood, abdominal cramps, and loss of body mass [1]. By 2020, the global incidence of IBD had risen to approximately 6.8 million patients [2]. Intestinal mucosal inflammation is the hallmark pathological feature of IBD, and accumulating evidence implicates macrophage dysfunction as a central driver of intestinal barrier disruption [3, 4]. In IBD patients, disrupted M1/M2 polarization homeostasis drives over release of pro-inflammatory mediators, thereby exacerbating Th1/Th17-driven immune responses and compromising epithelial barrier integrity [5-7]. Therefore, the treatment strategies for IBD primarily focuses on suppressing the inflammatory response. However, the therapeutic efficacy of current drugs remains suboptimal, particularly for antibody-based therapies that exhibit non-responsiveness or resistance in subsets of patients [8]. Moreover, immunosuppressive therapies may increase the risks of infections and tumorigenesis [9]. These limitations underscore the necessity to pursue safer, more efficacious interventions for IBD.
Natural products are increasingly viewed as attractive sources of new therapeutics, given their pleiotropic pharmacological actions and generally favorable safety profiles [10]. Cinnamomum cassia Presl, a traditional Chinese herb with a long history in treating gastrointestinal disorders, has demonstrated efficacy in modern clinical and preclinical studies for alleviating diarrhea and IBD symptoms [11-13]. China is the world's largest producer of Cinnamomum cassia Presl, with Guangdong Province accounting for over 40% of the nation's production. Cinnamaldehyde (CMA), the predominant constituent (more than 80%) of Cinnamomum cassia Presl essential oil, shows pleiotropic pharmacological effects, including antimicrobial, anti-inflammatory, anticancer potential, antidiabetic, and cardioprotective effects [14, 15]. Several researches have revealed the potential of CMA in alleviating IBD symptoms in mice, likely attributable to its anti-inflammatory and immunomodulatory properties [16, 17]. However, the mechanism by which CMA improves IBD pathology is not yet fully understood. Furthermore, the clinical translation of CMA is limited by a triad of physicochemical factors: its poor solubility in water, its inherent instability, and its insufficient bioavailability [18]. Therefore, advanced delivery systems are necessary to enhance CMA's therapeutic performance.
Recently, the emergence of cell membrane biomimetic nanotechnology has provided new avenues for drug delivery, particularly for targeting tumors and central nervous system [19, 20]. This innovative approach involves engineering nanoparticles (NP) coated with natural cell membranes, which endow these carriers with unique biofunctional properties such as immune escape, extended half-life in the bloodstream, and inherent tropism for specific tissues [21, 22]. Noteworthily, macrophage membrane (MM)-derived coatings have become an attractive approach due to their potential to home to inflammatory sites and interact with microenvironmental cytokines [23]. Such biomimetic nanoparticles have proven effective in enhancing targeted delivery and therapeutic outcomes of bioactive compounds in inflammatory disease models [24-26]. Thus, this technology represents a viable means of surmounting the obstacles posed by CMA in IBD treatment.
Here, BNIP3-mediated mitophagy was identified as a key mechanism by which CMA suppresses M1 polarization, based on our investigation into its effects on macrophage phenotypes. Elucidating this mechanism provides key insights into how CMA inhibits inflammatory responses at the molecular level. Considering the limitations of CMA in terms of oral pharmacokinetics, we designed macrophage membrane-biomimetic CMA-loaded nanoparticles (MM@CMANP) and administered them intravenously, thereby bypassing first-pass metabolism associated with oral delivery. This biomimetic delivery system significantly enhanced targeting efficiency to inflamed colonic tissues and therapeutic efficacy of CMA, offering a novel and potent strategy for IBD.
Methods
Cell culture
RAW 264.7 macrophages were procured from the Wuhan Pricella Biotechnology Co., Ltd. (Procell, Cat. CL-0190). The cells were grown in Dulbecco's Modified Eagle Medium containing 10 % fetal bovine serum (FBS, ExCell Bio, Cat. FSP500), 100 U/L penicillin and 100 mg/L streptomycin. Cells were maintained at 37°C under 5% CO2 with humidity control.
Macrophage polarization and CMA treatment
RAW 264.7 cells were driven toward either an M1 or M2 phenotype states using a slightly modified previous reported methods [27]. Specifically, RAW 264.7 macrophages were seeded (5×10⁵ cells/mL) and cultured for 24 hours. Subsequently, after 1-h pretreatment with CMA (20 μM) or control medium, RAW 264.7 macrophages were exposed to lipopolysaccharide (LPS, Merck, Cat. L2630) at 1 μg/mL for M1 polarization, or with 20 ng/mL of interleukin-4 (IL-4, Novoprotein, Shanghai, China; Cat. CK15) for M2 polarization. After 24 h, the effects of CMA on RAW 264.7 macrophages were examined.
Quantitative real-time PCR (qPCR)
Total RNA was prepared using TRIzon Reagent (CWBIO, China; Cat. CW0580S) according to the supplier's guidelines. Subsequently, one microgram of total RNA was reverse-transcribed to generate cDNA. The qPCR was performed with the 2×SYBR Green qPCR Mix Kit (Shandong Sparkjade Biotechnology Co., Ltd., Cat. AH0101) and gene-specific primers (sequences listed in Table S1). Relative mRNA abundance for each target was calculated and expressed relative to β-actin.
Flow cytometry analysis of macrophage polarization markers
RAW 264.7 macrophages were collected and reconstituted in phosphate-buffered saline (PBS). Then, the Fc receptors were blocked by treating with CD16/32 antibody (Elabscience Biotechnology Co., Ltd., Cat. E-AB-F0997A) for 10 min. For polarization analysis, M1 macrophages were stained with fluorescein isothiocyanate (FITC)-conjugated CD80 antibody (Proteintech, Cat. FITC-65076), while M2 macrophages were labeled with FITC-conjugated CD206 antibody (Elabscience, Cat. E-AB-F1135C). Antibody labeling was conducted under light-protected conditions for 30 min. A BD FACSCelesta flow cytometer was employed for the analysis.
Nitric oxide (NO) assay
Nitrite concentrations were analyzed using the Griess method, involving the combination of 50 μL of supernatant with equal volumes of Griess reagents I and II (Beyotime, Cat. S0021). The absorbance was recorded at 540 nm, and data were normalized to LPS group.
Macrophage migration assay
RAW 264.7 macrophages were cultured until reaching 90-95% confluency. After a linear scratch was introduced into the cell monolayer, the cells were treated with CMA in 1% FBS-containing medium, followed by exposed to LPS (1 μg/mL). Scratch images were acquired after wounding (0 h) and again at 24 h under a microscope. Cell motility was quantified in ImageJ by calculating migration based on the remaining gap width (residual scratch width).
Analysis of glucose consumption and lactate production
Supernatants were collected from M1-polarized macrophages treated with or without CMA after 24 h of culture. Glucose consumption was assayed with the Beyotime kit (Cat. S0201) following the recommended procedure. Briefly, 5 μL of supernatant was combined with 185 μL of reaction solution and subjected to 95°C heating, and subsequently measured at 630 nm. Glucose levels were calculated against a standard curve.
Lactate was determined by the CheKine™ Micro Lactate Assay Kit (Abbkine, Cat. KTB1100). Supernatant samples (50 μL) were added into 50 μL lactate detection working solution for 30 min, and subsequently measured at 450 nm. The calculation of lactate concentrations was performed by reference to a standard curve.
Enzymatic activity assays of HK, PK, LDH and PDH
Hexokinase (HK) Activity Assay Kit (Cat. BC0740), Pyruvate Kinase (PK) Activity Assay Kit (Cat. BC0540), Lactate Dehydrogenase (LDH) Activity Assay Kit (Cat. BC0680) and Pyruvate Dehydrogenase (PDH) Activity Assay Kit (Cat. BC0380) were supplied by Beijing Solarbio Science & Technology Co., Ltd. (Beijing, China). Briefly, cells were lysed using extraction buffer. Cell lysates were then homogenized by sonication under the following conditions: 3-second pulses at 200 W with 10-second intervals, repeated for 30 cycles on ice. After centrifugation of the samples, the supernatants were collected and mixed with kit-specific reaction reagents and heated at 37°C for the manufacturer-specified durations. Optical density (OD) was monitored using a UV-Vis spectrophotometer (PerkinElmer, MA, USA) at 340 nm (HK and PK), 450 nm (LDH), and 605 nm (PDH). Lysate protein levels were determined with a BCA Protein Assay Kit (Beyotime, Cat. P0012), and enzyme activities were calculated on a per-protein basis and reported as fold differences compared with the control groups.
Measurement of intracellular ATP levels
Cellular ATP concentrations were quantified by an ATP Detection Assay Kit (Beyotime, Cat. S0026). Briefly, each well received 100 μL of ATP assay working solution, followed by a 10-min dark incubation. Chemiluminescence was determined with a multimode microplate reader (Thermo Fisher Scientific). Luminescence values were expressed as relative ATP levels (%) compared to untreated controls.
Seahorse analysis
RAW 264.7 macrophages were washed and incubated in Seahorse XF assay medium at 37°C in a non-CO₂ incubator for 1 h before measurements. For the mitochondrial stress test, assay medium was fortified with glucose (10 mM), L-glutamine (2 mM), and sodium pyruvate (1 mM). Oxygen consumption rate (OCR) measurements were obtained under basal conditions and following stepwise compound delivery: oligomycin (1 μM), FCCP (1.5 μM), and rotenone/antimycin A (1 μM). Seahorse Wave software was used to extract respiratory indices, including basal and maximal respiration, proton leak, and ATP-linked respiration. For the glycolysis stress assay, cells were incubated in assay medium fortified with L-glutamine (2 mM). Extracellular acidification rate (ECAR) was monitored before and after application of glucose (10 mM), oligomycin (1 μM), and 2-deoxyglucose (2-DG, 50 mM), from which glycolysis and glycolytic capacity were detected.
siRNA transfection
BNIP3 was knocked down in RAW 264.7 macrophages using small interfering RNAs (siRNAs). Two independent siRNAs targeting mouse Bnip3 were used: siRNA1 (sense 5'-GCACAGCUACUCUCAGCAUTT-3') and siRNA2 (sense 5'-GGACGAAGUAGCUCCAAGATT-3'). Cells were transfected with siRNAs using Lipofectamine 3000 (Thermo Fisher Scientific) as recommended by the manufacturer. Validation of knockdown efficiency was carried out by immunoblotting. After transfection, cells were permitted to recover before CMA pretreatment (20 μM, 1 h) and subsequent LPS treatment (1 μg/mL, 24 h).
Mitochondrial staining and determination of mitophagy flux
Mitochondrial staining was performed using Mito-Tracker Green (MTG; Beyotime, Cat. C1996). Cells were seeded in confocal dish (NEST Biotechnology, Jiangsu, China) and incubated with the dye (200 nM) for 30 min. Fluorescence imaging was conducted using LSM800 microscope (Carl Zeiss, BW, Germany) with excitation/emission wavelengths set to 488/530 nm. Mitochondrial fluorescence intensity corresponding to individual cells was quantified using ImageJ.
Mitophagic flux was assessed using a previously described method [28]. Briefly, cells were treated with or without the bafilomycin A1 (Baf A1, 200 nM) prior to mitochondrial staining. Mitophagic flux was calculated by dividing the Mito-Tracker Green fluorescence intensity in Baf A1-treated cells by that in untreated cells, measured via flow cytometry.
Mitochondrial membrane potential (MMP) assays
The JC-1 probe (Beyotime, Cat. C2006) was used to determine MMP. Briefly, a 20-min incubation of cells with freshly prepared JC-1 working solution was performed. Fluorescence signals were detected using an EVOS FL automated imaging system and a multimode microplate reader (Thermo Fisher Scientific). JC-1 monomers were detected at excitation/emission wavelengths of 490/530 nm, while aggregates were detected at 525/590 nm. Fluorescence ratios (aggregate/monomer) were calculated to quantify relative MMP.
Western blot
Total proteins were harvested by RIPA lysis buffer fortified with protease inhibitor cocktail (AbMole, USA; Cat. M5293) on ice for 30 min. Protein samples (equal amounts) were mixed with 5× loading buffer, subjected to 99°C for 10 min for denaturation, and resolved by SDS-PAGE. Following electrophoresis, proteins were wet-transferred onto PVDF membranes (Millipore, MA, USA) using a Bio-Rad transfer apparatus (CA, USA). Membranes were subjected to blocking in 5% nonfat milk for 2 h and subsequently cultured with the indicated primary antibodies and HRP-labeled secondary antibodies. Immunoreactive bands were visualized using ECL substrate (Millipore, Cat. WBKLS0500). The following primary antibodies were used: LAMP1(Servicebio, Cat. GB112949), Parkin (Servicebio, Cat. GB113802), LC3B (Proteintech, Cat. 14600-1-AP), BNIP3 (Proteintech, Cat. 68091-1-lg), PINK1 (BIOSS, Cat. bsm-51265m), TOMM20 (CUSABIO, Cat. CSB-PA618983ESR2HU, https://www.cusabio.com/), β-actin (Servicebio, Cat. GB11001), GAPDH (Servicebio, Cat. GB12002).
Co-localization analysis of mitochondria and lysosomes
Mitochondria and lysosomes were labeled using MTG and LysoTracker Red (LTR; Beyotime, Cat. C1046), respectively. Cells were incubated with MTG (200 nM) for 30 min, followed by LTR (50 nM) for 20 min. Using excitation/emission wavelengths of 577/590 nm, LTR fluorescence was visualized with an LSM800 microscope (Carl Zeiss). Pearson's correlation and overlap coefficient were calculated to quantify the spatial overlap between mitochondria and lysosomes using ImageJ, reflecting the extent of mitophagy.
Transmission electron microscopy (TEM) assay
Following fixation with 1% osmium tetroxide for 1.5 h, the cells were dehydrated by sequential immersion in graded ethanol (30%, 50%, 70%, 80%, and 95%). For contrast enhancement, ultrathin sections were stained with uranyl acetate for 10 min and subsequently with lead citrate for 10 min. Imaging was performed using a TEM (JEOL JEM-1400Plus, JEOL, Japan) operated at 80 kV.
Preparation of macrophage membrane-biomimetic nanoparticles
Macrophage membranes were isolated from RAW 264.7 cells using a differential centrifugation protocol [29]. Briefly, cells were transferred into TM buffer (10 mM Tris-HCl, 1 mM MgCl2, pH 7.4) and maintained on ice for 20 min. Cell lysis was achieved by homogenizing the suspension with a glass Dounce homogenizer on ice. Nuclei and unbroken cells were pelleted by centrifuging the lysate at 2500 rpm (4°C, 10 min) after adjusting its sucrose concentration to 0.25 M with 1 M sucrose-TM buffer. The supernatant was collected, homogenized again, and centrifuged under the same conditions. The resulting supernatant was further centrifuged at 12000 rpm (4°C, 30 min) to pellet membrane fractions. The membrane pellet was washed with 0.25 M sucrose-TM buffer and centrifuged at 12000 rpm (4°C, 20 min). Extrusion of purified membranes was performed 10 times through a polycarbonate membrane (400 nm pore size; Whatman, MA, USA) using a mini-extruder (Avanti Polar Lipids, USA) to ensure uniformity. Total membrane yield was estimated based on protein content.
MM@CMANP or MM-biomimetic rhodamine B-loaded NP (MM@RBNP) were prepared using a liposome extruder. Briefly, Macrophage membranes and CMANP were combined in equal masses. The mixture was processed with a probe sonicator at 120 W for 3 min, followed by sequential extrusion through a polycarbonate membrane (200 nm pore size) using a mini-extruder for 10 passes. Filtration of the MM@CMANP suspension through a 0.22 μm sterile syringe filter was performed, and the product was refrigerated at 4°C until needed. Protein profiles of macrophage membranes were verified via SDS-PAGE and coomassie brilliant blue staining. Markers of macrophage membrane including CD11b (zenbio, R380675), TNFR2 (zenbio, R300343), and CCR2 (zenbio, R380703), were detected by western blot.
In vitro release assay of drugs
A dialysis setup was employed to determine the in vitro release behavior of the nanomedicine formulations. Briefly, the nanomedicines solution was loaded into a dialysis membrane (MWCO: 3500 Da) and submerged in 50 mL of PBS (pH 7.4). Sampling was performed at predetermined time points (0, 1, 2, 4, 8, 16, 24, 48, and 72 h) by removing 5 mL of supernatant and replacing it with fresh PBS. Throughout the experiment, the system was maintained at 37°C with continuous orbital agitation at 50 rpm. Drug concentration in collected samples was measured by UV-Vis spectrophotometry (PerkinElmer) at 289 nm.
Animal and treatment
Male C57BL/6 mice (8 weeks old) were obtained from the Guangdong Medical Laboratory Animal Center and acclimatized for 1 week prior to experiments. All in vivo protocols were reviewed and authorized by the Animal Ethics Committee of Guangdong University of Technology (GDUTX-S2023025). Administration of 3% dextran sulfate sodium (DSS; Yeasen, Shanghai, China; Cat. 60316ES60) in drinking water was used to induce the IBD model. As illustrated in Figure 7A, during DSS induction, treatment groups received 5-aminosalicylic acid (5-ASA; 100 mg/kg, oral gavage), CMANP or MM@CMANP (4 mg/kg, intravenous injection via the tail vein). Body weight, fecal consistency, and occult blood (Solarbio; Cat. BC8271) were monitored daily. At the experimental endpoint, mice were euthanized. Serum was separated from collected blood by centrifuging at 3,000 × g for 10 min. Serum levels of TNF-α (Neobioscience Technology Co, Ltd., Shenzhen, China; Cat. EMC102a.96), IL-6 (Jonlnbio, Shanghai, China; Cat. JL20268), IL-1β (Jonlnbio; Cat. JL18442), and IL-10 (Neobioscience Technology Co, Ltd.; Cat. EMC005.96) were detected using ELISA kits following the supplier's protocol. Colon tissues were excised and photographed. Subsequently, hematoxylin and eosin (HE) staining and Alcian blue-periodic acid Schiff's (AB-PAS) staining were performed for histopathological analysis.
In vivo biodistribution of nanomedicines
The biodistribution of RBNP or MM@RBNP was investigated in an IBD mouse model. On day 8, RBNPs or MM@RBNPs were administered via tail vein injection. Following euthanasia at 2 h after injection, the heart, lungs, kidneys, spleen, liver, and colon were collected from the mice. Ex vivo fluorescence images were captured with an animal in vivo imaging system (PerkinElmer IVIS Lumina Series III) at 546 nm excitation.
Immunohistochemistry (IHC) and immunohistofluorescence (IHF) assay
IHC and IHF assay were performed as previously described [30]. Briefly, tissue sections from the colon were exposed to 3% hydrogen peroxide for 25 min. Tissue sections were first permeabilized using 0.2% Triton X-100, followed by blocking with 3% bovine serum albumin (BSA). The sections were exposed to primary antibodies and maintained at 4°C overnight. After washing, sections were exposed to secondary antibodies for 50 min at ambient temperature. For IHC, 3,3′-diaminobenzidine (DAB) served as the chromogen, with hematoxylin providing nuclear counterstaining. For IHF, sections were counterstained with 4',6-diamidino-2-phenylindole (DAPI) to reveal nuclei. Imaging of sections was performed on a ZEISS Axio Scan.Z1 automated slide scanner with Zen Blue software. The following primary antibodies were used: Occludin (Servicebio; Cat. GB111401), CD80 (Proteintech; Cat. 14292-1-AP), CD206 (Servicebio; Cat. GB113497).
Colonic lamina propria macrophage isolation and flow cytometry
Colonic lamina propria cells were isolated from mouse colons by sequential EDTA/DTT stripping and enzymatic digestion. Briefly, colons were excised and then cut open along the longitudinal axis. After rinsing with ice-cold PBS, the tissues were minced. Tissues were incubated in HBSS containing 5 mM EDTA, 2 mM DTT, 10 mM HEPES, 1% penicillin-streptomycin, and 5% FBS with shaking (200 rpm) for 20 min. After washing, the remaining tissue was digested in RPMI-1640 containing collagenase IV (1.5 mg/mL) and DNase I (20 U/mL) (plus 1% penicillin-streptomycin and 5% FBS) at 200 rpm for 30 min. Cell suspensions were filtered through a 70-μm strainer and enriched by 40%/80% Percoll gradient centrifugation (600×g, 20 min). Collection, washing, and resuspension of cells from the interface were performed for subsequent staining.
For flow cytometry, cells were stained with APC-anti-F4/80 and PE-anti-CD11b to gate lamina propria macrophages (F4/80⁺CD11b⁺). Macrophage polarization was then assessed by staining with FITC-anti-CD80 (M1-like) and PE/Cy7-anti-CD206 (M2-like).
Statistical analysis
Statistical analyses were performed using GraphPad Prism 9.5 software (San Diego, CA, USA). All data were derived from at least three independent experimental replicates or three independent biological samples. Group differences were analyzed using Student's t-test, one-way analysis of variance (ANOVA), or two-way ANOVA, as appropriate.
Results
CMA suppresses M1 macrophages polarization and promotes macrophages M2 polarization
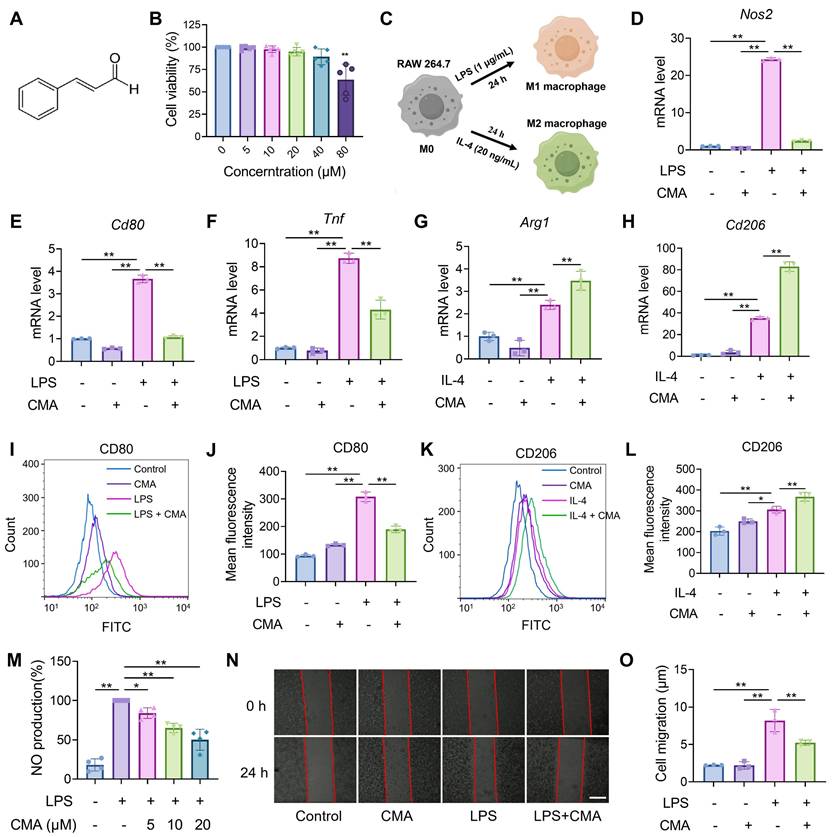
The progression of IBD is accompanied by abnormal macrophage polarization, and modulating macrophage polarization represents a viable approach for treating the disease [6]. Therefore, the effect of CMA on regulating the polarization of macrophages toward M1/M2 phenotypes was investigated in vitro. First, it was confirmed that the safe dose of CMA (Figure 1A) for RAW 264.7 macrophages was below 40 μM (Figure 1B), and a dose of 20 μM was selected for further investigation. Polarization of RAW 264.7 macrophages into M1 or M2 phenotypes was achieved by stimulation with LPS or IL-4, respectively (Figure 1C). CMA treatment significantly downregulated the mRNA levels of M1 macrophage markers, including Nos2, Cd80, and Tnf (Figure 1D-F), and inhibited the protein expression of CD80 (Figure 1I, J). In contrast, CMA significantly upregulated the mRNA levels of M2 macrophage markers, including Arg1 and Cd206 (Figure 1G, H), and increased the protein expression of CD206 (Figure 1K, L). To further investigated the inhibitory effect of CMA on M1 macrophages, NO production and cell migration in LPS-induced RAW 264.7 macrophages were assessed. Compared to the LPS-induced M1 macrophages, CMA treatment significantly decreased NO production (Figure 1M) and inhibited M1 macrophage migration (Figure 1N, O).
CMA skews macrophage polarization toward M2 while attenuating M1 differentiation. (A) Chemical structural formula of CMA. (B) RAW 264.7 cells were treated with CMA (0-80 μM) for 24 h, followed by incubated with MTT (0.5 mg/mL) for 4 h (n = 5). (C) Schematic illustration of macrophage polarization mediated by different inducers. (D-F) The mRNA levels of M1 markers (Nos2, Cd80, and Tnf) in RAW 264.7 macrophages pretreated with CMA (20 μM) for 1 h, followed by co-treatment with LPS (1 µg/mL) for 24 h (n = 3). (G, H) The mRNA levels of M2 markers (Arg1 and Cd206) in RAW 264.7 macrophages pretreated CMA (20 μM) for 1 h, followed by co-treatment with IL-4 (20 ng/mL) for 24 h (n = 3). (I, J) Flow cytometry analysis and quantification of CD80 protein levels in M1 macrophages treated with or without CMA (20 μM) for 24 h (n = 3). (K, L) Flow cytometry analysis and quantification of CD206 in M2 macrophages treated with or without CMA (20 μM) for 24 h (n = 3). (M-O) Effects of CMA treatment on NO levels (n = 4) and cell migration (n = 3) in RAW 264.7 macrophages. Scale bar: 100 μm. Data presented as mean ± SD, *P < 0.05, **P < 0.01.
CMA reprograms the metabolism profiles of M1 macrophages
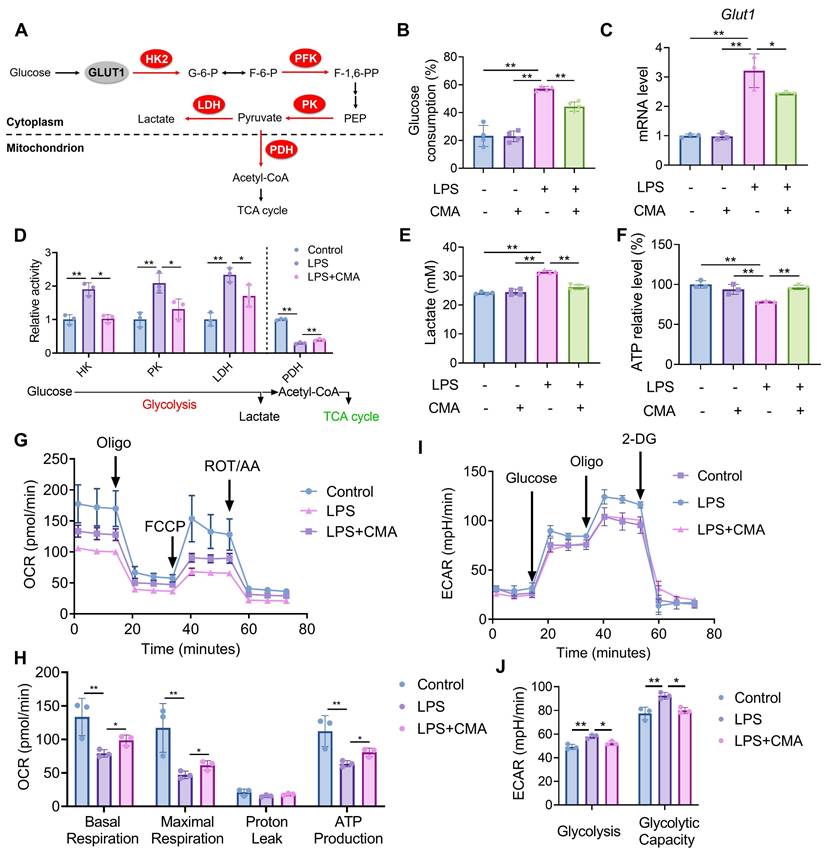
M1 macrophages exhibit a metabolic phenotype characterized by enhanced aerobic glycolysis and reduced oxidative phosphorylation [31]. To evaluate whether CMA modulates the metabolic profiles of M1 macrophages, changes in glucose consumption was assessed first. Compared to M0 macrophages, M1 macrophages demonstrated increased glucose demand, which was significantly reduced upon CMA treatment (Figure 2B). Given the crucial role of the glucose transporter GLUT1 in glucose uptake by M1 macrophages [32], we investigated whether CMA reduces glucose uptake by inhibiting GLUT1. As shown in Figure 2C, CMA treatment decreased GLUT1 mRNA expression in M1 macrophages. The activity of key enzymes mediating glycolysis and mitochondrial oxidative phosphorylation (Figure 2A) was further evaluated. It was observed that Upon LPS challenge, macrophages exhibited upregulated glycolysis, as evidenced by increased HK, PK, and LDH activities. Conversely, the activity of PDH, a key regulator of the TCA cycle, was diminished. CMA treatment significantly revised the activity of these enzymes in M1 macrophages (Figure 2D). CMA treatment also improved the increased lactate production and decreased ATP levels in M1 macrophages (Figure 2E, F). We further performed Seahorse extracellular flux analysis to visualize metabolic reprogramming in real time. In the mitochondrial stress test, LPS markedly reduced OCR throughout the assay, accompanied by significant decreases in basal respiration, maximal respiration, and ATP-linked respiration compared with the control group, whereas CMA treatment partially restored these mitochondrial respiratory parameters (Figure 2G, H). In parallel, glycolysis stress testing showed that LPS elevated ECAR after glucose/oligomycin injection (increased glycolysis and glycolytic capacity), and these glycolytic responses were significantly attenuated by CMA (Figure 2I, J). Collectively, these findings suggest that CMA reverses the metabolic reprogramming of M1 macrophages by inhibiting their metabolic profiles.
CMA reprograms the metabolic profiles of M1 macrophages. RAW 264.7 macrophages were pretreated with CMA (20 μM) for 1 h, followed by co-treatment with LPS (1 µg/mL) for 24 h. (A) Schematic representation of the glucose metabolism pathway. (B) Glucose consumption was measured by analyzing glucose levels in the supernatant of RAW 264.7 macrophages (n = 4). (C) The mRNA level of Glut1 in RAW 264.7 macrophages (n = 3). (D) Enzymatic activities of HK, PK, LDH, and PDH in RAW 264.7 macrophages (n = 3). (E, F) Lactate production in the supernatants (n = 4) and intracellular ATP levels (n = 3) of RAW 264.7 macrophages. (G, H) OCR traces and quantification of mitochondrial respiration parameters in the Seahorse mitochondrial stress test (n = 3). (I, J) ECAR traces and quantification of glycolysis and glycolytic capacity in the Seahorse glycolysis stress test (n = 3). Data presented as mean ± SD, *P < 0.05, **P < 0.01.
CMA improves mitochondrial homeostasis in M1 macrophages
To assess whether the altered metabolic profiles of mitochondria in M1 macrophages is associated with mitochondrial dysfunction, Mito-Tracker Green (MTG), a dye that does not depend on MMP, was used to stain with macrophages. Significant increase in mitochondrial content was found in M1 macrophages, which was reduced by CMA treatment (Figure 3A, B). A similar pattern was observed by detecting the mitochondrial marker TOMM20 (Figure 3C, D). We hypothesized that the increased mitochondrial content in M1 macrophages is due to the accumulation of dysfunctional mitochondria, accompanied by a loss of MMP. Figure 3E, F showed a significant decrease in the aggregates/monomer ratio in M1 macrophages compared to control cells, indicating loss of MMP. Notably, this depolarization was substantially attenuated by CMA administration. Excessive production of reactive oxygen species (ROS) has been shown to cause loss of MMP and mitochondrial dysfunction, which is essential for maintaining the pro-inflammatory state of M1 macrophages [33]. In M1 macrophages, both ROS (Figure S1A, C) and mitochondrial ROS (mtROS) (Figure 3G, H and Figure S1B, D) levels were significantly elevated, and these abnormalities improved after treatment CMA.
CMA improves mitochondrial homeostasis in M1 macrophages. Following a 1-h pretreatment with CMA (20 μM), RAW 264.7 macrophages were stimulated with LPS (1 µg/mL) for 24 h. (A, B) Representative images and relative quantification of mitochondria from MTG-labeled RAW 264.7 macrophages. Quantification was performed by counting mitochondrial fluorescence in all cells in four to eight random fields, respectively. Scale bar: 5 μm. (C, D) Representative immunoblot bands and quantification of the mitochondrial marker TOMM20 in RAW 264.7 macrophages (n = 5). (E, F) Fluorescence microscopy and fluorescence microplate reader analysis of JC-1-labeled MMP in RAW 264.7 macrophages. Scale bar: 100 μm. (G, H) Flow cytometry and quantification of MitoSOX Red-labeled mtROS in RAW 264.7 macrophages (n = 3). (I) Volcano plot shows DEGs in the LPS group vs LPS + CMA group. (J) GO enrichment analysis of upregulated DEGs in the LPS group vs LPS + CMA group. (K) GO enrichment analysis of downregulated DEGs in the LPS group vs LPS + CMA group. (L) Heat map of DEGs related to mitochondrial function, ROS detoxification, and oxidative stress pathways in control, LPS and LPS + CMA groups (n = 3). Data presented as mean ± SD, *P < 0.05, **P < 0.01.
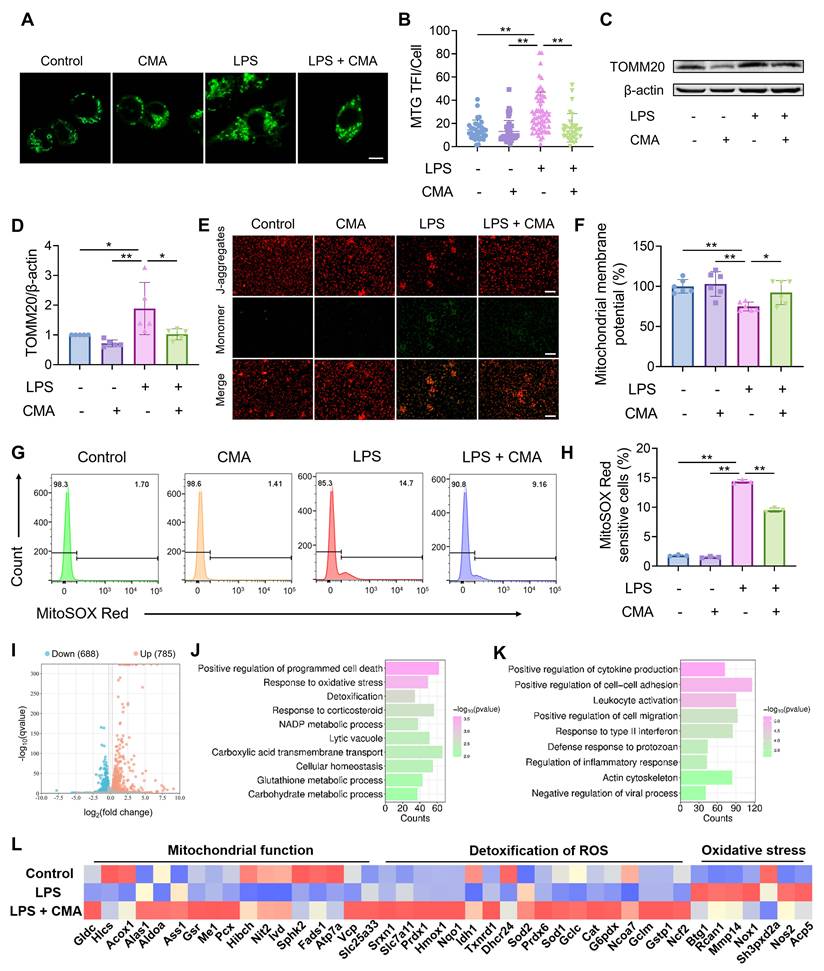
To further investigate the genes regulated by CMA in M1 macrophages, RNA sequencing analysis was performed. After CMA treatment, 785 genes were upregulated, and 688 genes were downregulated (Figure 3I). GO enrichment analysis was performed on these DEGs. The results showed that the upregulated DEGs were mainly involved in biological processes such as response to oxidative stress, detoxification, and NADP metabolic process (Figure 3J). The downregulated DEGs were mainly concentrated in pathways such as positive regulation of cytokine production, leukocyte activation, and regulation of inflammatory response (Figure 3K). Notably, genes related to mitochondrial function, such as those involved in oxidative phosphorylation (Atp7a, Vcp, Slc25a33, etc) and ROS detoxification (Prdx1, Txnrd1, Sod1, etc), were downregulated in M1 macrophages compared to M0 macrophages. In contrast, genes related to oxidative stress (Mmp14, Nox1, Nos2, etc) were upregulated. This dysregulation was ameliorated by CMA treatment (Figure 3L). Overall, these observations imply that CMA intervenes in mitochondrial metabolism by maintaining mitochondrial homeostasis, thereby suppressing M1 macrophage polarization.
CMA improves mitochondrial homeostasis of M1 macrophages via promoting BNIP3-mediated mitophagic flux
Mitophagy is a crucial process for cells to maintain mitochondrial homeostasis [34]. GSEA (Figure 4A) and KEGG pathway (Figure S2A) enrichment indicated that CMA modulates mitophagy in M1 macrophages. Therefore, we first measured the number of autophagosomes in M1 macrophages treated with CMA for different time points using MDC staining. After 2 hours of CMA treatment, the number of autophagosomes in M1 macrophages significantly increased, then gradually decreased (Figure S3A, B). During the formation of autophagosomes, the LC3-I protein undergoes ubiquitin-like modification and is converted to its autophagosomal membrane-bound form LC3-II. LAMP1, a key glycosylated protein involved in lysosome biogenesis, serves as an important marker of lysosomes. Time-dependent CMA treatment of M1 macrophages showed a significant increase in both autophagosome formation and lysosome biogenesis after 2 hours (Figure 4B-D). We further used MTG and LTR to label mitochondria and lysosomes, respectively, and assessed the extent of mitophagy by examining the co-localization between the two. Consistent with the previous results, at 2 hours post CMA treatment, the Pearson correlation and overlap coefficients between mitochondria and lysosomes were significantly higher in the CMA-treated group than in the M1 macrophages group, indicating that CMA enhanced mitophagy in M1 macrophages in a short time frame (Figure 4E-G). TEM was performed to directly observe changes in autophagosomes or autolysosomes. Compared to M0 macrophages, M1 macrophages exhibited the formation of vesicles with single or multi-layered membranes, some of which contained mitochondria, displaying typical features of mitophagy. In contrast, CMA-treated M1 macrophages produced more vesicles containing mitochondria (red arrows), indicating that CMA promotes mitophagy in M1 macrophages (Figure 4H). Furthermore, we confirmed that CMA increased mitophagic flux in M1 macrophages by using the lysosomal inhibitor Baf A1 (Figure 4I).
CMA improves mitochondrial homeostasis of M1 macrophages via promoting BNIP3-mediated mitophagic flux. (A) GSEA revealed significant enrichment of the pathway for positive regulation of mitophagy in response to mitochondrial depolarization in CMA-treated M1 macrophages. (B-D) Representative immunoblot bands and quantification of the lysosomal marker LAMP1 and the autophagosome marker LC3B in M1 macrophages treated with or without CMA for different time gradients (n = 3). (E-G) Representative images of MTG-labeled mitochondria and LTR-labeled lysosomes, and analysis of the degree of co-localization of these two organelles. The spatial association between mitochondria and lysosomes was assessed by quantifying four to seven randomly fields. Scale bar: 5 μm. (H) Representative TEM analysis in M1 macrophages treated with or without CMA (20 μM) for 2 h. (I) Flow cytometry and quantification of the mitophagy flux in M1 macrophages treated with or without CMA (20 μM) for 2 h. Mitophagy flux was defined as the inhibitory portion of Baf A1 by staining mitochondria using Mito-Tracker Deep Red FM (n = 3). (J) Representative immunoblot bands and quantification of BNIP3 in M1 macrophages treated with or without CMA for 2 h (n = 3). Data presented as mean ± SD, *P < 0.05, **P < 0.01.
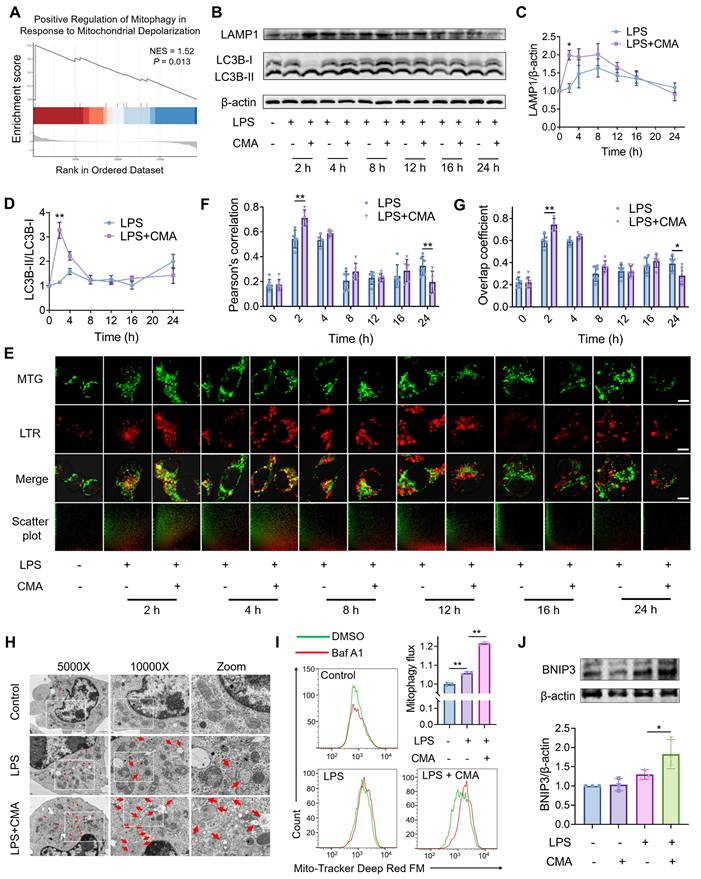
The regulation of mitophagy involves both ubiquitin-dependent and non-ubiquitin-dependent pathways, and the ubiquitin-dependent PTEN-induced putative kinase 1 (PINK1)/Parkin pathway is typically activated in response to mitochondrial damage [35]. However, CMA treatment did not affect the PINK1/Parkin pathway in M1 macrophages (Figure S3C-E). RNA sequencing revealed that CMA treatment upregulated Bnip3 gene expression in M1 macrophages (Figure S2B), a key autophagic receptor in the non-ubiquitin-dependent pathway. Additionally, CMA treatment increased the protein expression of BNIP3 in M1 macrophages (Figure 4J). All these results indicate that CMA improves mitochondrial homeostasis in M1 macrophages by promoting BNIP3-mediated mitophagy.
Genetic and pharmacological blockade of mitophagy reverses the inhibitory effect of CMA on M1 macrophage phenotype
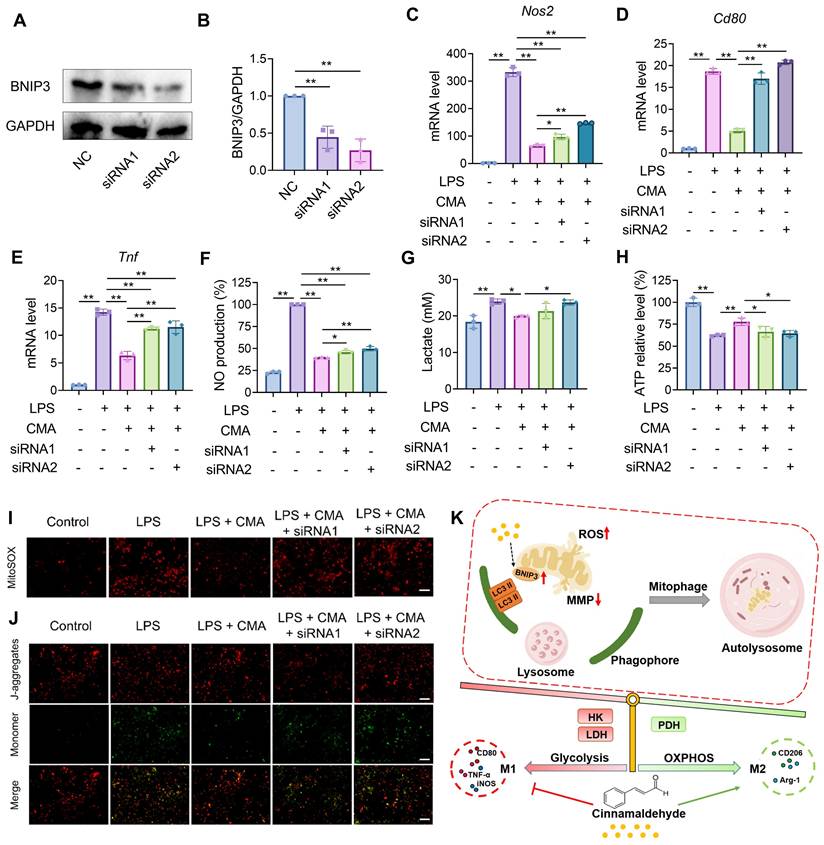
To validate the requirement of mitophagy in CMA-mediated suppression of M1 polarization, we blocked lysosome-dependent autophagy flux using chloroquine (CQ; TargetMol, USA) or Baf A1 (MeilunBio, China), and genetically depleted the mitophagy receptor BNIP3 using two independent siRNAs (siRNA1 and siRNA 2). BNIP3 knockdown efficiency was confirmed by immunoblotting (Figure 5A, B). In LPS-stimulated RAW 264.7 macrophages, CMA markedly reduced Nos2, Cd80 and Tnf expression as well as NO production. However, CQ or Baf A1 treatment and BNIP3 knockdown significantly attenuated these inhibitory effects (Figure 5C-F; Figure S4A-D). Consistently, CMA decreased lactate accumulation and restored intracellular ATP, but these metabolic benefits were blunted by CQ/Baf A1 and by BNIP3 knockdown (Figure 5G, H; Figure S4 E, F). At the mitochondrial level, CMA alleviated LPS-induced mitochondrial stress by improving MMP and reducing mtROS. Both pharmacological inhibition of autophagy flux and BNIP3 depletion partially abolished these improvements (Figure 5I, J; Figure S4G-J). The concordant pharmacological and genetic evidence demonstrates that CMA restores mitochondrial homeostasis and metabolic profiles in macrophages by promoting BNIP3-mediated mitophagy, thereby inhibiting macrophages from tilting to M1 phenotype (Figure 5K).
Knockdown of BNIP3 reverses the suppressive effect of CMA on M1 markers and mitochondrial dysfunction. A 1-h pretreatment with CMA (20 μM) was performed on RAW 264.7 macrophages, followed by 24-h exposure to LPS (1 µg/mL). (A, B) The efficiency of BNIP3 knockdown in RAW 264.7 cells (n = 3). (C-E) The mRNA level of Nos2, Cd80, and Tnf in RAW 264.7 macrophages (n = 3). (F, G) NO levels and lactate production in the supernatants of RAW 264.7 macrophages (n = 3). (H) Intracellular ATP levels of RAW 264.7 macrophages (n = 3). (I, J) Representative fluorescence images and quantitative analysis of mtROS detected by MitoSOX in RAW 264.7 macrophages. Scale bar: 100 μm. (K) Mechanism of action of CMA. CMA promotes BNIP3-mediated mitophagy to eliminate damaged mitochondria, thereby shifting macrophage energy metabolism toward oxidative phosphorylation and inhibiting macrophage polarization to the M1 phenotype. Data presented as mean ± SD, *P < 0.05, **P < 0.01.
Design of macrophage membrane (MM) biomimetic nano-delivery system for CMA
Although CMA has great potential in regulating macrophage polarization, its application in vivo is challenged by poor water solubility, low stability, and low oral bioavailability. Given the homing effect of macrophages to sites of inflammation, macrophage membrane-coated nanoparticles may target and accumulate at these sites. Specifically, chemokine receptors located on the macrophage membrane facilitate the recruitment of macrophage membrane-biomimetic nanoparticles to inflammatory lesions. Therefore, macrophage membrane-coated CMA-loaded nanoparticles (MM@CMANP) were designed. First, nanoprecipitation was employed to obtain CMA-loaded poly(lactic-co-glycolic acid) (PLGA) nanoparticles (CMANP). Dynamic light scattering (DLS) measurements showed that CMANP had an effective particle size of 129.7 nm, a polydispersity index (PDI) of 0.078 (Figure S5A), and a zeta potential of -14.68 mV (Figure S5B). It is generally accepted that a PDI of <0.3 indicates a relatively uniform particle size distribution [36]. Additionally, the encapsulation and drug loading efficiencies of CMANP were 61.46% and 8.91%, respectively (Figure S5C). Stability testing showed that CMANP maintained its effective particle size and zeta potential over 28 days (Figure S5D, E), confirming the successful preparation of CMANP. MM@CMANP showed no appreciable change in hydrodynamic size over 3 days of incubation in mouse serum, indicating good serum stability under physiologically relevant conditions (Figure S5H).
To synthesize MM@CMANP, macrophage membranes were coated onto CMANP by an extrusion method (Figure 6A). The effective particle size of MM@CMANP was 18 nm larger than that of CMANP (Figure 6B), and the PDI and zeta potential were intermediate between CMANP and the macrophage membrane (Figure 6C, D). TEM showed that MM@CMANP had an additional membrane coating (red arrows), forming a core-shell structure, compared to CMANP (Figure 6E). Notably, the particle size observed by TEM represents the dry diameter, whereas DLS measures the hydrodynamic diameter in solution; therefore, DLS values are typically larger due to hydration and the soft membrane/protein layer. These data provide evidence for the successful integration of the macrophage membrane onto the CMANP surface. Additionally, SDS-PAGE and western blot analyses showed that the protein profile of MM@CMANP closely resembled that of the macrophage membrane (Figure S5F), and that CD11b, TNFR, and CCR2 were detectable on MM@CMANP (Figure 6F), indicating that the macrophage membrane antigens were preserved during the preparation process. The in vitro release kinetics of CMANP and MM@CMANP were subsequently tested. Even with the macrophage membrane coating, the release kinetics of MM@CMANP were similar to those of CMANP (Figure S5G).
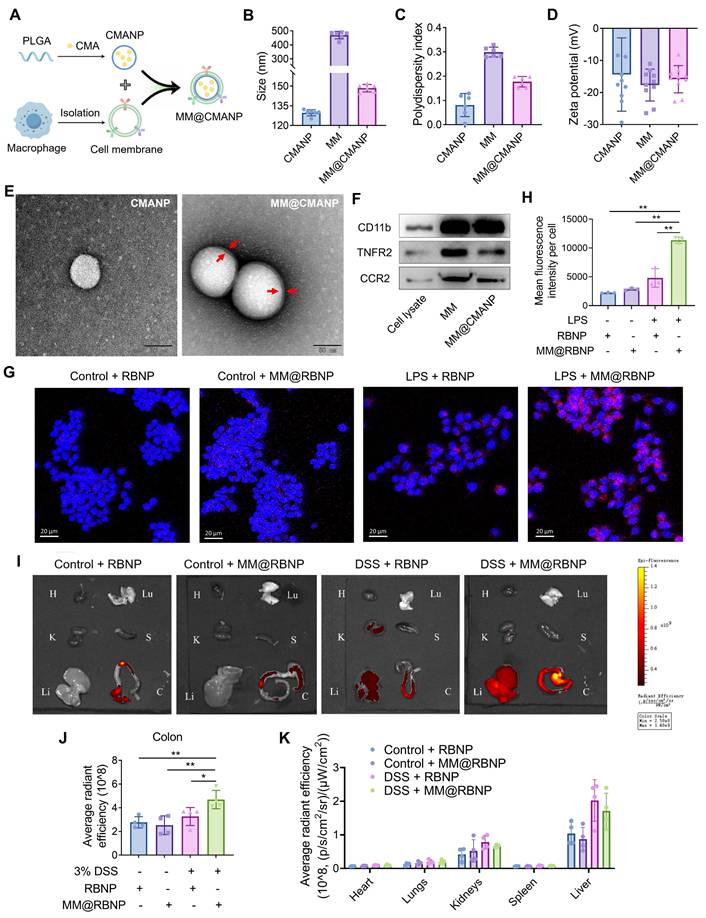
Preparation, characterization and biodistribution of macrophage membrane biomimetic nanoparticles. (A) Schematic illustration of the preparation of MM@CMANP. (B-D) Size, PDI and zeta potential of CMANP, MM and MM@CMANP analyzed by DLS, respectively. (E) TEM analysis of CMANP and MM@CMANP. Scale bar: 50 nm. (F) Western blot analysis of macrophage membrane proteins (CD11b, TNFR and CCR2) in RAW 264.7 cell lysate, MM, and MM@CMANP. (G, H) In vitro targeting was assessed by examining the internalization of MM@CMANP by RAW 264.7 cells. (I-K) In vivo targeting, biodistribution and quantification of RBNP and MM@RBNP in the colon and major organs of normal and IBD mice at 2 h post-intravenous administration. H, Lu, K, S, Li, C represent the heart, lung, kidney, spleen, liver and colon, respectively (n = 4). Data presented as mean ± SD, *P < 0.05, **P < 0.01.
In vitro and in vivo inflammation targeting, biodistribution and mechanistic validation of macrophage membrane biomimetic nanoparticles
To evaluate whether macrophage membrane camouflage enhances inflammation targeting, rhodamine B-loaded PLGA nanoparticles (RBNP) or macrophage membrane-coated RBNP (MM@RBNP) were incubated with resting or LPS-stimulated RAW 264.7 macrophages. MM@RBNP exhibited markedly higher intracellular accumulation than uncoated RBNP in LPS-activated macrophages, indicating improved targeting efficiency toward inflamed macrophages (Figure 6G, H). Because inflammatory microenvironments are characterized by elevated chemokine gradients, leukocyte cell membrane-coated nanoparticles may inherit chemokine receptor-ligand interactions and migrate toward inflammatory lesions via the chemokine-chemokine receptor axis [37]. Notably, CCL2-mediated recruitment has also been reported to promote the accumulation of macrophage membrane-camouflaged nanoparticles [38]. Based on this rationale, we hypothesized that CCR2 retained on MM@RBNP contributes to its enhanced uptake in LPS-activated macrophages and therefore performed CCR2 knockdown-based validation. We established RAW 264.7 cells with stable CCR2 knockdown using two independent constructs (CCR2 KD1 and KD2), and knockdown efficiency was confirmed by western blotting (Figure S6A, B). Membranes derived from CCR2-knockdown macrophages were then used to coat RBNP, generating CCR2-deficient MM@RBNP. Compared with MM@RBNP prepared from native control membranes, CCR2-deficient MM@RBNP showed substantially reduced cellular accumulation in LPS-stimulated RAW 264.7 macrophages (Figure S6C, D). Collectively, these results demonstrate that macrophage membrane coating confers inflammation-targeting capability and that CCR2 on the membrane contributes significantly to MM@RBNP enrichment in activated macrophages, providing a mechanistic basis for the enhanced colonic accumulation observed in vivo.
For assessment of the targeting efficiency of macrophage membrane-coated nanoparticles to the site of colitis lesions, RBNP and MM@RBNP were administered in DSS-induced IBD mice via tail vein injection, and their accumulation in different organs was assessed. As shown in Figure 6H and 6I, MM@RBNP accumulation in the colon was 1.4 folds higher than that of RBNP, indicating that macrophage membrane-coated PLGA nanoparticles have enhanced targeting efficiency to colitis lesions. In addition, compared with the control group, the cumulative amounts of RBNP and MM@RBNP in the livers of DSS group mice were higher (Figure 6H, J), which may be due to DSS also induce inflammation in the liver [39]. We further evaluated time-dependent biodistribution of RB-loaded nanoparticles in DSS-induced colitis mice. Ex vivo fluorescence imaging of major organs and colon collected at 1, 2, 4, 8 and 12 h displayed a steady elevation of fluorescence in the inflamed colon, reaching a maximum at ~8 h and remaining detectable at 12 h (Figure S7A). Quantitative analysis further indicated that colonic fluorescence of MM@RBNP was consistently higher than that of uncoated RBNP across the tested time points (Figure S7B), supporting that macrophage membrane coating enhances inflammation-associated enrichment. Organ distribution analysis at 8 h suggested that off-target signals were mainly observed in the liver and kidneys, while signals in the heart, lungs and spleen were minimal (Figure S7C).
In parallel, the pharmacokinetics of CMA delivered by MM@CMANP were assessed by measuring plasma CMA concentrations over time. The concentration-time profile displayed rapid systemic exposure followed by a slower elimination phase (Figure S7D). Non-compartmental analysis yielded a Tmax of 0.05 h, Cmax of 113.98 ± 32.1 ng/mL, and an apparent t1/2 of 5.72 ± 1.22 h, with an AUC0-∞ of 264.92 ± 41.73 ng·h/mL (Figure S7E). Notably, the apparent half-life of CMA after MM@CMANP administration was longer than the reported metabolic half-life of free CMA in rats (~1.7 h), suggesting that nanoformulation can prolong systemic exposure [40].
MM@CMANP ameliorates colonic barrier damage in IBD mice
For assessment of the therapeutic effect of CMA-loaded nanoparticles, a DSS-induced IBD mouse model was established (Figure 7A). Five-ASA was used as a positive control. After DSS treatment, the mice experienced a 18.5% weight loss by day 7. Treatment with 5-ASA, CMANP, or MM@CMANP significantly alleviated weight loss in IBD mice, and MM@CMANP exhibited a superior effect compared to the other groups (Figure 7B). Additionally, DSS-treated mice showed elevated DAI and shortened colon length. Similarly, MM@CMANP notably improved the DAI and colon length in IBD mice, outperforming both 5-ASA and CMANP (Figure 7C-E).
MM@CMANP mitigates DSS-induced IBD in mice. (A) Schematic diagram of the construction of a mouse IBD model and its treatment with 5-ASA or nanomedicines. (B) Weight change in IBD mice after treatment with 5-ASA, CMANP, or MM@CMANP (n = 5). (C) DAI of mice assessed by a composite score of the degree of weight loss, stool characters, and hematochezia (n = 5). (D, E) Comparison and statistical analysis of colon length from different treatment groups in IBD mice (n = 5). (F, I) Representative HE stained pathological sections and histological scores of IBD mice treated with different nanomedicines (n = 5). Scale bar: 100 μm. (G, J) Representative AB-PAS staining images and counts of acidic and neutral mucus produced by goblet cells in colonic tissue (n = 5). Scale bar: 50 μm. Yellow dashed outlines mark the crypt structures, white double-headed arrows indicate muscle layer thickness, blue arrows highlight inflammatory cell infiltration in H&E sections, red arrows indicate goblet cells in AB-PAS staining, and green arrows denote occludin-positive staining (brown) in the immunohistochemistry images. (H, K) Representative immunohistochemical staining images and relative quantitative analysis of occludin in colon tissues (n = 5). Scale bar: 50 μm. Data presented as mean ± SD, *P < 0.05, **P < 0.01.
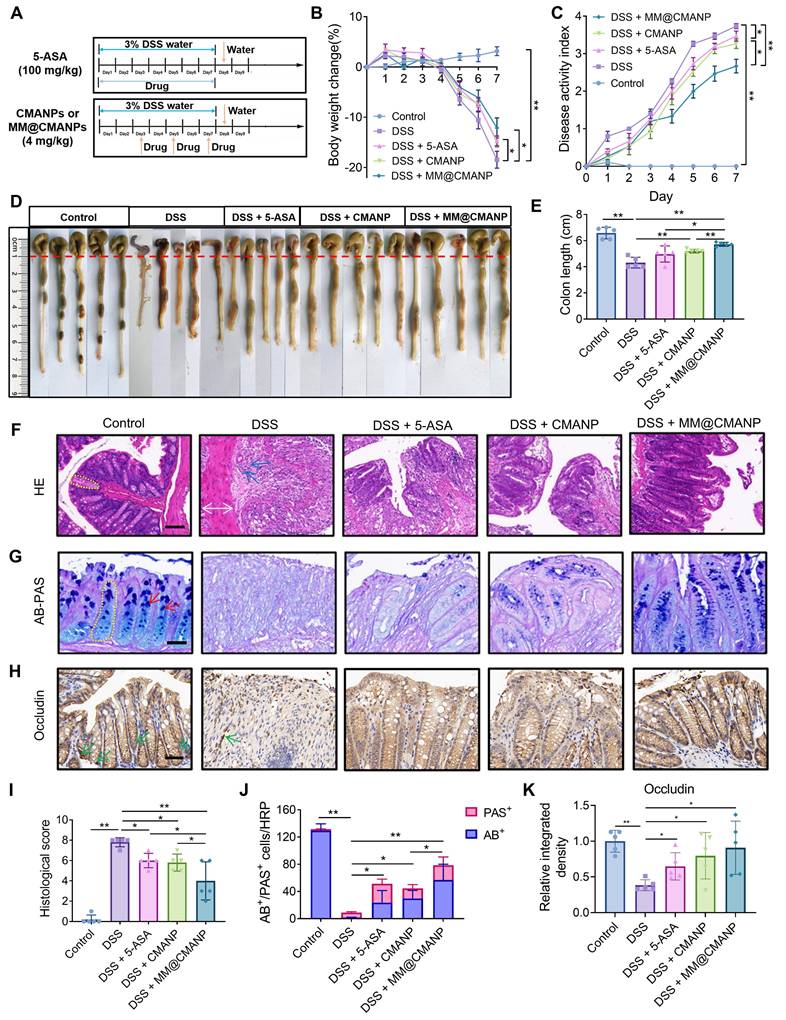
For evaluation of the pathological changes in the colonic tissue of the mice, HE staining was performed. DSS treatment resulted in disruption of the colonic mucosal barrier in mice, accompanied by loss of crypt structure, thickening of the mucosal muscle layer, and infiltration of inflammatory cells (Figure 7F). The treatment groups improved colonic barrier damage in IBD mice to varying degrees, with MM@CMANP showing the most pronounced effect (Figure 7I). Further evaluation of the changes in goblet cells in the colonic mucosal barrier was conducted through AB-PAS staining. AB/PAS double staining of control group sections demonstrated abundant goblet cells containing acidic (blue) and neutral (magenta) mucins [41]. DSS treatment led to a marked reduction in goblet cells in the colonic mucosal barrier, whereas MM@CMANP significantly increased the number of goblet cells, with effects more pronounced than those of 5-ASA and CMANP (Figure 7G, J). Similarly, as an important tight junction protein, occludin had the highest expression level in the MM@CMANP-treated group compared to other treatment groups (Figure 7H, K). Overall, owing to its efficient delivery to IBD lesions in murine models, MM@CMANP exhibited superior therapeutic effects compared to the other treatment groups.
MM@CMANP regulates macrophage polarization and promotes autophagy in IBD mice
To investigate whether CMA regulates macrophage polarization in vivo, we first measured serum levels of M1 macrophage-derived pro-inflammatory cytokines (TNF-α, IL-6, and IL-1β) and M2 macrophage-derived anti-inflammatory cytokine (IL-10) in mice. DSS administration triggered a marked elevation of pro-inflammatory cytokines (TNF-α, IL-6, IL-1β) as well as IL-10 in the serum, contrasting sharply with control values. Treatment with 5-ASA, CMANP, or MM@CMANP significantly reduced TNF-α, IL-6, and IL-1β levels (Figure 8A-C) while increasing IL-10 levels (Figure 8D), with MM@CMANP demonstrating superior effects compared to 5-ASA and CMANP. Immunohistochemistry was then performed to assess CD80 and CD206 expression in mouse colonic tissues. DSS-treated mice displayed elevated levels of both CD80 and CD206 compared to the control group, indicating the activation of both M1 and M2 macrophages during IBD progression, consistent with previous reports [42]. CMANP and MM@CMANP treatment suppressed CD80 expression while promoting CD206 expression (Figure 8E). Flow cytometry of colonic lamina propria cells showed that DSS markedly increased the proportion of CD80⁺ (M1-like) macrophages and decreased CD206⁺ (M2-like) macrophages within the F4/80⁺CD11b⁺ population, whereas MM@CMANP significantly reversed this polarization shift. Accordingly, MM@CMANP reduced the M1/M2 ratio compared with DSS and CMANP groups, in line with the immunohistochemistry observations (Figure 8F-J). These findings suggest that CMA-loaded nanoparticles mitigated M1 polarization and enhanced M2 polarization in IBD mouse colons. Owing to its targeted delivery, MM@CMANP displayed superior performance in this regard.
MM@CMANP modulates macrophages polarization and enhances autophagy in IBD mice. (A-D) Protein concentrations of TNF-α, IL-6, IL-1β and IL-10 in mouse serum were detected by ELISA assay (n = 5). (E) Representative immunohistochemical staining images of M1 marker CD80 and M2marker CD206 in mouse colon tissues. Scale bar: 50 μm. (F, G) Representative flow cytometry plots showing the frequencies of CD80+ (f) and CD206+ (g) cells gated on colonic lamina propria macrophages (F4/80+ and CD11b+) from Control, DSS, DSS + CMANP, and DSS + MM@CMANP mice. (H, I) Quantification of the percentages of CD80+ (h) and CD206+ (i) cells within F4/80+CD11b+ macrophages. (J) Relative M1/M2 ratio (or composition) calculated based on CD80+ and CD206+ macrophage populations (n = 3). (K, L) Representative immunofluorescence images and relative quantitative statistics of autophagosome marker LC3B in mouse colon tissues (n = 5). Scale bar: 50 μm. Data presented as mean ± SD, *P < 0.05, **P < 0.01.
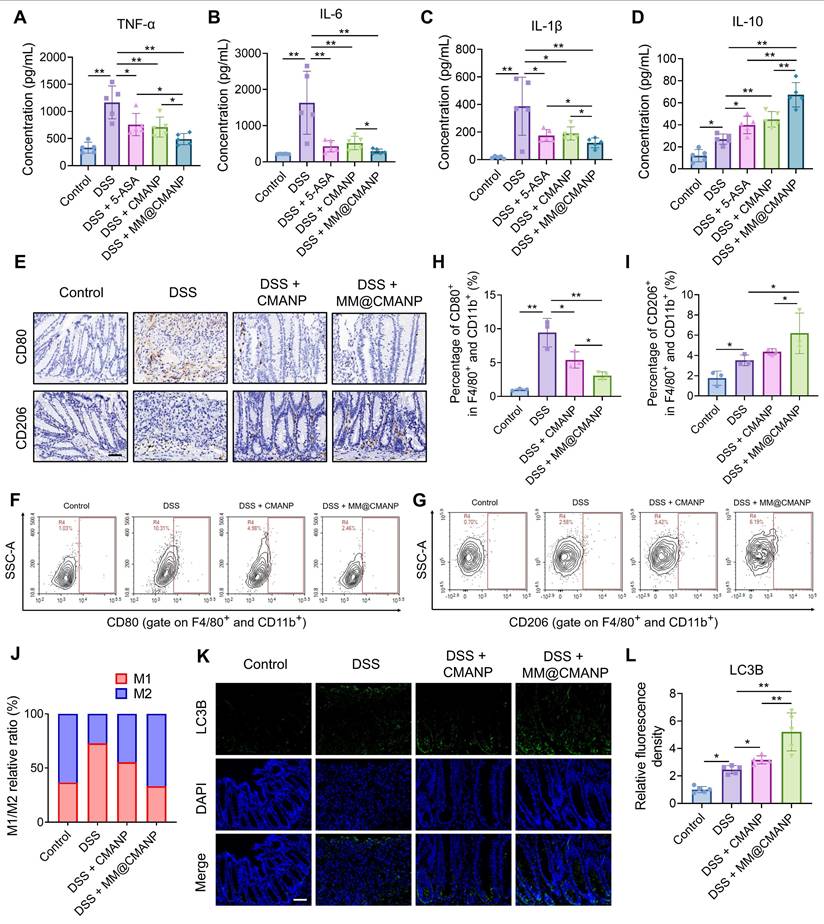
To investigate whether CMA-loaded nanoparticles enhance autophagy in vivo, we performed immunofluorescence staining of LC3B in mouse colonic tissues. DSS treatment increased LC3B expression in the colonic tissues compared to the control group, and treatment with CMANP or MM@CMANP further enhanced LC3B expression (Figure 8I, J), indicating that CMA promotes autophagy in IBD mice. In summary, consistent with in vitro findings, these observations reveal that MM@CMANP exerts protective effects in IBD mice by modulating macrophage polarization and enhancing autophagy.
Discussion and Conclusion
As a key component of the innate immune system, macrophage functions as a pivotal regulator in the pathogenesis of IBD. Rebalancing M1/M2 macrophages offers a novel therapeutic avenue for inducing IBD remission [6, 43]. Certain anti-inflammatory agents, such as bardoxolone methyl and the IKK inhibitor TPCA-1, demonstrate dual regulatory effects by suppressing macrophage M1 and M2 polarization [44]. This concurrent inhibition may weaken their therapeutic efficacy in inflammation-associated diseases. Thus, identifying compounds that selectively inhibit M1 polarization while maintaining M2 functionality represent a valuable therapeutic strategy for IBD. In this study, we report that CMA orchestrates a phenotypic switch in macrophages, attenuating M1 and augmenting M2 polarization, thereby supporting its therapeutic utility in IBD.
Distinct metabolic profiles of M1 and M2 macrophages critically influence their polarization and function. IFN-γ/LPS-activated M1 macrophages exhibit a metabolic shift toward aerobic glycolysis, which supports rapid energy demands for pro-inflammatory and antimicrobial responses [31]. In contrast, IL-4/IL-13-activated M2 macrophages primarily rely on oxidative phosphorylation to meet energy requirements for synthesizing anti-inflammatory mediators and tissue remodeling [7]. While metabolic reprogramming during macrophage polarization was initially viewed as a passive adaptation to energy demands, emerging evidence suggests that modulating these metabolic pathways can actively reprogram macrophage phenotypes. A glycolytic bias drives M1 polarization, and pharmacological inhibition of glycolysis reverses this process [45]. Conversely, enhancing oxidative phosphorylation promotes M2 polarization [46]. Our results demonstrate that CMA suppresses the glycolysis in M1 macrophages while partially restoring oxidative phosphorylation. Notably, CMA also restricts glucose uptake by downregulating GLUT1. These observations align with the concept that metabolic reprogramming serves as a regulatory checkpoint for macrophage polarization.
Mitochondria, as central hubs regulating metabolic and inflammatory responses, are important for maintaining macrophage polarization. In M1 macrophages, enhanced aerobic glycolysis shifts mitochondrial function from ATP synthesis to mtROS production [47]. Excessive mtROS induce mitochondrial dysfunction and activate the NLRP3 inflammasome, further exacerbating the pro-inflammatory M1 state [33]. As a mitochondrial quality-control mechanism, mitophagy selectively clears dysfunctional mitochondria, while impaired mitophagy leads to dysfunctional mitochondrial accumulation, promoting the progression of inflammation [35, 48]. Here, CMA reduced mtROS levels, transiently enhanced lysosomal activity and mitophagy flux, and accelerated the removal of dysfunctional mitochondria. Mechanistically, CMA-induced mitophagy in M1 macrophages was mediated via the BNIP3 pathway, independent of the canonical PINK1-Parkin pathway. The reversal of CMA's anti-M1 effects by autophagy inhibitors (CQ and Baf A1) and BNIP3 knockdown further confirms the centrality of mitophagy in its mechanism.
In view of the suboptimal efficacy and adverse effects associated with current IBD therapies, developing safe and targeted delivery systems is imperative. In this study, the engineering of a macrophage membrane-coated nano-delivery system provides an effective means to surmount the pharmacokinetic limitations inherent to CMA. MM@CMANP achieves targeted delivery to inflamed colonic tissues by leveraging the inherent inflammation-homing capability of macrophage. In the current work, MM@CMANP was administered intravenously as a proof-of-concept to ensure reliable systemic exposure and to minimize variability associated with gastrointestinal transit and absorption. Compared with oral administration, intravenous injection bypasses potential barriers in the gastrointestinal tract, thereby facilitating a clearer evaluation of membrane-mediated targeting and colonic enrichment. Nevertheless, intravenous administration may be less practical for long-term use. Therefore, future studies will explore optimization of dosing regimens and alternative administration routes, together with comprehensive safety assessment under repeated dosing. In vivo, MM@CMANP outperformed both CMANP and 5-ASA, as evidenced by restored colon length, reduced disease activity index, and improved mucosal integrity. Accumulating research shows that M1 macrophage polarization drives the pathological progression of IBD. Clinically approved therapeutic drugs such as infliximab and adalimumab target TNF-α produced by M1 macrophages to mitigate IBD symptoms [49]. In contrast, M2 macrophages mediate tissue repair, contributing to the restoration of the mucosal barrier. Elevated M2 macrophage infiltration in the murine colon enhances resistance to DSS-induced IBD [50], while administration of in vitro-generated M2 macrophages into mice attenuates colitis [51]. Furthermore, knockdown of the M2-associated cytokine IL-10 exacerbates colitis development in murine models [52]. In this study, MM@CMANP suppressed M1 polarization, enhanced M2 polarization, and upregulated autophagy in IBD mice, indicating that CMA exerts analogous biological mechanisms in vivo. Despite the promising therapeutic outcomes of MM@CMANP, several limitations should be acknowledged. Although CMA-loaded PLGA nanoparticles (CMANP) were included as a formulation-matched control to isolate the incremental benefit of macrophage membrane camouflage, we did not evaluate a free (CMA-only) treatment group in vivo. Future studies will incorporate a rigorously validated free-CMA formulation to enable a more direct comparison and to further quantify the added value of nanoparticulate delivery.
In summary, this study establishes CMA as a regulator of macrophage polarization through BNIP3-mediated mitophagy, and demonstrates the therapeutic promise of macrophage membrane biomimetic nano-delivery system in IBD. Our findings provide a preclinical foundation for CMA-based therapies and introduce MM@CMANP as a novel strategy to enhance drug targeting and efficacy, offering new avenues for managing chronic inflammatory diseases.
Supplementary Material
Supplementary methods, figures and table.
Acknowledgements
This research was supported by grants from the National Natural Science Foundation of China (No. 82372448), the Guangdong Basic and Applied Basic Research Foundation (2024A1515010769), the Guangdong Basic and Applied Basic Research Foundation - Regional Joint Foundation (2022A15-15140033) and the Hong-Yan Plan of Meizhou (2024HY001TD001). The figures including graphical abstract, Figure 1C, Figure 5K, Figure 6A were drawn by Figdraw (www.figdraw.com). We would like to thank Scientific Compass (www.shiyanjia.com) for the TEM analysis.
Generative AI statement
During the preparation of this manuscript, DeepSeek V3.2 was employed solely for language refinement, with no involvement in generating scientific content. The authors take full responsibility for the content.
Author contributions
Zebin Huang: Investigation, Methodology, Formal analysis, Data curation, Visualization, Writing-original draft. Lingna Xie: Methodology, Investigation, Formal analysis, Software, Writing-original draft. Qi Shu: Investigation, Formal analysis Methodology. Yongyu Xu: Methodology, Investigation. Xiao-Chun Guo: Methodology, Investigation. Shimin Wang: Methodology, Investigation. Shuyi Li: Methodology, Investigation. Yaoxun Zeng: Investigation. Xiu-Cai Chen: Conceptualization. Mingtao Huang: Resources, Conceptualization. Fujun Jin: Writing-review & editing, Resources, Conceptualization. Yu-Jing Lu: Supervision, Resources, Conceptualization, Funding acquisition, Writing-review & editing.
Zebin Huang and Lingna Xie contributed equally to this work.
Competing Interests
The authors have declared that no competing interest exists.
References
1. Rudbaek JJ, Agrawal M, Torres J, Mehandru S, Colombel J-F, Jess T. Deciphering the different phases of preclinical inflammatory bowel disease. Nat Rev Gastroenterol Hepatol. 2024;21:86-100
2. Jairath V, Feagan BG. Global burden of inflammatory bowel disease. Lancet Gastroenterol Hepatol. 2020;5:2-3
3. Saez A, Herrero-Fernandez B, Gomez-Bris R, Sanchez-Martinez H, Gonzalez-Granado JMM. Pathophysiology of Inflammatory Bowel Disease: Innate Immune System. Int J Mol Sci. 2023;24:1526
4. Lai W, Xian C, Chen M, Luo D, Zheng J, Zhao S. et al. Single-cell and bulk transcriptomics reveals M2d macrophages as a potential therapeutic strategy for mucosal healing in ulcerative colitis. Int Immunopharmacol. 2023;121:110509
5. Hegarty LM, Jones G-R, Bain CC. Macrophages in intestinal homeostasis and inflammatory bowel disease. Nat Rev Gastroenterol Hepatol. 2023;20:538-553
6. Moreira Lopes TC, Mosser DM, Goncalves R. Macrophage polarization in intestinal inflammation and gut homeostasis. Inflamm Res. 2020;69:1163-1172
7. Pan X, Zhu Q, Pan L-L, Sun J. Macrophage immunometabolism in inflammatory bowel diseases: From pathogenesis to therapy. Pharmacol Ther. 2022;238:108176
8. Neurath MF. Strategies for targeting cytokines in inflammatory bowel disease. Nat Rev Immunol. 2024;24:559-576
9. Villablanca EJ, Selin K, Hedin CRH. Mechanisms of mucosal healing: treating inflammatory bowel disease without immunosuppression? Nat Rev Gastroenterol Hepatol. 2022;19:493-507
10. Liang Y, Liu Z-Y, Wang P-Y, Li Y-J, Wang R-R, Xie S-Y. Nanoplatform-based natural products co-delivery system to surmount cancer multidrug-resistant. J Control Release. 2021;336:396-409
11. Park S-y, Kim YD, Kim MS, Kim K-T, Kim JY. Cinnamon (Cinnamomum cassia) water extract improves diarrhea symptoms by changing the gut environment: a randomized controlled trial. Food Funct. 2023;14:1520-1529
12. Park Tg, Kim YR, Park S-y, Choi K, Kim KJ, Kim JY. Cinnamon (Cinnamomum cassia) hot water extract improves inflammation and tight junctions in the intestine in vitro and in vivo. Food Sci Biotechnol. 2023;32:1925-1933
13. Zobeiri M, Parvizi F, Shahpiri Z, Heydarpour F, Pourfarzam M, Memarzadeh MR. et al. Evaluation of the Effectiveness of Cinnamon Oil Soft Capsule in Patients with Functional Dyspepsia: A Randomized Double-Blind Placebo-Controlled Clinical Trial. Evid Based Complement Alternat Med. 2021;2021:6634115
14. Li C, Luo Y, Zhang W, Cai Q, Wu X, Tan Z. et al. A comparative study on chemical compositions and biological activities of four essential oils: Cymbopogon citratus (DC.) Stapf, Cinnamomum cassia (L.) Presl, Salvia japonica Thunb. and Rosa rugosa Thunb. J Ethnopharmacol. 2021;280:114472
15. Guo J, Yan S, Jiang X, Su Z, Zhang F, Xie J. et al. Advances in pharmacological effects and mechanism of action of cinnamaldehyde. Front Pharmacol. 2024;15:1365949
16. Qu S-l, Chen L, Wen X-s, Zuo J-p, Wang X-y, Lu Z-j. et al. Suppression of Th17 cell differentiation via sphingosine-1-phosphate receptor 2 by cinnamaldehyde can ameliorate ulcerative colitis. Biomed Pharmacother. 2021;134:111116
17. Tan X, Wen Y, Han Z, Su X, Peng J, Chen F. et al. Cinnamaldehyde Ameliorates Dextran Sulfate Sodium-Induced Colitis in Mice by Modulating TLR4/NF-κB Signaling Pathway and NLRP3 Inflammasome Activation. Chem Biodivers. 2023;20:e202200089
18. Han R, Li X, Gao X, Lv G. Cinnamaldehyde: Pharmacokinetics, anticancer properties and therapeutic potential (Review). Mol Med Rep. 2024;30:1-14
19. Xiao H, Raza F, Li K, Song J, Zafar H, Yang S. et al. Cell membrane derived biomimetic nanomedicine for precision delivery of traditional Chinese medicine in cancer therapy. J Control Release. 2025;383:113829
20. Wang H, Liu Y, He R, Xu D, Zang J, Weeranoppanant N. et al. Cell membrane biomimetic nanoparticles for inflammation and cancer targeting in drug delivery. Biomater Sci. 2020;8:552-568
21. Fang RH, Gao W, Zhang L. Targeting drugs to tumours using cell membrane-coated nanoparticles. Nat Rev Clin Oncol. 2023;20:33-48
22. Jin H, Luo R, Li J, Zhao H, Ouyang S, Yao Y. et al. Inhaled platelet vesicle-decoyed biomimetic nanoparticles attenuate inflammatory lung injury. Front Pharmacol. 2022;13:1050224
23. Qu Y, Chu B, Li J, Deng H, Niu T, Qian Z. Macrophage-Biomimetic Nanoplatform-Based Therapy for Inflammation-Associated Diseases. Small Methods. 2024;8:2301178
24. Zhao J, Ling L, Zhu W, Ying T, Yu T, Sun M. et al. M1/M2 re-polarization of kaempferol biomimetic NPs in anti-inflammatory therapy of atherosclerosis. J Control Release. 2023;353:1068-1083
25. Geng C, Ren X, Cao P, Chu X, Wei P, Liu Q. et al. Macrophage membrane-biomimetic nanoparticles target inflammatory microenvironment for epilepsy treatment. Theranostics. 2024;14:6652-6670
26. Zhou R, Xue S, Cheng Y, Chen Y, Wang Y, Xing J. et al. Macrophage membrane-camouflaged biomimetic nanoparticles for rheumatoid arthritis treatment via modulating macrophage polarization. J Nanobiotechnology. 2024;22:578
27. Jiao H, Tang P, Zhang Y. MAP Kinase Phosphatase 2 Regulates Macrophage-Adipocyte Interaction. Plos One. 2015;10:e0120755
28. Mauro-Lizcano M, Esteban-Martinez L, Seco E, Serrano-Puebla A, Garcia-Ledo L, Figueiredo-Pereira C. et al. New method to assess mitophagy flux by flow cytometry. Autophagy. 2015;11:833-843
29. Gao C, Huang Q, Liu C, Kwong CHT, Yue L, Wan J-B. et al. Treatment of atherosclerosis by macrophage-biomimetic nanoparticles via targeted pharmacotherapy and sequestration of proinflammatory cytokines. Nat Commun. 2020;11:2622
30. Huang Z, Yuan Y, Tan Z, Zheng J, Zhang W, Huang S. et al. Metabolomics in combination with network pharmacology reveals the potential anti-neuroinflammatory mechanism of essential oils from four Curcuma species. Ind Crops Prod. 2023;195:116411
31. Kolliniati O, Ieronymaki E, Vergadi E, Tsatsanis C. Metabolic Regulation of Macrophage Activation. J Innate Immun. 2022;14:51-67
32. Cho H, Kwon H-Y, Sharma A, Lee SH, Liu X, Miyamoto N. et al. Visualizing inflammation with an M1 macrophage selective probe via GLUT1 as the gating target. Nat Commun. 2022;13:5974
33. Marchi S, Guilbaud E, Tait SWG, Yamazaki T, Galluzzi L. Mitochondrial control of inflammation. Nat Rev Immunol. 2023;23:159-173
34. Mishra SR, Mahapatra KK, Behera BP, Patra S, Bhol CS, Panigrahi DP. et al. Mitochondrial dysfunction as a driver of NLRP3 inflammasome activation and its modulation through mitophagy for potential therapeutics. Int J Biochem Cell Biol. 2021;136:106013
35. Lu Y, Li Z, Zhang S, Zhang T, Liu Y, Zhang L. Cellular mitophagy: Mechanism, roles in diseases and small molecule pharmacological regulation. Theranostics. 2023;13:736-766
36. Liu M, Gao T, Jiang L, Li S, Shi B, Li F. Enhancing the biopharmaceutical attributes of atorvastatin calcium using polymeric and lipid-polymer hybrid nanoparticles: An approach for atherosclerosis treatment. Biomed Pharmacother. 2023;159:114261
37. Li J, Wei Y, Zhang C, Bi R, Qiu Y, Li Y. et al. Cell-membrane-coated nanoparticles for targeted drug delivery to the brain for the treatment of neurological diseases. Pharmaceutics. 2023;15:621
38. Zhao H, Li L, Zhang J, Zheng C, Ding K, Xiao H. et al. C-C chemokine ligand 2 (CCl2) recruits macrophage-membrane-camouflaged hollow bismuth selenide nanoparticles to facilitate photothermal sensitivity and inhibit lung metastasis of breast cancer. ACS Appl Mater Interfaces. 2018;10:31124-31135
39. Tsopmejio ISN, Yuan J, Diao Z, Fan W, Wei J, Zhao C. et al. Auricularia polytricha and Flammulina velutipes reduce liver injury in DSS-induced Inflammatory Bowel Disease by improving inflammation, oxidative stress, and apoptosis through the regulation of TLR4/NF-KB signaling pathways. J Nutr Biochem. 2023;111:109190
40. Zhao H, Xie Y, Yang Q, Cao Y, Tu H, Cao W. et al. Pharmacokinetic study of cinnamaldehyde in rats by GC-MS after oral and intravenous administration. J Pharm Biomed Anal. 2014;89:150-157
41. Osho SO, Wang T, Horn NL, Adeola O. Comparison of goblet cell staining methods in jejunal mucosa of turkey poults. Poult Sci. 2017;96:556-559
42. Deng L, Wang S, Zhang R, Huang J, Lin Y, Liu X. et al. Protective effects of (R)-enantiomers but not (S)-enantiomers of β2-adrenergic receptor agonists against acute colitis: The role of β2AR. Int Immunopharmacol. 2022;110:108997
43. Zhang C, Cao Z, Lei H, Chen C, Du R, Song Y. et al. Discovery of a novel small molecule with efficacy in protecting against inflammation in vitro and in vivo by enhancing macrophages activation. Biomed Pharmacother. 2023;165:115273
44. He L, Jhong J-H, Chen Q, Huang K-Y, Strittmatter K, Kreuzer J. et al. Global characterization of macrophage polarization mechanisms and identification of M2-type polarization inhibitors. Cell Rep. 2021;37:109955
45. Bohaud C, De La Cruz J, Terraza C, Barthelaix A, Laplace-Builhe B, Jorgensen C. et al. Lactate metabolism coordinates macrophage response and regeneration in zebrafish. Theranostics. 2022;12:3995-4009
46. Zhao S-J, Kong F-Q, Jie J, Li Q, Liu H, Xu A-D. et al. Macrophage MSR1 promotes BMSC osteogenic differentiation and M2-like polarization by activating PI3K/AKT/GSK3β/β-catenin pathway. Theranostics. 2020;10:17-35
47. Mills EL, Kelly B, Logan A, Costa ASH, Varma M, Bryant CE. et al. Succinate Dehydrogenase Supports Metabolic Repurposing of Mitochondria to Drive Inflammatory Macrophages. Cell. 2016;167:457-470
48. Liu H, Zhen C, Xie J, Luo Z, Zeng L, Zhao G. et al. TFAM is an autophagy receptor that limits inflammation by binding to cytoplasmic mitochondrial DNA. Nat Cell Biol. 2024;26:878-891
49. Gil-Candel M, Gascon-Canovas JJ, Urbieta-Sanz E, Rentero-Redondo L, Onteniente-Candela M, Iniesta-Navalon C. Comparison of drug survival between infliximab and adalimumab in inflammatory bowel disease. Int J Clin Pharm. 2020;42:500-507
50. Arranz A, Doxaki C, Vergadi E, de la Torre YM, Vaporidi K, Lagoudaki ED. et al. Akt1 and Akt2 protein kinases differentially contribute to macrophage polarization. Proc Natl Acad Sci U S A. 2012;109:9517-9522
51. Hunter MM, Wang A, Parhar KS, Johnston MJG, Van Rooijen N, Beck PL. et al. In Vitro-Derived Alternatively Activated Macrophages Reduce Colonic Inflammation in Mice. Gastroenterology. 2010;138:1395-1405
52. Dikiy S, Ghelani AP, Levine AG, Martis S, Giovanelli P, Wang Z-M. et al. Terminal differentiation and persistence of effector regulatory T cells essential for preventing intestinal inflammation. Nat Immunol. 2025;26:1-15
Author contact
![]() Corresponding authors: Email addresses: jinfujunedu.cn (Fujun Jin), luyjedu.cn (Yu-Jing Lu).
Corresponding authors: Email addresses: jinfujunedu.cn (Fujun Jin), luyjedu.cn (Yu-Jing Lu).