Impact Factor
- Issue 14; 2026
- Issue 13; 2026
- Issue 12; 2026
- Issue 11; 2026
- Issue 10; 2026
- Volume 16; 2026
- Advance Articles
- Past Issues
- Cover Images
- Cover Suggestion
- Index & Coverage
- Special Issues
Introduction
Methods
Results and Discussion
Conclusion
Abbreviations
Supplementary Material
Acknowledgements
References
International Journal of Biological Sciences
International Journal of Medical Sciences
 Global reach, higher impact

Theranostics 2026; 16(11):6145-6163. doi:10.7150/thno.129765 This issue Cite
Research Paper
Bioinspired Nanoplatform Potentiates Sonodynamic Immunotherapy by Remodeling the Antioxidant Tumor Microenvironment and Activating STING pathway
Yuanyuan Zhang1#, Wenxiang Zhu2#, Kaimin Li3#, Yun Xie1, Zhichao Deng4, Yuanyuan Zhu4, Bowen Gao4, Chenxi Xu4, Junlong Fu4, Mingzhen Zhang4 ![]() , Xiaoliang Zheng5
, Xiaoliang Zheng5 ![]() , Haifeng Zhang6,7
, Haifeng Zhang6,7 ![]()
1. The Clinical Laboratory, Northwest Women's and Children's Hospital, Xi'an, Shaanxi, 710061, China.
2. Nanozyme Laboratory in Zhongyuan, Henan Academy of Innovations in Medical Science, Zhengzhou, Henan, 451163, China.
3. School of Biological and Medical Engineering, Beijing University of Aeronautics and Astronautics, Beijing, 100191, China.
4. School of Basic Medical Sciences, Xi'an Jiaotong University, Xi'an, Shaanxi, 710061, China.
5. School of Laboratory Medicine and Bioengineering, Hangzhou Medical College, Hangzhou, Zhejiang, 310053, China.
6. Department of Pathology, School of Basic Medical Sciences, Xi'an Jiaotong University, Xi'an, Shaanxi, 710061, China.
7. Institute of Genetics and Developmental Biology, Translational Medicine Institute, Xi'an Jiaotong University, Xi'an, Shaanxi, 710061, China.
# These authors contributed equally to this work.
Received 2025-12-10; Accepted 2026-4-3; Published 2026-4-16
Abstract

Background: Sonodynamic therapy (SDT) has emerged as a promising modality for treating deep-seated tumors. It has been demonstrated that SDT effectively induces immunogenic cell death (ICD), thereby initiating a systemic anti-tumor immune response — a process known as sonodynamic immunotherapy. However, its efficacy is severely limited by the hypoxic tumor microenvironment (TME) and elevated glutathione (GSH) levels, which together scavenge reactive oxygen species (ROS) and create a potent antioxidant barrier.
Methods: Ultra-small Mn3O4 nanoparticles with multi-enzyme mimicking activity were synthesized, and co-encapsulated with the sound sensitizer Ag2S quantum dot (Ag2S QD) in cell membrane hybrid liposomes to construct a biomimetic nanoplatform (Mn3O4/QD@LM). The Catalase and glutathione peroxidase activities of Mn3O4/QD@LM were evaluated. Its antitumor efficacy in vitro was evaluated by measuring ROS levels, mitochondrial membrane potential staining, live/dead cell staining, and apoptosis analysis. By recording tumor growth and performing histological and immunohistochemical examinations, its antitumor effects in vivo were investigated in a mouse model of colon cancer. Flow cytometry analysis was used to analyze the tumor immune microenvironment.
Results: Mn3O4/QD@LM functioned as a “ROS amplifier” by exhibiting catalase-like and glutathione peroxidase-like activities, which alleviated tumor hypoxia and depleted GSH, thereby markedly enhancing SDT efficacy. Moreover, released Mn2+ ions generated highly cytotoxic hydroxyl radicals via a Fenton-like reaction, further augmenting tumor cell killing. In vitro experiments confirmed that Mn3O4/QD@LM effectively induced ICD and activated the STING pathway. Benefiting from homologous targeting, the nanoplatform achieved efficient accumulation in tumor tissue in vivo. Upon ultrasound activation, Mn3O4/QD@LM significantly inhibited tumor growth both in vitro and in vivo. Notably, it remodeled the tumor immune microenvironment by promoting CD8⁺ T cell infiltration, enhancing the secretion of IFN-γ and TNF-α, and reducing the populations of regulatory T cells and myeloid-derived suppressor cells.
Conclusions: Mn3O4/QD@LM confirms the synergistic role of multi-enzyme activities and STING pathway activation in potentiating sonodynamic immunotherapy, and provides an innovative strategy to overcome TME-mediated therapy resistance.
Keywords: Sonodynamic therapy, Immunotherapy, Mn3O4 nanoparticles, Ag2S quantum dots, colon cancer
Introduction
Sonodynamic therapy (SDT) is a non-invasive tumor treatment that uses ultrasound to activate sonosensitizers and generate reactive oxygen species (ROS) [1]. These ROS induce oxidative damage to tumor cellular components, ultimately leading to cell death [2]. Emerging evidence suggests that this cytotoxic effect can trigger immunogenic cell death (ICD). This process is characterized by the release of damage-associated molecular patterns (DAMPs), including calreticulin (CRT) and high-mobility group box 1 (HMGB1) protein, which bind to dendritic cells (DCs) receptors, promoting DCs maturation and antigen presentation. This cascade ultimately initiates an effective anti-tumor immune response [3, 4].
However, the efficacy of SDT and its immune effects are severely limited by the tumor antioxidant microenvironment (TME). One major limitation is the imbalance between oxygen supply and demand within tumor tissue. Over 50% of solid tumors contain severely hypoxic regions (partial oxygen pressure <10 mmHg) [5]. Hypoxia not only reduces the production of O2-dependent ROS but also promotes immunosuppression by upregulating immune checkpoints such as PD-L1 [6]. Another limiting factor is the antioxidant defense barrier established by tumor cells through the overexpression of glutathione (GSH). The thiol group in GSH can directly neutralize ROS and significantly reduce the oxidative damage efficiency of SDT [7, 8]. The interaction of hypoxia and antioxidant systems can also promote tumor metastasis, drug resistance, and immune evasion [9]. Furthermore, even if SDT successfully induces ICD, it often fails to fully stimulate DC maturation, limiting subsequent antigen presentation and T cell activation. Therefore, the key to improving the efficacy of sonodynamic immunotherapy is to simultaneously break the physicochemical barriers of the TME and enhance the immune activation effect of SDT.
Transition metal manganese has attracted much attention due to its multivalent state, adjustable redox activity, and good biocompatibility. Engineered manganese oxide nanoparticles (MnOx NPs) can modulate TME by altering redox states and promoting ROS production [10]. First, MnOx NPs exhibit catalase (CAT)-like activity in the weakly acidic TME, breaking down endogenous H2O2 into O2 [11]. Second, high-valence MnOx (e.g., Mn3+/Mn4+) can effectively consume GSH through redox reactions (i.e., glutathione peroxidase (GPx)-like activity), disrupting the antioxidant barrier of tumors [12]. Most importantly, the Mn2+ ions generated from these redox reactions can trigger Fenton-like reactions, converting the less cytotoxic H2O2 into highly oxidative hydroxyl radicals (∙OH) [13]. This generates a synergistic effect with the ROS produced by SDT, significantly elevating oxidative stress levels within tumor cells.
Beyond its role in redox modulation, Mn2+ acts as a key immunomodulator that can activate the stimulator of interferon genes (STING) signaling pathway [14]. STING activation promotes type I interferon secretion, DCs and macrophage maturation, and enhances CD8⁺ T cell priming and memory responses [15-19]. Therefore, combining SDT with the immunomodulatory effect of Mn2+ creates a dual synergy. On one hand, SDT induces ICD to initiate immune activation. On the other hand, Mn2+ activates the STING pathway to further boost immunity. This dual synergy can strongly amplify anti-tumor immune responses.
Mn3O4 nanoparticles (Mn3O4 NPs) are relatively small in size and have excellent enzyme catalytic activity [20, 21]. Therefore, we prioritized Mn3O4 NPs that are smaller in size and have stronger enzyme catalytic activity in the SDT process to achieve oxygen supply and GSH consumption. Meanwhile, sulfide quantum dots (Ag2S QDs) are emerging as potent sonosensitizers, characterized by their excellent biocompatibility, prolonged half-life in blood circulation, and NIR-II imaging performance [22, 23]. These characteristics establish Ag2S QDs as a valuable candidate with considerable potential for translational applications in SDT. Based on the above advantages, this study fabricated a multifunctional nanotherapeutic platform (Mn3O4/QD@LM). Using cancer membrane-hybridized liposomes as the carrier, the platform co-delivers Ag2S QDs as sonosensitizers and ultra-small Mn3O4 NPs. This system integrates homologous targeting, TME remodeling, and dual immune activation functions to achieve synergistic enhancement of SDT and anti-tumor immunity.
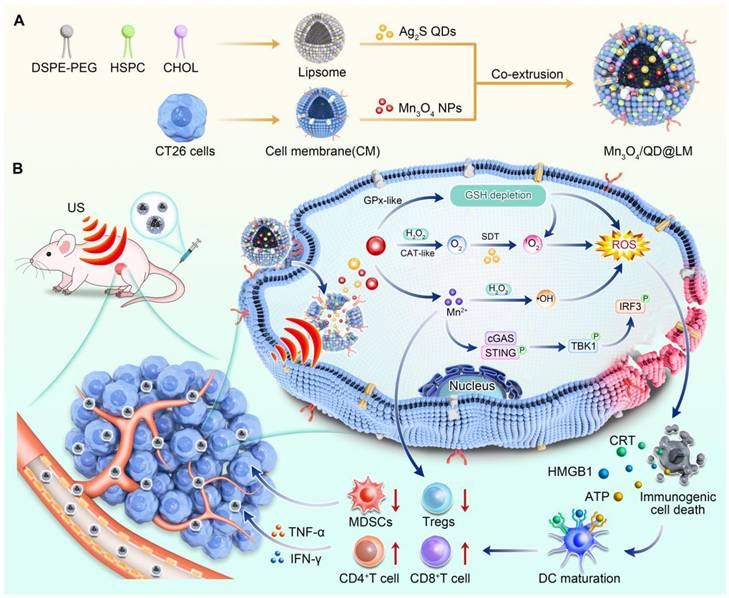
Specifically, cancer cell membranes confer homologous targeting capabilities on nanoplatforms, enabling their effective accumulation in tumor tissue. At the tumor site, Mn3O4 NPs break down endogenous H2O2 into O2 via CAT-like activity, effectively relieving tumor hypoxia. At the same time, Mn3O4 NPs deplete GSH through Gpx-like activity, breaking the antioxidant barrier. These effects create favorable conditions for Ag2S QDs to generate abundant ROS under ultrasound. Increased ROS production can induce stronger ICD, which can increase the release of DAMPs and TAAs. Concurrently, Mn2+ drives Fenton-like reactions and activates the STING pathway, promoting DC maturation and pro-inflammatory cytokine secretion. In a mouse CT26 tumor model, this system significantly increased tumor-infiltrating CD8⁺ T cells and cytokine levels (IFN-γ, TNF-α), while reducing immunosuppressive regulatory T cells (Tregs) and myeloid-derived suppressor cells (MDSCs) populations, effectively suppressing tumor growth (Figure 1).
Schematic diagram of Mn3O4/QD@LM potentiates sonodynamic immunotherapy by remodeling antioxidant tumor microenvironment and activating STING pathway. (A) The synthetic route of Mn3O4/QD@LM. (B) The mechanisms of sonodynamic immunotherapy mediated by Mn3O4/QD@LM. Following intravenous injection, Mn3O4/QD@LM targets the tumor through homologous cell membrane-mediated homing. In the tumor microenvironment, Mn3O4/QD@LM exhibits CAT-like and GPx-like activities, depleting GSH and generating ·OH. Upon exposure to US irradiation, Mn3O4/QD@LM induces immunogenic cell death. Furthermore, the released Mn²⁺ activates the cGAS-STING pathway. Consequently, Mn3O4/QD@LM significantly increased the number of CD8⁺ T cells and elevated the levels of cytokines such as IFN-γ and TNF-α, while reducing the infiltration of Tregs and MDSCs, leading to effective suppression of tumor growth.
In summary, the Mn3O4/QD@LM system constructed in this study possesses both multienzyme-mimetic activities and immunomodulatory functions. It not only overcomes the core bottlenecks of tumor hypoxia and antioxidant barriers in SDT, but also achieves dual synergy between ICD-mediated immune activation and Mn2+-triggered STING pathway activation. This strategy synchronously enhances the sonodynamic therapeutic effect and anti-tumor immune response. Thus, this work presents a novel strategy for enhancing the efficacy of sonodynamic immunotherapy in colon cancer.
Methods
Preparation of Ag2S QDs, Mn3O4 NPS, and Mn3O4/QD@LM
Ag2S QDs were synthesized according to our previous method [24]. Synthesis of ultrasmall Mn3O4 NPs was performed according to a literature method with modifications [20]. Specifically, 300 mg manganese (II) acetylacetonate and 9.63 mL oleamide were added to a 100 mL three-neck flask. The system was purged with N2 for 30 min to remove oxygen, followed by heating to 150 °C at 5 °C/min under N2 atmosphere and maintaining for 9 h. After natural cooling to room temperature, excess ethanol/cyclohexane (3:1 v/v) was added dropwise to wash the solution three times, removing unreacted precursors and surfactants. The precipitate was collected by high-speed centrifugation (12,000 rpm, 15 min). Finally, the obtained precipitate was re-dispersed in hexane for further use.
Synthesis of hybrid liposome Mn3O4/QD@LM: (1) Lipid film preparation: Hydrogenated soy phosphatidylcholine, cholesterol, and DSPE-PEG2000 (1:1:0.13 molar ratio) were dissolved in 3 mL dichloromethane. Then, 5 mg Ag2S QDs and 1 mg Mn3O4 nanoparticles were added. The solution underwent rotary evaporation at 50 °C to form a thin film. The flask was vacuum-dried for 12 h to remove residual solvents. (2) Membrane hybridization and hydration: The lipid film was mixed with pre-extracted CT26 cell membranes [4:1 (w/w)] in 4 mL PBS. Membrane fusion was facilitated by oscillatory hydration (300 rpm, 37 °C, 30 min). (3) The hydrated system was dispersed by probe sonication (ice bath, 2 min) and sequentially extruded 20 times through 400 nm and 200 nm polycarbonate membranes using an Avanti mini-extruder. Unencapsulated Ag2S QDs and Mn3O4 NPs were removed by centrifugation (3000 rpm, 10 min). The final product (Mn3O4/QD@LM) was stored at 4 °C under light-protected conditions. Mn3O4/QD@Lip was prepared identically except for the omission of CT26 cell membranes.
Determination of catalase-like activity of Mn3O4/QD@LM
The catalase-like activity of Mn3O4/QD@LM was detected through dissolved oxygen detection experiments and H2O2 consumption experiments.
(1) Dissolved oxygen detection assay. After calibrating the dissolved oxygen meter, the automatic recording mode was configured in the software with a recording interval of 1 min. Then, 10 mL of 1 mM H2O2 solution was measured and transferred into a clean scintillation vial. Different concentrations of Mn3O4/QD@LM were added to the vial, and continuous monitoring and data recording were initiated. The oxygen production from 1 mM H2O2 solution alone served as the control group. All experiments were repeated three times to guarantee the reliability of the data.
(2) H2O2 consumption assay. The solution of Mn3O4/QD@LM was serially diluted to target concentrations. Then, 1 mL of each diluted solution was mixed with 10 μM H2O2-specific fluorescent probe ROS GreenTM. Afterward, 10 μL of 10 mM H2O2 solution was added to each mixture and thoroughly mixed. The reaction tubes were incubated in the dark with shaking for 4 h. After incubation, 100 μL of reaction solution was taken from each sample, and the fluorescence intensity was measured using a multifunctional microplate reader (ex: 488 nm; em: 515 nm). All experiments were repeated three times to guarantee the reliability of the data.
Determination of glutathione peroxidase-like activity of Mn3O4/QD@LM
The glutathione peroxidase-like activity of Mn3O4/QD@LM was quantitatively analyzed using the DTNB colorimetric assay. DTNB specifically reacts with free thiol groups to produce a yellow-colored product, whose absorbance is directly proportional to the concentration of GSH. Different concentrations of Mn3O4/QD@LM were mixed with 200 μM GSH in a total volume of 1 mL. The mixtures were incubated in the dark at 37 °C with shaking for 3 h. After the reaction, the mixtures were centrifuged at 12000 g for 5 min to remove the nanoparticle precipitates. Upon collection, 800 μL of the supernatant was mixed with a DTNB solution (200 μM) and incubated at room temperature in the dark for 1 h. A 200 μL aliquot of the mixture was transferred to a 96-well plate, and its absorption spectrum was scanned from 400 to 600 nm using a UV-vis spectrophotometer. At the same time, the absorbance of the remaining solution was measured at a wavelength of 412 nm to calculate the remaining GSH content.
Evaluation of hydroxyl radical generation by Mn3O4/QD@LM
The ∙OH generation capability of Mn3O4/QD@LM was assessed using the methylene blue (MB) decolorization assay and electron spin resonance (ESR) spectroscopy.
(1) Methylene Blue decolorization assay. A reaction mixture containing 40 μg/mL Mn3O4/QD@LM nanoparticles and 4 mM GSH was prepared in water. The mixture was incubated in the dark at 37 °C with shaking for 1 h. After reaction, the solution was centrifuged at 12000 g for 5 min to completely remove unreacted nanoparticles. Then, 800 μL of the supernatant was mixed with the MB working solution (10 μg/mL) and H2O2 (8 mM). Control groups included MB alone and MB with H2O2. The final mixtures were incubated again at 37 °C in the dark for 1 h, after which the absorption spectra of MB were recorded over the 500-800 nm range using a UV-Vis spectrophotometer.
(2) ESR detection of ∙OH. Different concentration gradients of the nanoparticles were mixed with 4 mM GSH in a total volume of 1 mL, followed by incubation in the dark at 37 °C for 12 h. After reaction, the mixture was centrifuged at 2000 g for 15 min to remove unreacted nanoparticles. Then, 800 μL of the supernatant was combined with 10 μL of DMPO solution, and 10 μL of H2O2 was added to achieve a final concentration of 8 mM. The solution was vortexed thoroughly. Control groups included DMPO alone and DMPO with H2O2. All reaction systems were incubated in the dark at room temperature for 5 min, and then the DMPO-OH adduct signals were detected using an ESR spectrometer.
Evaluation of singlet oxygen generation by Mn3O4/QD@LM
The singlet oxygen (1O2) generation capacity of Mn3O4/QD@LM was evaluated using the singlet oxygen sensor green (SOSG) fluorescent probe and ESR spectroscopy.
(1) SOSG fluorescence probe detection of 1O2. 1 mL solution of Mn3O4/QD@LM (50 μg/mL) was mixed with 10 μL of SOSG stock solution (5 μM). The mixture was then transferred to a 6-well plate and subjected to ultrasonication (1.5 W/cm2) for different durations. Immediately after ultrasonication, the fluorescence of the samples was measured using a fluorescence spectrophotometer (ex: 505 nm; emission scanning range: 510 - 600 nm).
(2) ESR detection of 1O2. 100 mM TEMP was added to different experimental groups: TEMP + Mn3O4/QD@LM, TEMP + Mn3O4/QD@LM + H2O2, TEMP + Mn3O4/QD@LM + US, TEMP + Mn3O4/QD@LM + H2O2 + US. (Mn3O4/QD@LM: 50 μg/mL; H2O2: 1 mM). The ultrasonication-treated groups were exposed to ultrasound irradiation (1.0 W/cm2, 3 min) using an ultrasonic instrument. After ultrasound irradiation, the reaction solution was immediately transferred to a quartz capillary for ESR measurement.
Cells and animals
The murine colon cancer cell line CT26 and the human colon cancer cell line Caco-2 were obtained from ATCC. Cultures were maintained in RPMI 1640 complete medium at 37 °C in a humidified atmosphere containing 5% CO2. Cell authenticity was verified by morphological examination and PCR analysis, confirming the absence of interspecies cross-contamination.
Female Balb/c mice (6-8 weeks old) were purchased from GemPharmatech Co., Ltd. (Jiangsu, China). Mice were housed under SPF conditions. The environment featured a controlled temperature and humidity, along with a 12-h light/dark cycle. All experimental procedures involving animals followed national guidelines. Ethical approval was granted by the Animal Ethics Committee of Xi'an Jiaotong University.
In vitro anticancer efficacy of Mn3O4/QD@LM
CT26 cells were seeded in 12-well plates (1×10⁵ cells per well) and cultured overnight for adherence. For the experimental groups, cells were treated with various nanoparticles (Mn3O4: 5 μg/mL; Ag2S QDs: 25 μg/mL). After 8 h of incubation, the cells were washed three times with PBS before adding fresh medium. Cells in the ultrasound groups were then subjected to US treatment (1.0 W/cm2, 3 min). Subsequently, different staining procedures were performed according to the steps described below, along with corresponding analyses.
(1) Calcein-AM/PI staining. After a 6-h incubation period following US treatment, the cells were stained with 2 μM Calcein-AM and 1 μg/mL PI in PBS for 30 min in the dark. The staining solution was then removed, and the cells were washed with PBS. Fluorescence microscopy was subsequently performed, capturing images from randomly selected fields per well using a consistent exposure time.
(2) DCFH-DA staining. Immediately after US treatment, cells were incubated with serum-free medium containing 10 μM DCFH-DA probe for 30 min at 37 °C in the dark. After washing with PBS, images were acquired using a fluorescence microscope with a consistent exposure time from randomly selected fields in each well.
(3) JC-1 staining. After US treatment, continue to culture the cells for 3 h. Then, 5 μg/mL JC-1 staining solution was added and incubated for 20 min at 37 °C. Changes in mitochondrial membrane potential were observed under fluorescence microscope. For flow cytometry analysis, cells are collected into centrifuge tubes after incubation and staining. After staining, the cells were washed twice with washing buffer and tested on the machine.
(4) Annexin V-FITC/PI staining. After US treatment, cells were cultured for another 6 h. Digest the cells by trypsin without EDTA, centrifuge at 1200 rpm for 5 min to pellet the cells. After two washes of cells with pre-chilled PBS, the cells were resuspended in 100 μL of staining buffer at a concentration of approximately 1×10⁶ cells/mL. After adding 5 μL of Annexin V-FITC and 5 μL of PI, the mixture was gently vortexed and incubated for 15 min at room temperature in the dark. Stained cells were then immediately analyzed using a flow cytometer.
Mn3O4/QD@LM biosafety evaluation
Balb/c mice were randomly divided into three groups (n = 5). Mice in the experimental group received Mn3O4/QD@LM tail vein injection every three days for a total of 3 doses. The control group was given the same volume of saline. Mice were euthanized on day 15 or 30 after the first injection. After sacrificing mice, their blood is collected for routine blood and biochemical tests. At the same time, major organs are examined histopathologically by H&E staining.
In vivo anticancer efficacy of Mn3O4/QD@LM
To establish colon cancer models, 4-6-week-old Balb/c mice received a subcutaneous inoculation of 1×10⁶ colon cancer cells. When tumors attained a volume of 50-80 mm3, the mice were randomly separated into six groups: G1: Control, G2: US, G3: Mn3O4@LM, G4: QD@LM + US, G5: Mn3O4/QD@LM, G6: Mn3O4/QD@LM + US. Different nanoparticles were administered via tail vein injection on days 0, 4, 8, and 12. For groups receiving ultrasound treatment (G2, G4, G6), irradiation (1.5 W/cm2, 3 min) was performed 24 h post-injection. Mouse body weight and tumor volume were recorded every two days. Tumor volume (V) was estimated using the formula: V = (width² × length) × 0.5. Upon completion of the study, mice were euthanized; tumors and vital organs were harvested. Histological analysis of tumor tissues was performed using H&E, TUNEL, and Ki67 staining to assess tumor cell proliferation, apoptosis, and pathological changes.
Immune cell subpopulation analysis
Tumor tissues from each treatment group were processed into single-cell suspensions for flow cytometry. Chopped tumor fragments were digested in dissociation buffer containing 100 μg/mL DNAse I and 1 mg/mL Collagenase IV, with continuous shaking for 60 min at 37 °C. The digested mixture was filtered through a cell strainer. Cells were washed twice with ice-cold PBS via centrifugation. Next, cells were resuspended in staining buffer. The following fluorescent conjugated antibodies were added to the cell suspension to stain the surface markers: APC/Cyanine7-anti-CD45, PE/Cyanine7-anti-CD8a, FITC-anti-CD11b, PerCP/Cyanine5.5-anti-CD11c, Pacific Blue™-anti-CD4, PE-anti-Ly6G, PE/Cyanine7-anti-Ly6C, Pacific Blue™-anti-MHCII. After surface staining, cells were washed twice with ice-cold PBS. Cells were then fixed, permeabilized, and stained for intracellular markers: PE-anti-TNF-α, APC-anti-IFN-γ, PE-anti-Foxp3.
Stained cells were analyzed using a flow cytometer. Acquired data were processed with FlowJo software to quantify the proportions of these immune cell subsets: mature DCs (CD45⁺CD11c⁺MHC II⁺), CD8⁺ T cells (CD45⁺CD8⁺), functional CD8⁺ T cells (CD45⁺CD8⁺IFN-γ⁺/TNF-α⁺), functional CD4⁺ T cells (CD45⁺CD4⁺IFN-γ⁺/TNF-α⁺), Tregs (CD45⁺CD4⁺Foxp3⁺), and MDSCs (CD45⁺CD11b⁺Ly6G ⁺).
Ultrasound parameters
The experiment employed an ultrasound therapy device (Model WED-100, manufactured by China's Weierde Company) as the ultrasound trigger source. This device operates using pulsed wave irradiation and is configured with the following parameters: an output power of 1.0 W/cm2 for in vitro studies and 1.5 W/cm2 for in vivo applications, a working frequency of 1.0 MHz, a duty cycle set at 50%, an effective irradiation area of 2.0 cm², and a pulsed repetition frequency of 10 ms. Throughout the procedure, the ultrasound probe was positioned to ensure consistent contact and irradiation coverage.
Statistical analysis
Statistical analysis was performed using GraphPad Prism software. Data are expressed as mean ± SD from at least three independent experiments. Student's t-test was used for two-group comparisons, and one-way analysis of variance (ANOVA) with Tukey's post-hoc test was applied for multiple group comparisons. Statistical significance is denoted by *p < 0.05, **p < 0.01, and ***p < 0.001.
Results and Discussion
Synthesis and characterization of Mn3O4/QD@LM
First, oil-dispersible Ag2S QDs were synthesized separately via a high-temperature pyrolysis method. Transmission electron microscopy (TEM) characterization shows that the QDs possess uniform size, good dispersity, and a diameter of approximately 4-5 nm (Figure 2A). The fluorescence spectrum in Figure 2B shows an emission peak at 1100 nm under 808 nm excitation. Next, the oil-soluble ultrasmall Mn3O4 NPs were prepared by a solution-phase method. TEM results show that the synthesized Mn3O4 NPs are monodisperse and spherical. High-resolution TEM reveals distinct lattice fringes, confirming their crystalline structure (Figure 2C). Size distribution analysis of 100 particles using Image J software yielded an average diameter of 8.1 ± 0.5 nm. The surface chemistry of the Mn3O4 NPs was further characterized by X-ray photoelectron spectroscopy (XPS). The XPS survey scan (Figure S1A) detected characteristic peaks at binding energies of 284.75 eV, 399.73 eV, 531.65 eV, and 641.08 eV, corresponding to C 1s, N 1s, O 1s, and Mn 2p, respectively, confirming that the surface chemical composition of the NPs is consistent with expectations. The Mn 3s orbital exhibits a typical doublet structure due to 3s-3d electron exchange interaction, with the main peak located at 82.7 eV and the satellite peak at 88.6 eV (Figure S1B). As shown in Figure 2D, the Mn 2p XPS spectrum of Mn3O4 shows typical spin-orbit splitting with Mn 2p3/2 and Mn 2p1/2 peaks at 641.1 eV and 653.0 eV, respectively. Meanwhile, distinct shake-up satellite peaks are observed on the high-binding-energy side of the main peaks, which are the characteristic signature of the Mn3O4 phase. Peak deconvolution reveals Mn2+ (34.4%) and Mn3+ (65.8%), with a ratio consistent with the 1:2 stoichiometry of Mn3O4 reported in the literature [25].
Synthesis and characterization of Mn3O4/QD@LM. (A) TEM images of Ag2S QDs. (B) Fluorescence spectra of Ag2S QDs. (C) TEM images of Mn3O4 NPs. (D) XPS spectra for the Mn 2p peak of Mn3O4 NPs. (E) TEM images of Mn3O4/QD@LM. (F) Size distribution of Mn3O4/QD@Lip and Mn3O4/QD@LM. (G) Zeta potential of CM, and Mn3O4/QD@Lip and Mn3O4/QD@LM. (H) TEM elemental mapping images of Mn3O4/QD@LM. (I) Fluorescence staining images of Dio-labeled CM, DiL-labeled liposome, and hybridization products. (J) SDS-PAGE image. I: cell lysate, II: cancer cell membrane, III: Mn3O4/QD@LM.
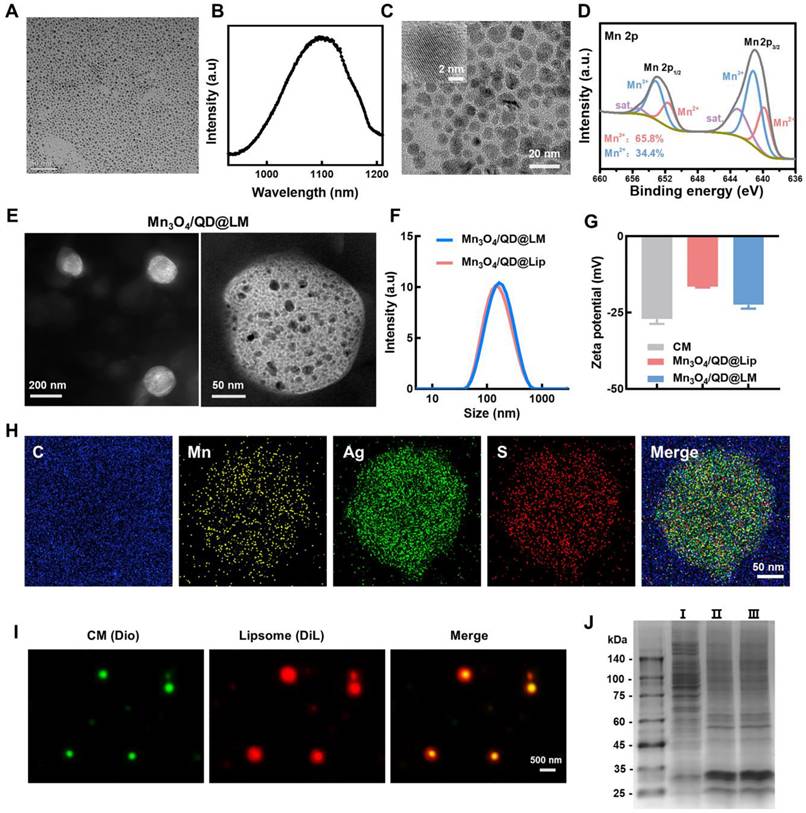
To develop a self-oxygenating nano-delivery system, liposomes (Mn3O4/QD@Lip) co-loaded with Mn3O4 NPs and Ag2S QDs were synthesized using hydrogenated soybean phosphatidylcholine, cholesterol, and DSPE-PEG2000. Subsequently, to enhance targeting capability, cancer cell membranes (CM) were incorporated into the liposomes. This successfully yielded biomimetic hybrid liposomes (Mn3O4/QD@LM). TEM images revealed that the hybrid liposomes possess a spherical morphology. Higher-magnification images further showed the interior to be uniformly and densely loaded with numerous ultrasmall Mn3O4 NPs and Ag2S QDs (Figure 2E). Dynamic light scattering (DLS) was then used to analyze the hydrodynamic size and zeta potential of Mn3O4/QD@Lip and Mn3O4/QD@LM. Size analysis showed similar dimensions: Mn3O4/QD@Lip at 143.6 ± 2.5 nm and Mn3O4/QD@LM at 148.7 ± 1.3 nm (Figure 2F). Zeta potential analysis showed a zeta value of about -28 mV for the isolated CM, a zeta value of about -16.1 mV for Mn3O4/QD@Lip, and a zeta value of -23.1 mV for Mn3O4/QD@LM (Figure 2G). This shift in zeta potential confirms the successful integration of cell membrane components into liposomes. At the same time, the element mapping image shows that the Mn, Ag, and S elements exhibit highly overlapping spatial distributions. All elements were evenly distributed, and there was no significant phase separation, indicating the structural integrity and good dispersion of this nanosystem (Figure 2H). To further verify the incorporation of the membrane, fluorescence imaging characterization was performed. The extracted cell membranes were labeled with DiO dye (green fluorescence) and liposomes with DiL dye (red fluorescence). The fluorescence images in Figure 2I show that the red and green signals in the synthesized liposomes are colocalized. At the same time, SDS-PAGE analysis showed that the protein bands of Mn3O4/QD@LM were similar to those of purified cell membranes, confirming that the cell membrane was successfully incorporated into liposomes (Figure 2J). This result further confirms the successful construction of biomimetic hybrid liposomes.
Mn3O4/QD@LM exhibits enzyme-like activity and enhances sonodynamic therapy
We first assessed the CAT-like activity of Mn3O4/QD@LM. As CAT can catalyze the breakdown of H2O2 into H2O and O2, the CAT-like activity of Mn3O4/QD@LM can be assessed by measuring O2 production and H2O2 consumption. As shown in Figure 3A, the dissolved O2 level in the control group (1 mM H2O2) remained relatively stable over 30 min. In contrast, the O2 content in the Mn3O4/QD@LM + H2O2 group increased with time and concentration dependently. In addition, the H2O2-specific fluorescent probe ROSGreen™ was used to detect H2O2 consumption. The results in Figure 3B showed that fluorescence intensity gradually decreased with increasing material concentration. When the material concentration reached 100 μg/mL, the H2O2 content was only 25% of the initial level (Figure 3C). Together, these results demonstrate that the nanoparticles have excellent CAT-like activity. Next, the GPx-like activity of Mn3O4/QD@LM was assessed using 5,5′-dithiobis (2-nitrobenzoic acid) (DTNB). The reaction product of GSH with DTNB, 2-nitro-5-thiobenzoic acid (TNB), exhibits a characteristic absorption peak at 412 nm. Changes in absorbance at this wavelength reflect GSH levels. As shown in Figures 3D-E, the absorption peak at 412 nm steadily decreased with increasing concentrations of Mn3O4/QD@LM, which indicated progressively greater GSH consumption. These results demonstrate that Mn3O4/QD@LM can deplete GSH, thereby suppressing the antioxidant capacity of cancer cells, which provides a basis for enhancing ROS-mediated cytotoxicity.
Mn3O4/QD@LM exhibits enzyme-like activity and enhances sonodynamic therapy. (A) Dissolved oxygen levels detected by an oxygen meter after the reaction of Mn3O4/QD@LM with H2O2. (B) Fluorescence intensity of H2O2-specific fluorescent probe ROSGreen™ after incubation with Mn3O4/QD@LM at different concentrations. (C) H2O2 depletion capacity of Mn3O4/QD@LM at different concentrations, evaluated using the ROSGreen™ probe. (D) Absorbance of DTNB after incubation of different concentrations of Mn3O4/QD@LM with 4 mM GSH. (E) Quantification of remaining DTNB after incubation with different concentrations of Mn3O4/QD@LM with 4 mM GSH. (F) Detection of ∙OH generated by Mn3O4/QD@LM via a Fenton-like reaction using the MB decolorization assay. (G) Detection of ∙OH generated by Mn3O4/QD@LM via a Fenton-like reaction using ESR spectroscopy. (H) Detection of 1O2 generated by Mn3O4/QD@LM using the SOSG fluorescent probe after different ultrasonic irradiation times. (I) Detection of 1O2 generated by Mn3O4/QD@LM using ESR spectroscopy under different treatment conditions.
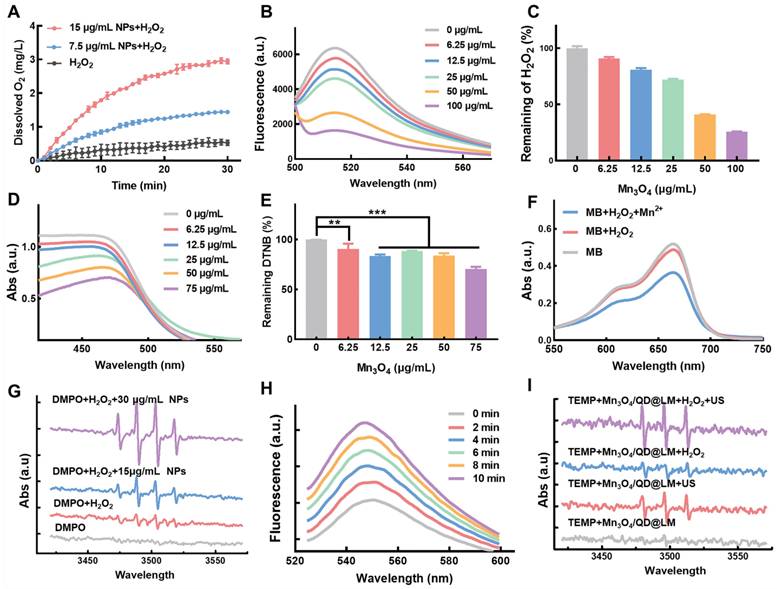
The redox reaction between Mn3O4/QD@LM and GSH can induce Mn2+ generation. The ∙OH produced via the Mn2+/H2O2 Fenton-like reaction can decolorize methylene blue (MB), reducing its absorbance. Therefore, ∙OH generation was first detected using the MB decolorization assay. As shown in Figure 3F, the MB solution alone showed the highest absorbance. Adding H2O2 alone caused no significant change in absorbance. In contrast, the MB absorbance was obviously decreased by the supernatant from nanoparticles pretreated with GSH. This indicates that Mn3O4/QD@LM releases Mn2+ upon reaction with GSH, and the Mn2+ subsequently generates ∙OH via Fenton-like reactions. To directly observe ∙OH production, the ∙OH capture agent 5,5-dimethyl-1-pyrroline N-oxide (DMPO) was used, and signal changes were detected by ESR spectroscopy. The ESR spectra in Figure 3G show weak signals for the DMPO group and the DMPO + H2O2 group. Conversely, the Mn3O4/QD@LM + GSH group exhibited a strong signal.
Next, the sonodynamic effect of Mn3O4/QD@LM was further assessed. As shown by the fluorescence spectra in Figure 3H, the fluorescence intensity of the ¹O2-specific fluorescent probe SOSG exhibited a significant time-dependent increase with prolonged ultrasound exposure. Additionally, ESR spectroscopy was used to detect 1O2 generation by monitoring signal changes of the 1O2 capture agent 2,2,6,6-tetramethylpiperidine (TEMP) under different conditions. The ESR spectra in Figure 3I show that the TEMP + Mn3O4/QD@LM group produced only a weak background signal. In contrast, ultrasound treatment significantly enhanced the characteristic triplet splitting signal. The strongest signal was observed in the TEMP + Mn3O4/QD@LM + H2O2 + US group. This result demonstrated that H2O2 significantly enhances 1O2 generation by Mn3O4/QD@LM. This enhancement is attributed to the CAT-like activity of the Mn3O4 NPs, which continuously supplies O2 by catalyzing H2O2 decomposition, thereby improving SDT efficiency.
In addition, the stability of the Mn3O4/QD@LM nanoplatform were assessment. We measured the size and polydispersity index (PDI) of Mn3O4/QD@LM in three different solutions of water, PBS buffer, and RPMI 1640 complete medium containing 10% FBS over a 7-day period. The results showed that the size and PDI of Mn3O4/QD@LM did not show significant fluctuations over time in the three typical liquid environments mentioned above, indicating that there was no significant aggregation or sedimentation of the Mn3O4/QD@LM (Figure S2). This good stability indicates that Mn3O4/QD@LM maintains good dispersibility in both saline and complex biological protein-rich media. This result provides an important guarantee for the subsequent therapeutic application of Mn3O4/QD@LM.
Therapeutic efficacy of Mn3O4/QD@LM in vitro
Efficient cellular uptake of nanoparticles is essential for their intended function. Dil-labeled nanoparticles (Dil@LM) were co-incubated with colon cancer CT26 cells for different durations (0 - 8 h) and then observed via fluorescence imaging. Confocal microscopy images revealed punctate red fluorescence signals around the cell membrane after 2 h of incubation, indicating the initiation of nanoparticle internalization. By 8 h, the red fluorescence intensity reached its maximum, showing dense fluorescence throughout the cytoplasm. (Figure S3A) Quantitative flow cytometry analysis further demonstrated that nanoparticle uptake was highly time-dependent. In the 8 h group, 98.4% of cells exhibited strong fluorescence signals, confirming continuous and accumulative uptake of the nanoparticles (Figure S3B-C). The flow cytometry results were consistent with the fluorescence observations, indicating that CT26 cells effectively internalize nanoparticles over time. These findings provide a cellular basis for subsequent nanoparticles to exert enzymatic catalytic effects.
To investigate the CAT-like activity of Mn3O4/QD@LM at the cellular level, a hypoxic environment was simulated using the hypoxia-inducing agent desferrioxamine combined with liquid paraffin sealing. Intracellular O2 concentration in CT26 cells was detected using the O2-quenched red fluorescent probe [Ru(dpp)3]Cl2. As shown in Figure 4A, compared to the control group, the QD@LM group showed no significant change in fluorescence intensity under either oxygen condition. In contrast, the Mn3O4/QD@LM group exhibited a significant decrease in red fluorescence intensity under both normoxia and hypoxia. Flow cytometry quantification results (Figure 4B) further confirm these findings that the CAT-like activity of Mn3O4 NPs effectively increases intracellular oxygen content. Subsequently, the effect of the nanomaterials on cellular GSH levels (GPx-like activity) was assessed using a GSH quantification kit. As presented in Figure 4C, GSH content in the Mn3O4/QD@LM group significantly decreased to 61.8% of the control level. This result indicates that the GPx-like activity of Mn3O4 NPs effectively depletes intracellular GSH, thus laying the foundation for enhancing the effect of subsequent SDT. The redox reaction between Mn3O4/QD@LM and GSH can trigger the release of Mn2+, which undergoes a Fenton-like reaction with H2O2, resulting in high cytotoxicity· OH. To evaluate the ·OH-producing capability of the Mn3O4/QD@LM, intracellular ·OH levels were assessed using the specific fluorescent probe hydroxyphenyl fluorescein (HPF). Immunofluorescence staining revealed a substantially enhanced green fluorescence signal in cells treated with Mn3O4/QD@LM compared to the control and QD@LM groups, indicating elevated ·OH production (Figure 4D). The flow cytometry analysis results showed a consistent trend (Figure 4E). In summary, Mn3O4/QD@LM exhibits multifaceted catalytic activities at the cellular level, including CAT-like, GPx-like enzymatic functions, and ·OH generation capacity, thus laying the foundation for its subsequent therapeutic efficacy.
Therapeutic efficacy of Mn3O4/QD@LM in vitro. (A) Fluorescence images of cells stained with the O2-quenching probe [Ru(dpp)3]Cl2 under normoxia and hypoxia conditions for different treatment groups. (B) Intracellular O2 levels were assessed by flow cytometry post-treatment (n = 3). (C) Intracellular GSH content measured after various treatments (n = 3). (D) Fluorescence images of CT26 cells stained with the HPF following different treatments. (E) Evaluation of ∙OH levels by flow cytometry after different treatments (n = 3). (F) Fluorescence images of CT26 cells stained with the DCFH-DA following different treatments. (G) Representative scatter plots of MMP in CT26 cells evaluated by flow cytometry under different treatments. (H) Quantification of apoptosis in CT26 cells using flow cytometry after various treatments. (I) Fluorescence images of calcein-AM/PI-stained CT26 cells after different treatments. Statistical comparisons were performed by one-way ANOVA. Statistically significant difference: *p < 0.05, **p < 0.01, and ***p < 0.001.
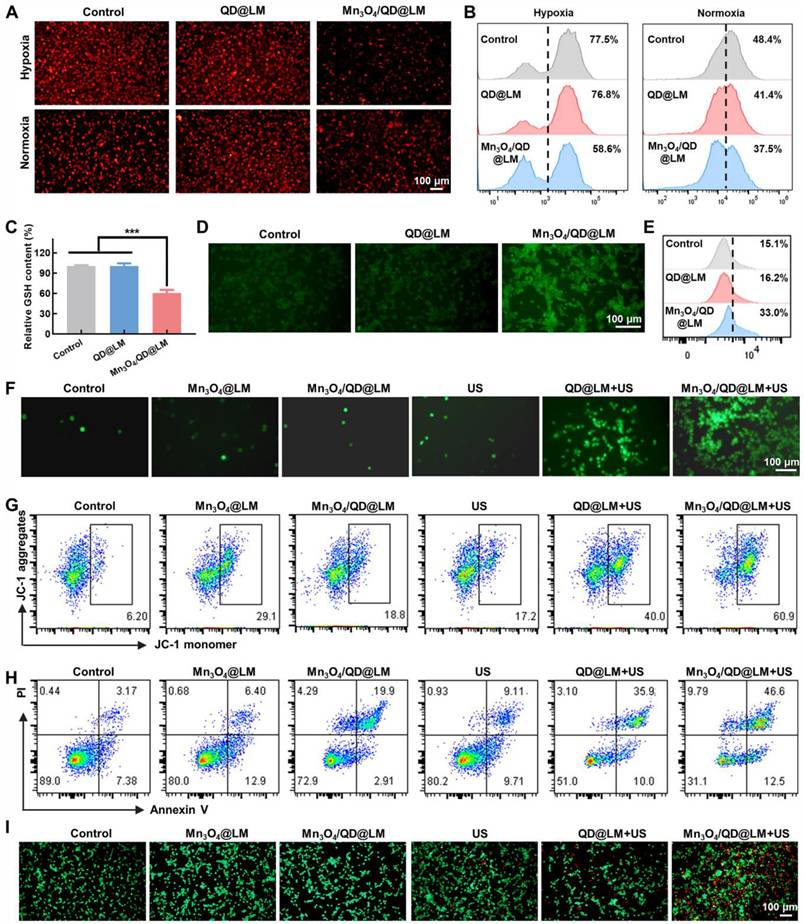
It is currently believed that the main mechanism by which SDT exerts its cytotoxic effects is through the production of large amounts of ROS. ROS is one of the key mediators of cellular signaling and oxidative stress. Excessive ROS can induce tumor cell death. Subsequently, ROS production by Mn3O4/QD@LM was assessed using the ROS-specific fluorescent probe DCFH-DA. The results showed that the control group exhibited weak fluorescence, indicating low levels of endogenous ROS production in tumor cells. The US group showed no significant change in fluorescence intensity (5.4%), confirming that the mechanical effects of US alone were insufficient to induce significant oxidative stress. The Mn3O4@LM and Mn3O4/QD@LM groups also displayed partial green fluorescence (3.51% and 6.67%, respectively). This was attributed to partial ROS generation via a Fenton-like reaction from Mn2+ ions released during the dissociation of Mn3O4. The QD@LM + US group showed a significant increase in fluorescence intensity (16.6%). In contrast, the Mn3O4/QD@LM + US group demonstrated a synergistically enhanced effect, with the proportion of fluorescence-positive cells reaching 26.1% (Figure 4F and S4).
Mitochondria serve as key targets for ROS action, and the collapse of mitochondrial membrane potential (MMP) is a hallmark of apoptosis initiation [26]. MMP was detected using JC-1 (Figure 4G and S5A): The control group maintained normal MMP (green fluorescence: 9.0 ± 2.5%). Both the Mn3O4@LM group (24.9 ± 8.6%) and the Mn3O4/QD@LM group (19.8 ± 4.2%) showed mild membrane damage, suggesting oxidation of mitochondrial lipids by Mn2+-mediated ROS. Following ultrasound irradiation, the QD@LM + US group (45.7 ± 6.3%) and especially the Mn3O4/QD@LM + US group (63.3 ± 6.9%) exhibited significantly enhanced green fluorescence. This indicates sonodynamic effect-induced mitochondrial structural damage, with Mn3O4 NPs further amplifying this effect.
MMP collapse signifies the initiation of the mitochondrial apoptosis pathway [27]. Apoptosis in CT26 cells was quantified using Annexin V-FITC/PI dual staining (Figure 4H and S5B): The Mn3O4/QD@LM + US group achieved a significantly higher apoptosis rate (59.9 ± 1.8%) compared to the US group (19.4 ± 3.3%) and the QD@LM + US group (44.2 ± 1.4%). This difference stems from a synergistic mechanism: QD@LM relies solely on the sonosensitizer to generate 1O2, resulting in limited apoptosis efficiency. In contrast, the Mn3O4/QD@LM + US group utilizes the oxygen-generating function of Mn3O4 NPs to enhance the 1O2 production level of Ag2S QDs, coupled with Mn2+-triggered Fenton-like reactions. This creates a positive feedback loop for ROS generation, substantially increasing the apoptosis rate. The cytotoxic effect was further visualized by Calcein-AM/PI staining (Figure 4I), the QD@LM + US group showed increased red fluorescence (indicating cell death). The Mn3O4/QD@LM + US group displayed the strongest red fluorescence, confirming that cascade catalytic reactions induce irreversible cell death.
Immunogenic cell death triggered by Mn3O4/QD@LM in vitro
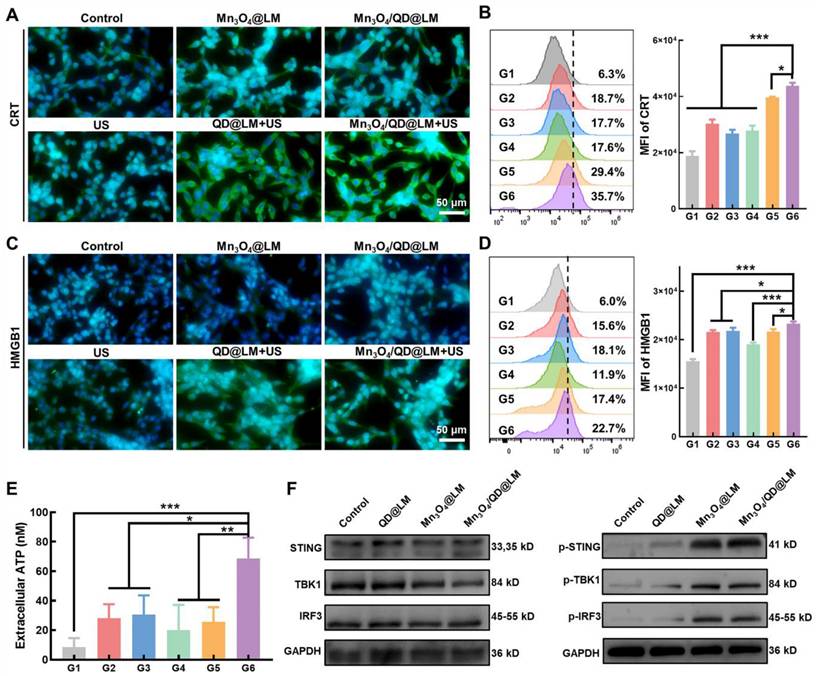
Previous studies have demonstrated that ROS-mediated SDT can induce ICD in tumor cells. This process is characterized by releasing DAMPs signals, such as the exposure of calreticulin (CRT), adenosine triphosphate (ATP), and high mobility group box 1 (HMGB1), thereby activating the immune response. Therefore, we first evaluated the impact of SDT on CRT and HMGB1 expression. Immunofluorescence imaging (Figure 5A) revealed that cells treated with US alone exhibited weak green fluorescence, whereas the Mn3O4@LM and Mn3O4/QD@LM groups showed elevated fluorescence, suggesting that Mn2+ alone can induce a limited degree of ICD. Notably, the Mn3O4/QD@LM + US group displayed the strongest green fluorescence, confirming a marked increase in CRT exposure on the surface of CT26 cells. Consistent with these observations, flow cytometric analysis (Figure 5B) demonstrated that CRT fluorescence intensity was significantly higher in the Mn3O4/QD@LM + US group compared to all other groups. Furthermore, immunofluorescence images and flow cytometry analysis of HMGB1 (Figure 5C-D) revealed a similar trend. In addition, the Mn3O4/QD@LM + US group exhibited the highest level of ATP secretion among all treatment groups (Figure 5E). Collectively, these results demonstrate that Mn3O4/QD@LM + US can trigger ICD effectively.
Immunogenic cell death and STING pathway activation mediated by Mn3O4/QD@LM in vitro. (A) Immunofluorescence staining of CRT in CT26 cells after different treatments. (B) Flow cytometry analysis of the corresponding CRT mean fluorescence intensity (n = 3). (C) Immunofluorescence staining of HMGB1 in CT26 cells after various treatments. (D) Flow cytometry analysis of the corresponding HMGB1 mean fluorescence intensity (n = 3). (E) Extracellular ATP levels of CT26 cells after different treatments (n = 3). (F) Western blot analysis of protein levels in the STING pathway (n = 3). G1: Control, G2: Mn3O4@LM, G3: Mn3O4/QD@LM, G4: US, G5: QD@LM + US, and G6: Mn3O4/QD@LM + US. Data are presented as mean ± SD. Statistical comparisons were performed by one-way ANOVA. Statistically significant difference: *p < 0.05, **p < 0.01, and ***p < 0.001.
Mn3O4/QD@LM can active STING signaling pathway
Mn2+ can activate the STING signaling pathway by enhancing the binding affinity of cyclic GMP-AMP synthase (cGAS) to its substrate cGAMP [19]. To assess the capacity of Mn3O4/QD@LM to activate the STING pathway, we performed western blot analysis to detect TBK1, STING, and IRF3 proteins and their phosphorylation levels in CT26 cells after incubation with different nanoparticles. In contrast to the control and QD@LM groups, treatment with Mn3O4/QD@LM nanoparticles resulted in markedly elevated expression levels of phosphorylated proteins p-TBK1, p-STING, and p-IRF3 (Figure 5F). These findings suggest that Mn2+ released by Mn3O4/QD@LM in the TME effectively activates the STING pathway, thereby enhancing the anti-tumor immune response.
Biocompatibility of Mn3O4/QD@LM in vivo
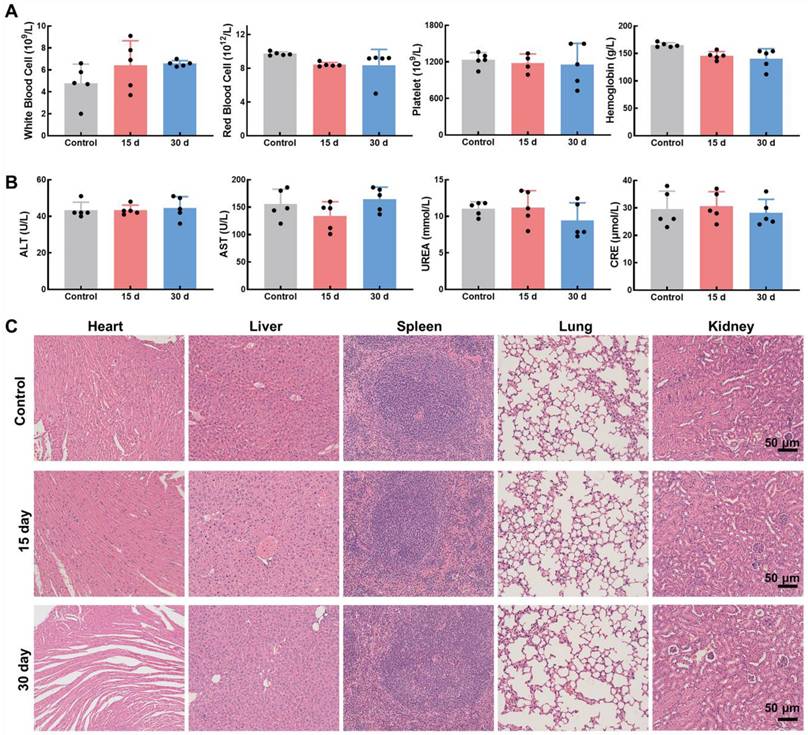
Good biosafety of nanomaterials is a prerequisite for in vivo therapeutic applications. To evaluate the in vivo biosafety of Mn3O4/QD@LM, we dynamically monitored changes in liver/kidney function and hematological parameters in mice at multiple time points after intravenous injection of Mn3O4/QD@LM. Hematological analysis revealed that on day 15 and day 30 post-injection, key blood cell parameters - including white blood cells, red blood cells, platelets, and hemoglobin - in the nanomaterial-injected group remained comparable to those in the control group (Figure 6A). This demonstrates that Mn3O4/QD@LM did not disrupt hematopoietic system homeostasis. The liver and kidneys, being the primary organs for nanoparticle metabolism, are critical for assessing material toxicity. As shown in Figure 6B, serum levels of alanine aminotransferase (ALT), aspartate aminotransferase (AST), creatinine, and blood urea nitrogen (BUN) in the experimental group showed no statistically significant differences from the control group on day 15 and day 30. These results indicate that Mn3O4/QD@LM caused neither hepatocellular membrane damage nor glomerular filtration dysfunction. Furthermore, histopathological evidence in Figure 6C showed no pathological alterations in H&E-stained sections of major organs (Heart, Liver, Spleen, Lung, Kidney) after 15 or 30 days of exposure. Collectively, these results demonstrate the minimal biosafety concerns of Mn3O4/QD@LM, providing a solid foundation for its potential use in in vivo therapeutics.
Biocompatibility of Mn3O4/QD@LM in vivo. (A) Hematological parameters in mice at various time points following the administration of Mn3O4/QD@LM or saline (n = 5). (B) Blood biochemical parameters in mice at different time points after injection of Mn3O4/QD@LM or saline (n = 5). (C) H&E-stained images of major organs from mice at various time points following the administration of Mn3O4/QD@LM or saline.
Tumor targeting and biodistribution of Mn3O4/QD@LM
Effective uptake by target cells is a prerequisite for nanoparticles to work. In recent years, isotype tumor cell membrane coating has become a key strategy to improve the targeting efficiency of nanoparticles. This mechanism relies on natural adhesion molecules and specific surface antigens conserved on the tumor cell membrane to achieve specific binding to homologous tumor cells through "isotype recognition" [28]. Several studies have demonstrated that this strategy can significantly enhance the accumulation of nanoparticles at tumor sites [29, 30]. First, we prepared DiL-labeled liposomes (DiL@Lip) and biomimetic nanoliposomes incorporating tumor cell membrane (DiL@LM). After incubating CT26 cells with both nanoparticles for 8 h, cell uptake was assessed. As shown in Figure 7A, CT26 cells internalized some DiL@Lip after 8 h co-incubation. However, a significantly stronger fluorescence signal was observed in cells incubated with DiL@LM. Flow cytometry analysis (Figure 7B) quantitatively confirmed this: the mean fluorescence intensity of the DiL@LM group was 2.65 times higher than that of the DiL@Lip group, further proving that the tumor cell membrane coating enhanced the targeting of nanoparticles.
Tumor targeting and biodistribution of Mn3O4/QD@LM. (A) Fluorescence image and (B) flow cytometry analysis of CT26 cells following an 8-h incubation with DiL@Lip or DiL@LM (n = 3). (C) Dynamic distribution of fluorescence signals in CT26 tumor-bearing mice at the indicated times post-injection of DiR@Lip or DiR@LM, and (D) corresponding fluorescence quantification (n = 3). (E) Fluorescence images of dissected organs and tumors from CT26 tumor-bearing mice 48 h after intravenous injection of DiR@Lip or DiR@LM, and (F) corresponding fluorescence quantification (n = 3). Data are presented as mean ± SD. Statistical comparisons were performed by one-way ANOVA. Statistically significant difference: *p < 0.05, **p < 0.01, and ***p < 0.001.
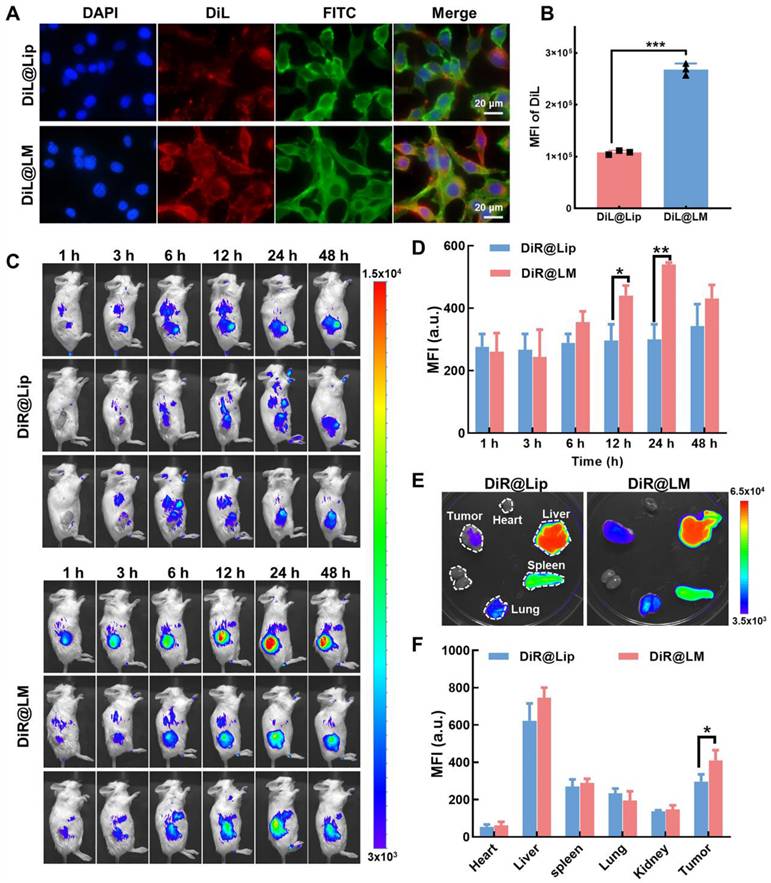
To investigate the biodistribution and tumor-targeting capabilities of nanoparticles in vivo, DiR-labeled DiR@Lip or DiR@LM was administered intravenously to CT26 tumor-bearing mice. As shown in Figure 7C, the fluorescence intensity of the tumor site in both groups increased over time, peaking at 24 h post-injection and then gradually decreasing. Importantly, DiR@LM showed significantly enhanced tumor accumulation compared to DiR@Lip. Tumor fluorescence intensity in the DiR@LM group was 1.48-fold higher than in the DiR@Lip group at 12 h, and this targeting advantage further increased to 1.79-fold at 24 h (Figure 7D). Subsequently, mice were sacrificed at 48 h post-injection. Major organs and tumor tissue were collected, and the distribution of nanoparticles was analyzed. Ex vivo imaging showed the highest fluorescence signal intensity in the liver, consistent with its role as the primary metabolic organ responsible for nanoparticle clearance (Figure 7E). Importantly, ex vivo tumor imaging further confirmed that the fluorescence intensity of the DiR@LM group was significantly higher than that of the DiR@Lip group (Figure 7F). Together, these findings demonstrate that the liposomes incorporated with tumor cell membranes (DiR@LM) have stronger tumor-targeting efficiency compared to uncoated liposomes (DiR@Lip).
Anti-tumor effect of Mn3O4/QD@LM in vivo
In order to evaluate the in vivo therapeutic effect of Mn3O4/QD@LM, CT26 tumor-bearing mice were randomly divided into six groups: G1: Control; G2: US; G3: Mn3O4@LM; G4: QD@LM + US; G5: Mn3O4/QD@LM; G6: Mn3O4/QD@LM + US. The treatment process is shown in Figure 8A. Mice are injected with different nanomaterials through the tail vein. At 24 h post-injection, the ultrasound treatment group received US irradiation (1.5 W/cm2, 3 min). Mouse body weight and tumor volume were recorded every two days throughout the experiment.
Anti-tumor effect of Mn3O4/QD@LM in vivo. (A) Schematic diagram of the antitumor experiment in vivo. (B) Body weight of mice in each treatment group (n = 5). (C) Average tumor volume of mice following different treatments (n = 5). (D) Tumor weight measured at the end of the experiment for each group (n = 5). (E) Tumor growth curves of individual animals across treatment groups. (F) H&E staining, (G) TUNEL immunofluorescence staining, and (H) Ki67 immunofluorescence staining images of tumor tissue of mice in different treatment groups. G1: Control, G2: US, G3: Mn3O4@LM, G4: QD@LM + US, G5: Mn3O4/QD@LM, and G6: Mn3O4/QD@LM + US. Data are presented as mean ± SD. Statistical comparisons were performed by one-way ANOVA. Statistically significant difference: *p < 0.05, **p < 0.01, and ***p < 0.001.
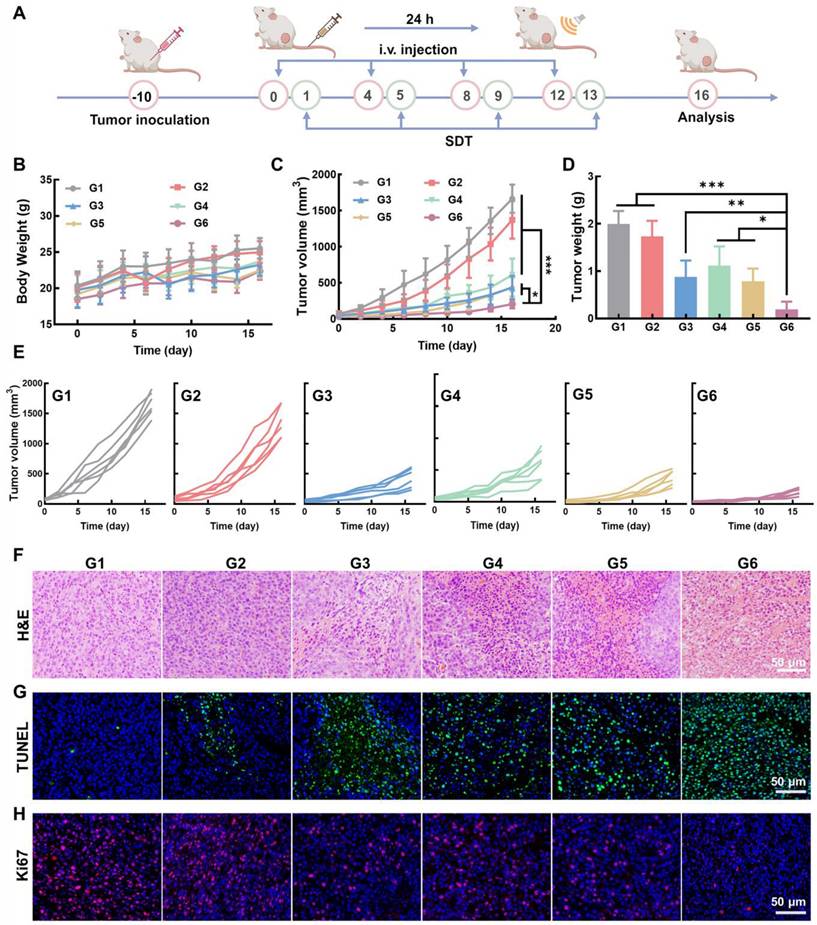
As shown in Figure 8B, the average body weights across all groups showed no significant difference, which demonstrates that the nano-system did not induce metabolic disorders or systemic toxicity during treatment. Tumor volume and tumor weight measurements (Figure 8C-E) revealed that the US group showed only a weak inhibitory effect on tumor growth. In contrast, both the Mn3O4@LM and Mn3O4/QD@LM groups showed stronger antitumor effects. This is primarily attributed to the Fenton-like activity of Mn3O4 NPs within the tumor microenvironment. The tumor volume in the QD@LM + US group was 46.8% of that in the control group, indicating the limitations of a single treatment modality. Tumor growth inhibition was most significant in the Mn3O4/QD@LM + US group, with a tumor suppression rate of 87.6% after 16 days of treatment. Furthermore, the ex vivo tumor image in Figure S6 visually confirmed the pronounced tumor suppression effect in the Mn3O4/QD@LM + US group.
To further evaluate the tumor inhibitory effect of Mn3O4/QD@LM, histopathological analysis was performed on tumor tissue. H&E staining results showed that the tumor cells in the control group maintained normal morphology, and the nucleus was intact. The Mn3O4/QD@LM + US group displayed characteristic apoptotic morphological changes and the largest areas of necrosis (Figure 8F). Subsequently, TUNEL staining was used to analyze cell apoptosis (Figure 8G). Compared to the control group, an enhanced green fluorescence signal was observed in both the Mn3O4@LM and Mn3O4/QD@LM groups, which confirmed Mn3O4 NPs can induce tumor cell death through their Fenton-like effect. The strongest green fluorescence was detected in the Mn3O4/QD@LM+US group, indicating that the apoptosis in this group was the most severe, indicating the superior efficacy of synergistic treatment. Furthermore, cell proliferation activity was assessed by detecting the expression level of the nuclear proliferation marker Ki67 (Figure 8H). Immunofluorescence results showed that the control group had the strongest Ki67-positive red fluorescence signal. The lowest signal intensity was observed in the Mn3O4/QD@LM + US group.
Mechanistic insights into the anti-tumor immune response of Mn3O4/QD@LM
To gain deeper insight into the immune response elicited by Mn3O4/QD@LM during treatment, we analyzed immune cell subsets within tumor tissues harvested from mice post-treatment. DCs are central regulators of adaptive immunity. Their maturation state directly determines the strength of the anti-tumor immune response. Mature DCs highly express major histocompatibility complex class II molecules (MHC II) and co-stimulatory molecules. They present tumor antigens to T cells, activating specific cytotoxic T lymphocyte (CTLs) responses. First, we assessed the proportion of mature DCs (CD45⁺CD11c⁺MHC II⁺) in tumor tissues using flow cytometry. As shown in Figure 9A, the combined Mn3O4/QD@LM + US treatment group exhibited significantly higher MHC II expression (44.2 ± 7.9%) on DCs compared to the Mn3O4@LM group (34.0 ± 6.3%) and the QD@LM + US group (27.3 ± 4.4%). This highlights the distinct advantage of the combined therapy in promoting DC maturation. Acting as immune system "sentinels", mature DCs drive the activation and expansion of tumor-infiltrating lymphocytes. Within the anti-tumor immune response, CD8⁺ T cells serve as key effector cells, capable of specifically recognizing and mediating tumor cell lysis. CD4⁺ T cells primarily provide helper functions. By secreting cytokines like IL-2 and IFN-γ, they enhance CD8⁺ T cell cytotoxicity and promote sustained DC maturation, forming a positive feedback immune regulatory loop [31]. Flow cytometric quantification revealed that the proportions of both CD8⁺ T cells and CD4⁺ T cells within the tumor tissue were significantly higher than in other groups (Figure 9B). Specifically, the cytotoxic CD8⁺ T cell subset reached 31.8 ± 2.8%, representing a 2.6-fold increase over the Control group. The helper CD4⁺ T cell subset also significantly increased to 11.7 ± 1.6%, a 2.5-fold increase over the Control group. These results collectively demonstrate that Mn3O4/QD@LM + US treatment triggers a robust anti-tumor immune effect. As core mediators of adaptive immunity, the cytokines TNF-α and IFN-γ play crucial roles in anti-tumor responses. Flow cytometric analysis of cytokine-secreting cell proportions revealed that the Mn3O4/QD@LM + US group exhibited the highest percentages of CD8⁺IFN-γ⁺ T cells (39.3 ± 4.0%) and CD8⁺TNF-α⁺ T cells (15.8 ± 0.4%) within the tumor compared to all other groups (Figures 9C-D and S7A-B). Similarly, the proportions of tumor-infiltrating CD4⁺IFN-γ⁺ T cells (21.9 ± 3.0%) and CD4⁺TNF-α⁺ T cells (21.8 ± 1.0%), which are vital for regulating adaptive immunity, were also significantly higher in the Mn3O4/QD@LM + US group than in other groups (Figures 9E-F and S7C-D).
Mechanism of anti-tumor immune response of Mn3O4/QD@LM. (A) Representative flow cytometry plots and quantitative analysis of mature DCs within the tumor (n = 3). (B) Representative flow cytometry plots and quantitative analysis of T cells within the tumor (n = 3). (C) Quantitative analysis of CD8⁺IFN-γ⁺ T cells in tumor tissues (n = 3). (D) Quantitative analysis of CD8⁺TNF-α⁺ T cells in tumor tissues (n = 3). (E) Quantitative analysis of CD4⁺IFN-γ⁺ T cells in tumor tissues (n = 3). (F) Quantitative analysis of CD4⁺TNF-α⁺ T cells in the tumor (n = 3). (G) Representative flow cytometry plots and quantitative analysis of Tregs in tumor tissues (n = 3). (H) Representative flow cytometry plots and quantitative analysis of MDSCs in tumor tissues (n = 3). G1: Control, G2: US, G3: Mn3O4@LM, G4: QD@LM+US, G5: Mn3O4/QD@LM, and G6: Mn3O4/QD@LM +US. Data are presented as mean ± SD. Statistical comparisons were performed by one-way ANOVA. Statistically significant difference: *p < 0.05, **p < 0.01, and ***p < 0.001.
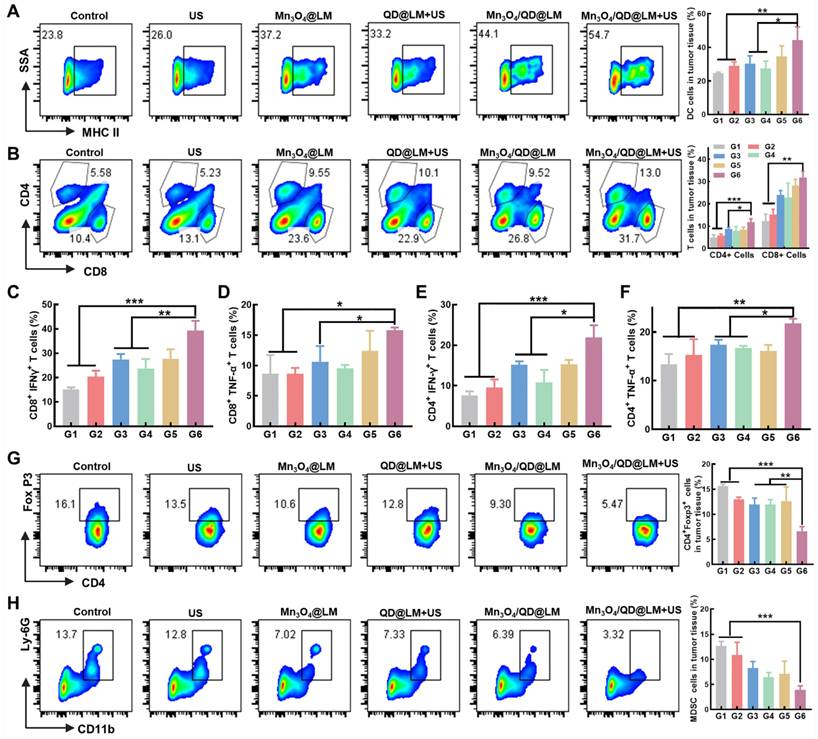
Within the complex regulatory network of tumor immunotherapy, the dynamic balance between CTLs and immunosuppressive cells directly dictates the strength and durability of the anti-tumor immune response. Tregs can accumulate in TME, impairing effector T cell function [32]. Furthermore, MDSCs present in the TME are key mediators of tumor immune tolerance, partly by restricting CD8⁺ T cell infiltration into tumor sites [33]. To determine if the combined strategy could maximize the anti-tumor immune response, we next measured the proportions of these two immunosuppressive cell types in mouse tumors. As shown in Figures 9G-H, statistical analysis indicated that Mn3O4/QD@LM + US treatment significantly reduced the proportion of Tregs (to 6.5 ± 0.9% vs. 15.6 ± 0.4% in the control group) and MDSCs (to 3.9 ± 0.8% vs. 12.7 ± 0.9% in the control group).
These in vivo results collectively demonstrate that Mn3O4/QD@LM + US therapy can drive immune activation and amplify tumor antigen-specific killing by enhancing IFN-γ and TNF-α secretion from CD8⁺ and CD4⁺ T cells. At the same time, it can alleviate immunosuppressive constraints by substantially reducing Tregs and MDSCs infiltration, thereby weakening their inhibition of effector T cells and disrupting the vicious cycle of tumor immune escape. These findings indicate that Mn3O4/QD@LM + US provides a novel synergistic strategy for overcoming resistance to immunotherapy in solid tumors.
Conclusion
To address the limitations of SDT in the hypoxic tumor microenvironment and high levels of GSH, this study designed and constructed a bio-mimetic liposome platform which loads ultra-small Mn3O4 NPs and Ag2S QDs to enhance the efficacy of sonodynamic-immunotherapy for colorectal cancer. The nanosystem demonstrated excellent CAT-like and GPx-like activities in vitro, enabling self-supply of oxygen and depletion of GSH, thereby alleviating tumor hypoxia and reducing the reductive microenvironment, which significantly improved the SDT efficiency. Moreover, it mediated a Fenton-like reaction to generate ·OH, further synergizing tumor cell killing. Cellular experiments revealed that upon US activation, Mn3O4/QD@LM exhibited remarkable antitumor effects in vitro. In a CT26 tumor-bearing mouse model, the platform achieved high tumor-specific accumulation through homologous targeting. Combined with ultrasound treatment, it achieved a tumor inhibition rate of 87.6%, and effectively remodeled the tumor immune microenvironment by promoting CD8⁺ T cell infiltration and downregulating Tregs and MDSCs. These findings provide a new and promising paradigm for improving the efficacy of sonodynamic-immunotherapy.
Abbreviations
SDT: sonodynamic therapy; ROS: reactive oxygen species; Ag2S QDs: Ag2S quantum dots; Tregs: regulatory T cells; MDSCs: myeloid-derived suppressor cells; GSH: glutathione; TME: tumor microenvironment; ICD: immunogenic cell death; CAT: catalase; GPx: glutathion peroxidase; ∙OH: hydroxyl radicals; DTNB: 5,5'-dithiobis (2-nitrobenzoic acid); ESR: electron spin resonance; MB: methylene blue; 1O2: singlet oxygen; TEM: transmission electron microscopy; XPS: X-ray photoelectron spectroscopy; CM: cell membranes; DLS: dynamic light scattering; DMPO: 5,5-dimethyl-1-pyrroline N-oxide; TEMP: 2,2,6,6-tetramethylpiperidine; MMP: mitochondria membrane potential; DAMPs: damage-associated molecular patterns; CRT: calreticulin; HMGB1: high-mobility group box 1; ALT: alanine aminotransferase; AST: aspartate aminotransferase; BUN: blood urea nitrogen; MHC II: major histocompatibility complex class II molecules; CTLs: cytotoxic T lymphocyte.
Supplementary Material
Supplementary figures.
Acknowledgements
We thank Dr. Zijun Ren at the Instrument Analysis Center of Xi'an Jiaotong University for assisting with TEM analysis. The authors would like to acknowledge the critical and quantitative testing work supported by Beijing Zhongkebaice Technology Service Co., Ltd. (www.zkbaice.cn).
Funding
This work was supported by the National Natural Science Foundation of China (Nos. 82472127 and 82502548), the Fundamental Research Funds for the Central Universities, China (Nos. xtr052023008, xzy022025082, and xtr012025011), and the Zhejiang Provincial Natural Science Foundation of China (LTGY23H160032).
Data availability
The data that support the findings of this study are available from the corresponding author upon reasonable request.
Ethics approval and consent to participate
All animal procedures complied with national regulations and were approved by the Animal Ethics Committee of Xi'an Jiaotong University (Approval No. XJTUAE2024-1005).
Author contributions
Yuanyuan Zhang: Investigation, Methodology, Experiments, Data curation, Formal analysis, Writing-original draft. Wenxiang Zhu: Data curation, Formal analysis. Kaimin Li: Writing-review & editing. Yun Xie: Methodology, Conceptualization. Zhichao Deng: Methodology, Experiments. Yuanyuan Zhu: Methodology. Bowen Gao: Investigation, Data curation. Chenxi Xu: Data curation, Formal analysis. Junlong Fu: Conceptualization, Methodology. Mingzhen Zhang: Conceptualization, Writing-review & editing, Resources, Supervision, Funding acquisition, Project administration. Xiaoliang Zheng: Conceptualization, Supervision, Project administration. Haifeng Zhang: Conceptualization, Writing-review & editing, Resources, Funding acquisition, Project administration.
Competing Interests
The authors have declared that no competing interest exists.
References
1. Pan X, Wang H, Wang S, Sun X, Wang L, Wang W. et al. Sonodynamic therapy (SDT): a novel strategy for cancer nanotheranostics. Sci China Life Sci. 2018;61:415-26
2. Sun Y, Wang H, Zhang K, Liu J, Wang P, Wang X. et al. Sonodynamic therapy induces oxidative stress, DNA damage and apoptosis in glioma cells. RSC Adv. 2018;8:36245-56
3. Nowak KM, Schwartz MR, Breza VR, Price RJ. Sonodynamic therapy: rapid progress and new opportunities for non-invasive tumor cell killing with sound. Cancer Lett. 2022;532:215592
4. Krysko DV, Garg AD, Kaczmarek A, Krysko O, Agostinis P, Vandenabeele P. Immunogenic cell death and DAMPs in cancer therapy. Nat Rev Cancer. 2012;12:860-75
5. Shannon AM, Bouchier-Hayes DJ, Condron CM, Toomey D. Tumour hypoxia, chemotherapeutic resistance and hypoxia-related therapies. Cancer Treat Rev. 2003;29:297-307
6. Noman MZ, Hasmim M, Messai Y, Terry S, Kieda C, Janji B. et al. Hypoxia: a key player in antitumor immune response. a review in the theme: cellular responses to hypoxia. Am J Physiol Cell Physiol. 2015;309:C569-79
7. Hwang C, Sinskey AJ, Lodish HF. Oxidized redox state of glutathione in the endoplasmic reticulum. Science. 1992;257:1496-502
8. Patel A, Sant S. Hypoxic tumor microenvironment: opportunities to develop targeted therapies. Biotechnol Adv. 2016;34:803-12
9. Dai Y, Xu C, Sun X, Chen X. Nanoparticle design strategies for enhanced anticancer therapy by exploiting the tumour microenvironment. Chem Soc Rev. 2017;46:3830-52
10. Ding B, Zheng P, Ma P, Lin J. Manganese oxide nanomaterials: synthesis, properties, and theranostic applications. Adv Mater. 2020;32:e1905823
11. Yang G, Ji J, Liu Z. Multifunctional MnO2 nanoparticles for tumor microenvironment modulation and cancer therapy. Wiley Interdiscip Rev Nanomed Nanobiotechnol. 2021;13:e1720
12. Lin LS, Song J, Song L, Ke K, Liu Y, Zhou Z. et al. Simultaneous fenton-like ion delivery and glutathione depletion by MnO2-based nanoagent to enhance chemodynamic therapy. Angew Chem Int Ed Engl. 2018;57:4902-6
13. Qian XQ, Han XX, Yu LD, Xu TM, Chen Y. Manganese-based functional nanoplatforms: nanosynthetic construction, physiochemical property, and theranostic applicability. Adv Funct Mater. 2020;30:1907066
14. Taguchi T, Mukai K, Takaya E, Shindo R. STING operation at the ER/Golgi interface. Front Immunol. 2021;12:646304
15. Zhang K, Qi C, Cai K. Manganese-based tumor immunotherapy. Adv Mater. 2023;35:e2205409
16. Lv MZ, Chen MX, Zhang R, Zhang W, Wang CG, Zhang Y. et al. Manganese is critical for antitumor immune responses via cGAS-STING and improves the efficacy of clinical immunotherapy. Cell Res. 2020;30:966-79
17. Fuertes MB, Kacha AK, Kline J, Woo SR, Kranz DM, Murphy KM. et al. Host type I IFN signals are required for antitumor CD8 T cell responses through CD8α dendritic cells. J Exp Med. 2011;208:2005-16
18. Gutjahr A, Papagno L, Nicoli F, Kanuma T, Kuse N, Cabral-Piccin MP. et al. The STING ligand cGAMP potentiates the efficacy of vaccine-induced CD8+ T cells. JCI Insight. 2019;4:e125107
19. Amouzegar A, Chelvanambi M, Filderman JN, Storkus WJ, Luke JJ. STING agonists as cancer therapeutics. Cancers. 2021;13:2695
20. Liu D, Liang S, Ma K, Meng QF, Li X, Wei J. et al. Tumor microenvironment-responsive nanoparticles amplifying STING signaling pathway for cancer immunotherapy. Adv Mater. 2024;36:e2304845
21. Li WY, Li RT, Ye Q, Zou YM, Lu X, Zhang WH. et al. MnO nanoshell coated metal-organic frameworks with microenvironment-driven O2 production and GSH exhaustion ability for enhanced chemodynamic and photodynamic cancer therapies. Adv. Healthcare Mater. 2023;12:2202280
22. Zhang Y, Jin W, Deng Z, Gao B, Zhu Y, Fu J. et al. Metabolic reprogramming nanomedicine potentiates colon cancer sonodynamic immunotherapy by inhibiting the CD39/CD73/ADO pathway. Acta Pharm Sin B. 2025;15:2655-72
23. Li C, Yang XQ, An J, Cheng K, Hou XL, Zhang XS. et al. Red blood cell membrane-enveloped O2 self-supplementing biomimetic nanoparticles for tumor imaging-guided enhanced sonodynamic therapy. Theranostics. 2020;10:867-79
24. Zhang YY, Zhang YJ, Li YH, Fu YH, Zhao YR, Zhao W. et al. Harnessing Ag2S quantum dots with immune adjuvant for NIR-II fluorescence imaging-guided sonodynamic immunotherapy of colon cancer. Chem Eng J. 2023;474:145685
25. Yao J, Cheng Y, Zhou M, Zhao S, Lin S, Wang X. et al. ROS scavenging Mn3O4 nanozymes for in vivo anti-inflammation. Chem Sci. 2018;9:2927-33
26. Ma Q, Fang H, Shang W, Liu L, Xu Z, Ye T. et al. Superoxide flashes: early mitochondrial signals for oxidative stress-induced apoptosis. J Biol Chem. 2011;286:27573-81
27. Suen DF, Norris KL, Youle RJ. Mitochondrial dynamics and apoptosis. Genes Dev. 2008;22:1577-90
28. Guo Q, Wang S, Xu R, Tang Y, Xia X. Cancer cell membrane-coated nanoparticles: a promising anti-tumor bionic platform. RSC Adv. 2024;14:10608-37
29. He Z, Zhang Y, Feng N. Cell membrane-coated nanosized active targeted drug delivery systems homing to tumor cells: a review. Mater Sci Eng C Mater Biol Appl. 2020;106:110298
30. Fang RH, Hu CM, Luk BT, Gao W, Copp JA, Tai Y. et al. Cancer cell membrane-coated nanoparticles for anticancer vaccination and drug delivery. Nano Lett. 2014;14:2181-8
31. Miggelbrink AM, Jackson JD, Lorrey SJ, Srinivasan ES, Waibl-Polania J, Wilkinson DS. et al. CD4 T-cell exhaustion: does it exist and what are its roles in cancer? Clin Cancer Res. 2021;27:5742-52
32. Tay C, Tanaka A, Sakaguchi S. Tumor-infiltrating regulatory T cells as targets of cancer immunotherapy. Cancer Cell. 2023;41:450-65
33. Li K, Shi HH, Zhang BX, Ou XJ, Ma QZ, Chen Y. et al. Myeloid-derived suppressor cells as immunosuppressive regulators and therapeutic targets in cancer. Signal Transduct Target Ther. 2021;6:362
Author contact
![]() Corresponding authors: Mingzhen Zhang (ORCID: 0000-0002-4686-6526), Email address: mzhang21edu.cn; Xiaoliang Zheng (ORCID: 0000-0002-7955-7455), Email address: Zhengxledu.cn; Haifeng Zhang (ORCID: 0000-0003-4749-8953), Email address: zhf19841011edu.cn.
Corresponding authors: Mingzhen Zhang (ORCID: 0000-0002-4686-6526), Email address: mzhang21edu.cn; Xiaoliang Zheng (ORCID: 0000-0002-7955-7455), Email address: Zhengxledu.cn; Haifeng Zhang (ORCID: 0000-0003-4749-8953), Email address: zhf19841011edu.cn.