Impact Factor
- Issue 13; 2026
- Issue 12; 2026
- Issue 11; 2026
- Issue 10; 2026
- Issue 9; 2026
- Volume 16; 2026
- Advance Articles
- Past Issues
- Cover Images
- Cover Suggestion
- Index & Coverage
- Special Issues
Introduction
Methods
Results
Discussion
Abbreviations
Supplementary Material
Acknowledgements
References
International Journal of Biological Sciences
International Journal of Medical Sciences
 Global reach, higher impact

Theranostics 2018; 8(11):2909-2926. doi:10.7150/thno.24911 This issue Cite
Research Paper
Three-dimensional transcranial microbubble imaging for guiding volumetric ultrasound-mediated blood-brain barrier opening
Ryan M. Jones1 ![]() , Lulu Deng1, Kogee Leung1, Dallan McMahon1,2, Meaghan A. O'Reilly1,2, Kullervo Hynynen1,2,3
, Lulu Deng1, Kogee Leung1, Dallan McMahon1,2, Meaghan A. O'Reilly1,2, Kullervo Hynynen1,2,3
1. Physical Sciences Platform, Sunnybrook Research Institute, Toronto, Ontario, Canada
2. Department of Medical Biophysics, University of Toronto, Toronto, Ontario, Canada
3. Institute of Biomaterials and Biomedical Engineering, University of Toronto, Toronto, Ontario, Canada
Received 2018-1-12; Accepted 2018-3-5; Published 2018-4-16
Abstract

Focused ultrasound (FUS)-mediated blood-brain barrier (BBB) opening recently entered clinical testing for targeted drug delivery to the brain. Sources of variability exist in the current procedures, motivating the development of real-time monitoring and control techniques to improve treatment safety and efficacy. Here we used three-dimensional (3D) transcranial microbubble imaging to calibrate FUS exposure levels for volumetric BBB opening.
Methods: Using a sparse hemispherical transmit/receive ultrasound phased array, pulsed ultrasound was focused transcranially into the thalamus of rabbits during microbubble infusion and multi-channel 3D beamforming was performed online with receiver signals captured at the subharmonic frequency. Pressures were increased pulse-by-pulse until subharmonic activity was detected on acoustic imaging (psub), and tissue volumes surrounding the calibration point were exposed at 50-100%psub via rapid electronic beam steering.
Results: Spatially-coherent subharmonic microbubble activity was successfully reconstructed transcranially in vivo during calibration sonications. Multi-point exposures induced volumetric regions of elevated BBB permeability assessed via contrast-enhanced magnetic resonance imaging (MRI). At exposure levels ≥75%psub, MRI and histological examination occasionally revealed tissue damage, whereas sonications at 50%psub were performed safely. Substantial intra-grid variability of FUS-induced bioeffects was observed via MRI, prompting future development of multi-point calibration schemes for improved treatment consistency. Receiver array sparsity and sensor configuration had substantial impacts on subharmonic detection sensitivity, and are factors that should be considered when designing next-generation clinical FUS brain therapy systems.
Conclusion: Our findings suggest that 3D subharmonic imaging can be used to calibrate exposure levels for safe FUS-induced volumetric BBB opening, and should be explored further as a method for cavitation-mediated treatment guidance.
Keywords: blood-brain barrier, focused ultrasound, microbubble contrast agents, three-dimensional acoustic imaging, transmit/receive phased array
Introduction
The ability to treat brain cancers and other disorders of the central nervous system is limited by the blood-brain barrier (BBB), a specialized structure that regulates molecular passage from the circulatory system into the brain [1]. Focused ultrasound (FUS) combined with intravenously circulating microbubbles can transiently and selectively increase BBB permeability [2] to enable targeted drug delivery to the brain, and has the potential to revolutionize the way neurological diseases are managed in clinical practice [3]. Extensive pre-clinical work has shown that a wide range of therapeutic agents can be delivered to brain parenchyma using the aforementioned approach [4-6], and improved outcomes have been demonstrated in animal models of brain tumors [7-9] and Alzheimer's disease [10-13]. Based on the favorable safety profile of transcranial ultrasound-mediated BBB opening observed in large animal experiments performed using a commercial FUS brain system designed for thermal ablation [14-15], the first clinical investigations began at our institution in late 2015. Two separate safety trials have recently been completed with this extracorporeal FUS device: one for enhanced chemotherapy delivery to malignant brain tumors (ClinicalTrials.gov ID: NCT02343991) and another in patients with early Alzheimer's disease (ClinicalTrials.gov ID: NCT02986932). Concurrently, researchers in France have demonstrated that repeated BBB opening using an invasive device implanted in the brain is safe and tolerated in patients with recurrent glioblastoma [16].
Despite the many advancements made since the feasibility of BBB opening via FUS and preformed microbubbles was first demonstrated in a pre-clinical model [2], sources of treatment variability exist that need to be addressed before widespread clinical adoption can occur. The biological effects induced from the exposures are dependent on several factors, including the sonication scheme (i.e., frequency, pressure, pulse length, pulse repetition frequency (PRF), exposure duration [17-19]), the ultrasound contrast agent (i.e., microbubble type, dose, and size distribution [20-22]), as well as the carrier gas used for anaesthesia [23]. Increased microvascular permeability can be achieved without evident tissue damage upon histological examination if appropriate treatment parameters are employed [14,24-26], whereas unsuitable parameters can result in a lack of desired effect or, conversely, vascular damage [27] or inflammation [28]. However, the application of transcranial sonications complicates parameter selection, as it is difficult to predict the in-situ pressure field due to considerable inter- and intra-patient variability in skull transmission efficiency [29-30] and the potential for standing wave formation within the skull cavity [31-32]. Furthermore, the local vascular density, vessel diameter, and blood flow all vary considerably between brain structures and can affect the way in which microbubbles interact with the ultrasound field and the resulting biological outcome(s) [14,33-34]. These sources of variability, combined with the narrow window in which increased BBB permeability can be safely achieved [14,25-26], necessitate the development of real-time treatment monitoring and control techniques prior to routine clinical implementation.
Several studies have demonstrated that spectral characteristics of acoustic emissions generated during ultrasound-mediated BBB opening are correlated with the biological effects of the exposures [23,25-26,35]. For instance, it has been shown that increased vascular permeability can be achieved without detecting broadband acoustic emissions [25-26], evidence of violent inertial cavitation activity. More recently, researchers have attempted to exploit these remotely detected signals for treatment feedback purposes, in an attempt to achieve the desired biological effects while minimizing unwanted tissue damage [15,36-39]. One such approach involves calibrating exposure levels by increasing the applied pressure pulse-by-pulse until subharmonic (i.e., f0/2, where f0 is the driving frequency) or ultraharmonic (i.e., (2n+1)f0/2, n = 1,2,3…) signals are detected, and subsequently reducing the pressure to a percentage of the value required to induce this microbubble activity for the remainder of the sonication [11,37]. O'Reilly and Hynynen [37] showed that sonications carried out at the 50% target level consistently produce safe BBB opening, whereas lower target levels (i.e., 0% and 25%) are less likely to result in increased BBB permeability and gross tissue damage is observed occasionally at higher target levels (i.e., 75%). A modified version of this internal calibration approach is undergoing clinical testing using a commercial low-frequency transcranial FUS brain therapy system (ExAblate Neuro, InSightec Inc., Tirat Carmel, Israel). All of these studies have employed single-element detectors for acoustic emissions monitoring, an approach that provides bulk information regarding cavitation activity within the focal volume and precludes spatially-resolved cavitation detection over a large region due to the receiver's fixed sensitivity profile.
Spatial information regarding microbubble behavior would improve the safety of ultrasound-mediated BBB opening procedures by allowing confirmation that cavitation and its associated bioeffects are localized at the target(s) of interest, while simultaneously monitoring for potential off-target activity. Indeed, ultrasound-induced bioeffects located outside of the intended treatment region have been observed in pre-clinical studies following exposures with microbubbles in circulation [40-41], including a recent study on BBB opening [39]. When combined with beamforming techniques, multi-element sensor arrays can generate spatial information regarding acoustic source field distributions [42-44]. Multi-channel beamforming of remotely detected acoustic emissions has recently been used to monitor the spatial and temporal evolution of cavitation activity during the application of FUS in in-vitro and in-vivo settings [45-50], including BBB opening procedures via commercial one-dimensional (1D) linear receiver arrays [51-52] or custom-built two-dimensional (2D) surface arrays [53-55]. Relative to small-aperture 1D arrays, large-aperture 2D arrays allow source signals of interest to be acquired over a greater solid angle, and enable three-dimensional (3D) acoustic imaging with improvements in spatial resolution, receive sensitivity, and the effective imaging volume. In all studies published to date that have spatially mapped cavitation activity generated during ultrasound-mediated BBB opening procedures [51-55], acoustic reconstruction has been performed retrospectively offline following the application of FUS.
Here we use 3D transcranial microbubble imaging to actively calibrate exposure levels for safe ultrasound-mediated BBB opening with a multi-frequency transmit/receive sparse hemispherical ultrasound phased array. A 3D subharmonic imaging-based feedback approach was developed based on a previously described single-element detector calibration method [37], and was used to perform BBB opening in healthy rabbits over large treatment volumes via rapid electronic beam steering. A pilot study was carried out to demonstrate feasibility and explore different exposure conditions, after which a second group of animals were treated to assess the safety and efficacy of the proposed treatment paradigm.
Methods
Clinical-scale prototype FUS brain system
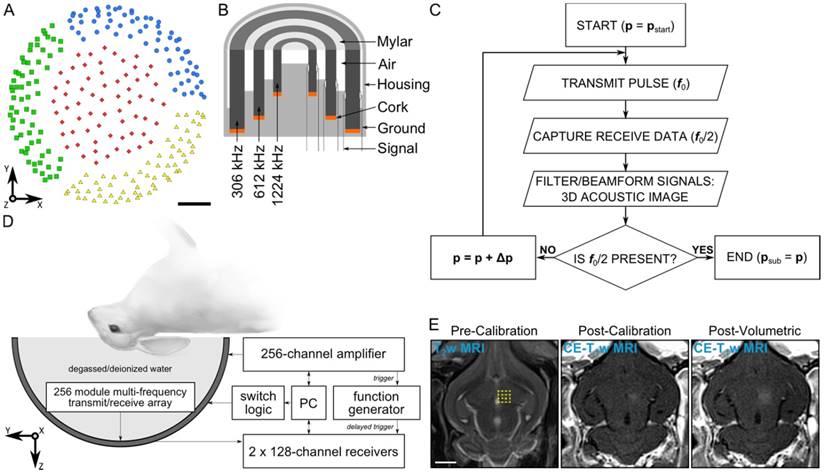
The phased array employed in this study is similar to that described in [55]. The base frame of the array was a hemispherical dome (inner diameter = 31.8 cm) that was formed by assembling four separate quadrants of plastic 3D-printed (Accura® ClearVueTM, ViperTM si2 SLA®; 3D Systems, Inc., Rock Hill, SC, USA) shells (3 top and 1 bottom, Figure 1A). 256 transducer modules were inserted into the hemispherical dome (64 per quadrant, Figure 1A) in a sparse arrangement that was optimized in silico to suppress grating/side lobe formation (Figure S1). Each module is composed of three concentric cylindrical lead zirconate titanate (PZT-4) elements (DeL Piezo Specialties, LLC, West Palm Beach, FL, USA) driven in their lateral mode [56] at frequencies of 306, 612, and 1224 kHz (Figure 1B). The individual element dimensions (Table 1) were chosen to maintain a similar transmit steering range and effective imaging volume across all three operating frequencies by fixing the ratio of the element size to the acoustic wavelength [55]. An exterior concentric ring was placed around the outer-most element of each module flush with the driving surfaces of the three elements, and thin plastic film (MylarTM; DuPont, Wilmington, DE, USA) was attached to the front surface to seal the modules and provide air loading for the cylinders. The signal and ground wires from each module were soldered to the pads on an adapter connected to a circuit board that enables switching and selection of the array's transmit and receive frequencies for a given sonication. Variable gain pre-amplifiers were added to the receive lines to help drive the signals along the cables.
Clinical-scale prototype FUS brain system and experimental protocol. (A) Transducer module layout. The array is separated into four separate quadrants (blue circles, green squares, red diamonds, and yellow triangles). Scale bar indicates 5 cm. (B) Module design schematic. (C) Process flowchart for 3D acoustic imaging-based decision making. (D) Experimental setup. (E) Illustration of experimental protocol via MRI data acquired pre-calibration, post-calibration, and post-volumetric exposure in an animal from the pilot group. Target locations for a 4 × 4 point grid (1.0 mm point spacing) overlaid on an axial T2w MR image (yellow dots). The calibration point is indicated by an '×' symbol, and the beam steering pattern is depicted (yellow line). The sonication direction is out of the page. Scale bar indicates 5 mm. p = pressure, pstart = start pressure, Δp = pressure step size, psub = subharmonic pressure threshold.
Transducer element dimensions of multi-frequency dual-mode array. Transducer element dimensions and center frequencies.
| Frequency | Outer Diameter (mm) | Inner Diameter (mm) | Height (mm) |
|---|---|---|---|
| 306 kHz | 10 | 7 | 6 |
| 612 kHz | 5 | 3.5 | 3 |
| 1224 kHz | 2.5 | 1.75 | 1.5 |
Following array construction the transducer element locations were confirmed using acoustic triangulation [53,55]. A narrowband fixed source (piezoceramic tube; 1 mm diameter, 5 mm length, 0.5 MHz center frequency) was moved to different locations in the field using a three-axis positioning system (Parker-Hannifin, Corp., Woburn, MA, USA; Velmex, Inc., Bloomfield, NY, USA) and was excited with an impulse from a pulser/receiver (Panametrics, Olympus-NDT, Inc., Waltham, MA, USA). The raw channel data received by the 612 kHz transducer elements (200 μs capture length per channel, 40 MS/s sampling rate, 128 averages) were captured using two 128-channel receivers (SonixDAQ; Ultrasonix, Inc., Richmond, BC, Canada). The time of flight inferred from each of the captured waveforms was used to estimate the center of the 612 kHz element locations via triangulation. The central locations of the 306 and 1224 kHz elements were assumed coincident with those of the 612 kHz elements due to the concentric module design. The transmit capabilities of the array (Figure S2 and Figure S3) were characterized using methods described elsewhere [55].
Animal model and study design
All experiments were performed with prior approval from the Animal Care Committee at Sunnybrook Research Institute (SRI) and were in accordance with guidelines established by the Canadian Council on Animal Care and the Animals for Research Act of Ontario. Animals were housed in the SRI animal facility (Toronto, ON, Canada) with access to food and water ad libitum. To prepare animals for FUS procedures, anaesthesia was induced via intramuscular injection of a mixture of ketamine (50 mg/kg/h) and xylazine (5 mg/kg/h). The animals were then intubated and anesthesia was maintained using 1-3% isofluorane and medical air (2 L/min). Hair on the animals' heads was removed using an electric razor and depilatory cream. The scalp was washed with mild soap and water to prevent chemical irritation from the cream. The ear vein was catheterized using a 22G angiocatheter. The animals were laid supine on a platform with their heads supported by a plastic membrane in contact with the degassed/deionized water-filled array. Degassed/deionized water provided acoustic coupling between the animal head and the membrane. The animals were positioned such that the mid-thalamic region was at most 1 cm from the hemispherical array's geometric focus. Custom-built ear/bite bars stabilized and restrained the animal's head for the duration of the experiments. The animals were ventilated mechanically during the treatment and imaging procedures, and both heart rate and oxygen saturation levels were monitored using a magnetic resonance imaging (MRI) compatible digital pulse oximeter (8600V; Nonin Medical, Inc., Plymouth, MN, USA) to help ensure an appropriate depth of anesthesia. Body temperature was maintained using multiple blankets and heated saline packs.
Thirteen New Zealand White rabbits (male, 2-4 kg; Charles River, Saint-Constance, QC, Canada) were divided into two groups. The first group (N = 8) received either a single or multiple weekly ultrasound sessions during a state of ongoing system development. The animals in this “pilot group” were sacrificed between 1 hour and 1 week after their final treatment. Based on the results obtained from this group, modifications were made to the ultrasound system's hardware and software, after which a second group of rabbits (N = 5) received a single ultrasound session with a static system configuration. The animals in this “treatment group” were survived for 1 week post-FUS, at which point they underwent follow-up MRI and were subsequently sacrificed for histological examination.
MRI sequences and data analysis
The experiments were performed under MRI guidance (see Table 2 for parameters used in this study). The platform with the animal was moved between the ultrasound system and a 3.0 T MRI system (Magnetom Prisma; Siemens Healthcare, Erlangen, Germany) for treatment planning, detecting BBB opening, and monitoring for potential tissue damage. All ultrasound exposures were performed outside of the MRI suite, as the phased array employed was not designed to be MRI-compatible. MR images were acquired using a T2-weighted (T2w) sequence for target selection and detecting edema, a T1-weighted (T1w) sequence before and after intravenous injection of a gadolinium-based MRI contrast agent (GadovistTM; Bayer Inc., Toronto, ON, Canada) to detect BBB opening, and a T2*-weighted (T2*w) sequence to monitor for red blood cell (RBC) extravasations produced by the sonications [2]. A comprehensive set of MR images (i.e., T1w/T2w/T2*w scans) was acquired at the beginning and end of each treatment session as well as during follow-up imaging, and additional contrast-enhanced T1w (CE-T1w) imaging was performed intermittently throughout the procedures. For the animals in the treatment group, 0.1 mL/kg of MRI contrast agent was injected after the first and third of four multi-point grid exposures (see below for treatment group details). All MR images were acquired using an 11 cm diameter loop coil. Post-sonication axial MRI scans were examined to determine whether increased BBB permeability (CE-T1w hyperintense), edema (T2w hyperintense), or microhemmorhage (T2*w hypointense) was produced at each individual focal spot. In quantifying increased BBB permeability, the CE-T1w MRI signal intensity was averaged over a 3 × 3 × 2 voxel region centered on each focal spot, and values exceeding two SDs above the background (i.e., unsonicated, contralateral control region) were deemed “open” [57]. Pre- and post-treatment T2w/T2*w MRI scans were compared to determine the presence (or lack thereof) of edema/microhemorrhage. No scoring metrics were necessary, as these signal changes on MRI were binary. For the animals in the treatment group, MRI quantification was carried out using scans acquired immediately following the final volumetric exposure, as well as those obtained during follow-up imaging 1 week post-treatment.
MRI parameters. T1w, T2w, and T2*w MRI sequence types and parameters employed in this study.
| T1w | T2w | T2*w | |
|---|---|---|---|
| Sequence Type | turbo spin echo | turbo spin echo | 3D gradient echo |
| Echo Time (ms) | 8.6 | 82 | 15 |
| Repetition Time (ms) | 500 | 3100 | 27 |
| Echo Train Length | 4 | 8 | 1 |
| Number of Signal Averages | 3 | 2 | 2 |
| Field-of-View (cm) | 10 × 10 | 10 × 10 | 10 × 10 × 2.4 |
| Matrix Size | 256 × 256 | 256 × 256 | 256 × 256 × 16 |
| Slice Thickness (mm) | 1.5 | 1.5 | 1.5 |
| Bandwidth (kHz) | ±62.7 | ±15.4 | ±33.3 |
| Flip Angle (°) | 150 | 150 | 13 |
Calibration procedure and treatment parameters
An acoustic imaging-based calibration approach was developed based on the single-element detector method described in [37]. A calibration algorithm adjusted the driving output of the phased array transducer driven in pulsed mode after each transmit pulse. The algorithm logic was based on the acoustic emissions captured by the multi-channel receiver array during each transmit pulse and processed prior to the subsequent exposure. After each transmit pulse, the raw channel data received by the transducer elements tuned to the subharmonic of the driving frequency were filtered and beamformed over a 3D volume to determine whether microbubble emissions originating near the intended target location were present. The driving output of the phased array was increased from pulse-to-pulse until spatially-coherent subharmonic microbubble activity was detected, at which point the sonication was terminated automatically. A flowchart outlining the calibration algorithm logic is given in Figure 1C.
Prior to in-vivo testing, algorithm functionality was verified on the benchtop by imaging microbubbles flowing in tube phantoms, using a similar experimental setup to that described previously [53-55]. The response of the program was compared with the expected response based on offline visual inspection of the 3D acoustic imaging data. Based on the results from benchtop testing with and without microbubbles flowing through the tubing, the threshold for the algorithm to register the detection of subharmonic activity was a peak sidelobe ratio of less than or equal to -3 dB. This peak sidelobe ratio threshold was found to be sufficiently low as to prevent false-positive detection events from occurring due to background noise fluctuations, while not so high as to miss weak subharmonic microbubble activity.
The in-vivo experimental setup is shown in Figure 1D. All ultrasound exposures were applied through the intact rabbit skull without aberration correction on transmit or receive. Insertion loss measurements were performed on 4 rabbit skull caps at f0 = 612 kHz following tissue harvest by driving a single transducer module with a function generator (AFG3102; Tektronix, Inc., Richardson, TX, USA) and comparing the spatial-peak temporal-peak (SPTP) negative voltage received by a narrowband fixed source, captured using a digital oscilloscope (TDS3014C; Tektronix, Inc., Richardson, TX, USA), with and without an intervening skull sample. Measurements were carried out at a total of 16 locations across the 4 specimens (4 measurements per specimen), and a transmission of 68 ± 11% was obtained (mean ± SD). All SPTP negative pressures reported in this study are estimated in situ based on this mean transmission value, an attenuation coefficient in brain tissue of 5 Np/m/MHz [58], a mean path length in brain tissue of 10 mm, and the geometric steering loss estimated from the transmit characterization data (Figure S3 and Table S1) assuming a radially-symmetric lateral steering profile (i.e., pin-situ ≈ 68% × exp{-5 Np/m/MHz × 0.01 m × 0.612 MHz} pfree-field = 0.66% pfree-field).
Prior to each therapeutic exposure, a calibration sonication was carried out to determine the peak negative pressure threshold for inducing subharmonic activity in vivo near the desired target location. Calibration sonications consisted of focusing to a single point within the brain and applying 10 ms pulses of 612 kHz ultrasound at a 1 Hz PRF. DefinityTM microbubbles (20 μL/kg) were diluted in normal saline and infused through an extension line (length = 30 cm, inner diameter = 1.2 mm) connected to the ear vein catheter using an automated syringe pump (NanoJetXF Stereotaxic Syringe Pump; Chemyx, Inc., Stafford, TX, USA). The microbubble solution was infused over 60 s by pushing saline through the line beginning simultaneously with the start of each calibration sonication. On receive, 3.2 ms of channel data at the tail end of each pulse (trigger delay = 7.2 ms, sampling rate = 10 MS/s) was acquired using two 128-channel receivers (SonixDAQ; Ultrasonix, Inc., Richmond, BC, Canada) and the array elements tuned to the subharmonic of the driving frequency (f0/2 = 306 kHz). Before the start of the next therapy pulse, the acquired channel data were transferred from the acquisition system into memory, zero-phase digital bandpass filtered to suppress strong reflection signals at the fundamental and emphasize the subharmonic spectral content (eighth order Butterworth, 200-400 kHz passband), and beamformed over a 3D volume centered about the target location (field-of-view (FOV) = 10 mm × 10 mm × 10 mm, voxel size = 1.0 mm × 1.0 mm × 1.0 mm) on a GPGPU (ZOTAC GeForce GTX 980 Ti, 6 GB memory, 2816 cores) using a delay, sum, and integrate beamforming algorithm [54-55]. The sound speed used in the beamforming algorithm was estimated based on measurement of the water temperature [59], and ranged from 1480-1500 m/s. Temporal-average source field intensity volumes were generated using all of the channel data acquired during each pulse (e.g., 3 ms integration time during calibration). Starting from an estimated SPTP negative pressure of 10-15 kPa, the pressure level was linearly increased after each pulse (step size ≈ 10-15 kPa) until the appearance of a single distinct source was observed in the acoustic imaging data (peak sidelobe ratio ≤ -3 dB), at which point the calibration sonication was terminated automatically. The received channel data from the calibration sonication were captured and stored for offline analysis. This process was also carried out prior to the first microbubble injection in each animal to gather baseline signals.
Following calibration, tissue volumes surrounding the calibration point were exposed at a fixed percentage of the peak negative pressure required to induce subharmonic activity via rapid electronic steering. The ultrasound focus was steered over a rectilinear grid of points centered near the calibration point in a plane perpendicular to the array's acoustic axis (Figure 1E). Each point within the grid was exposed with 10 ms pulses of 612 kHz ultrasound at a 1 Hz PRF for a total of 2 min [35] starting simultaneously with microbubble infusion (20 μL/kg, 60 s duration). The beam steering was performed in a clockwise spiral pattern (viewed looking into the dome) starting with the calibration point (Figure 1E). Throughout the volumetric sonications, acoustic emissions data were captured using the array elements tuned to the subharmonic frequency and stored for post-processing. In the pilot group, channel data were captured solely at the calibration point, using the same settings employed during calibration (see above). In the treatment group, channel data were acquired at each point within the grid, though the allowable capture length was restricted by the maximum available buffer size and transfer rate of the data acquisition system [60]. For each volumetric sonication in the treatment group (36 points per grid, 120 pulses per point), 750 μs of channel data were captured at the tail end of each pulse (trigger delay = 9.5 ms, sampling rate = 10 MS/s) at each point within the grid. A delay of at least 5 min between successive grid sonications allowed the bubbles to mostly clear from the circulation (mean half-life of DefinityTM = 1.3 min, product insert).
In the pilot group, a total of 29 volumetric sonications were carried out over 10 different treatment sessions (3 ± 2 sonications per session, mean ± SD) in eight animals. In this group, variable grid sizes (16-36 points), point spacings (0.5-2.0 mm), and target levels (50-100%) were investigated. All five animals in the treatment group received a single ultrasound session consisting of four non-overlapping grids (6 × 6 point grids, 1.0 mm spacing) unilaterally targeted to the mid-thalamic region that were all carried out at the 50% target level. Combining the two groups, a total of 49 calibration sonications were available for analysis.
Retrospective analysis of acoustic emissions data
Retrospective analysis of the acoustic emissions data acquired in vivo was performed offline post-treatment. Large FOV reconstructions spanning the entire skull cavity were carried out (FOV = 40 mm × 40 mm × 40 mm; voxel size = 0.5 mm × 0.5 mm × 0.5 mm) to verify that no cavitation activity was missed using the imaging parameters employed online during calibration (FOV = 10 mm × 10 mm × 10 mm; voxel size = 1.0 mm × 1.0 mm × 1.0 mm). The impact of imaging array design (i.e., receiver element number and spatial configuration) on the system's ability to identify spatially-coherent subharmonic activity was also investigated retrospectively. For this analysis, acoustic emissions data from the treatment group (20 calibration sonications over 5 animals) were reconstructed (FOV = 10 mm ×10 mm × 10 mm; voxel size = 0.5 mm × 0.5 mm × 0.5 mm) using arrays of different levels of sparsity ranging from 16 to 256 elements. The receiver elements were divided equally amongst the four quadrants of the array, and for each level of sparsity 500 distinct configurations were tested. The detection sensitivity (i.e., true positive rate) and specificity (i.e., true negative rate) of each receiver configuration were evaluated taking the results obtained from beamforming using the entire receiver array (i.e., 256 elements) as ground truth.
Histological analysis
Animals were perfused transcardially with saline followed by 10% neutral buffered formalin. Brains were removed, postfixed overnight at room temperature, and paraffin embedded. Axial sections (5 μm thick) were collected at 250 μm intervals and hematoxylin-eosin (H&E) stained. Sections at the plane of increased BBB permeability were assessed at 200x magnification for evidence of microhemorrhage, defined for the purpose of this study as regions of extravasated RBCs with a long axis greater than 20 μm in length. Anatomical landmarks visible on both the MRI and histological data (e.g., ventricular width, hippocampal shape) were used to select H&E sections corresponding to regions of CE-T1w MRI signal enhancement for assessment.
Results
3D transcranial subharmonic microbubble imaging in vivo
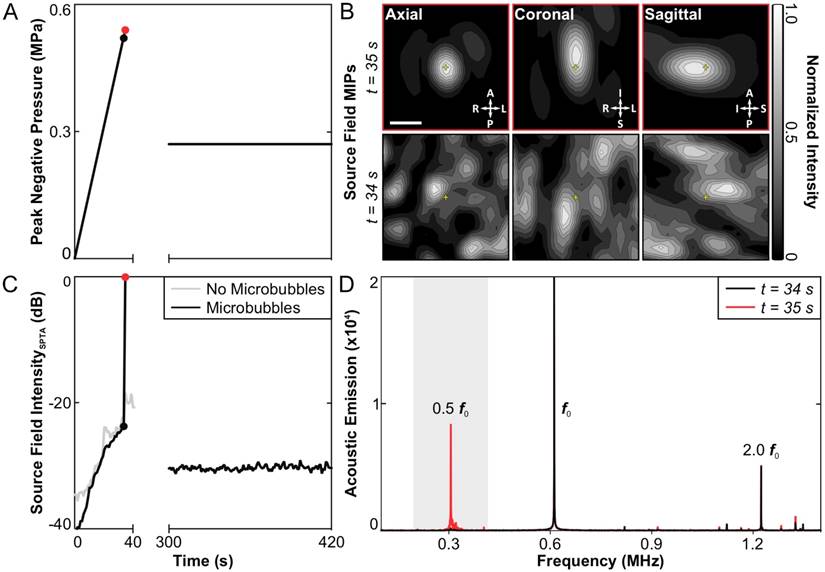
No subharmonic activity was detected during any of the baseline sonications carried out without microbubbles in circulation. Under this condition, the applied peak negative pressure continued to rise for 60 s until the maximum output of the system was reached (~1.0 MPa), at which point the sonication was terminated manually. Subsequently, spatially-coherent subharmonic activity was successfully detected through the intact rabbit skull in vivo via 3D acoustic imaging during all calibration sonications carried out with microbubbles in circulation (N = 49). Figure 2 shows an example of the 3D subharmonic microbubble imaging calibration approach prior to a therapeutic exposure at the 50% target level. In this dataset, the SPTP negative pressure level (Figure 2A) is seen to increase until 35 s into the sonication (0.54 MPa), at which point spatially-coherent subharmonic microbubble activity is detected (Figure 2B). Examining the acoustic imaging data corresponding to this pulse, a substantial increase is seen in the spatial-peak temporal-average (SPTA) source field intensity (Figure 2C) relative to both the previous pulse (0.52 MPa, ~24 dB increase) and to baseline (i.e., sonication at 0.54 MPa without microbubbles, ~18 dB increase), and pronounced subharmonic spectral content is present in the beamformed signal at the location of SPTA source field intensity that is not present in corresponding data for the pulse 34 s into the sonication (Figure 2D).
3D transcranial subharmonic microbubble imaging in vivo. (A) Estimated in-situ SPTP negative pressure as a function of time during a calibration sonication with microbubbles and subsequent therapeutic exposure at the 50% target level in an animal from the treatment group (f0 = 612 kHz). (B) Normalized maximum intensity projection (MIP) contour images (linear contours at 10% intervals) of temporal-average source field intensity volume distributions for the pulses 34 s (SPTP negative pressure = 0.52 MPa, no subharmonic activity) and 35 s (SPTP negative pressure = 0.54 MPa, subharmonic activity) into the calibration sonication. The received signals were captured using elements tuned to the subharmonic frequency (f0/2 = 306 kHz). The imaging FOV is centered on the target location (yellow '+' symbols). Scale bar indicates 2.5 mm. (C) SPTA source field intensity from the 3D acoustic reconstructions obtained for each pulse during the calibration sonication and subsequent therapeutic exposure shown in (A). Baseline values from a pressure ramp at the same target location acquired without microbubbles in circulation are also shown. (D) Frequency spectrum of the unfiltered beamformed signal at the location of SPTA source field intensity for the pulses 34 and 35 s into the calibration sonication. The shaded region illustrates the bandwidth of the zero-phase digital bandpass filter applied prior to beamforming.
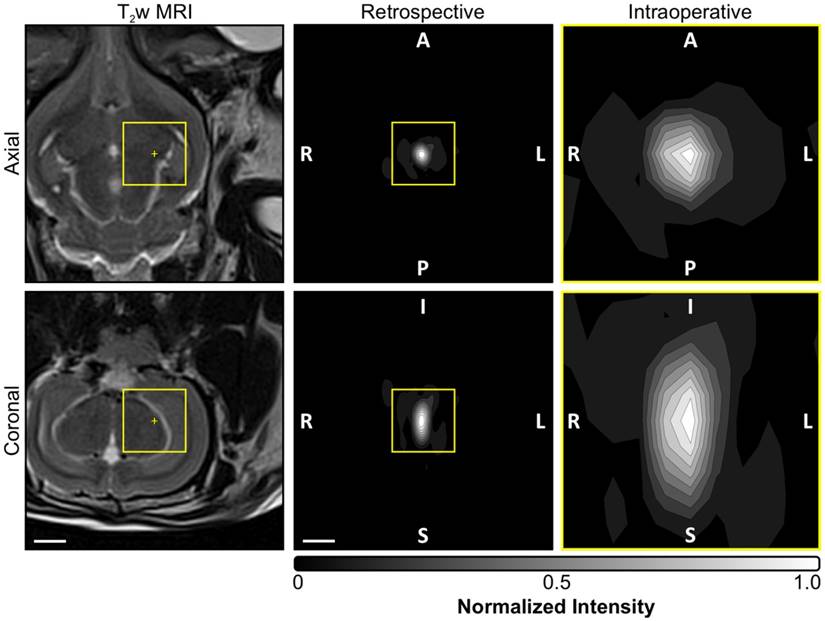
A summary of the acoustic imaging data from all in-vivo calibration sonications is provided in Table 3. The estimated SPTP negative pressure threshold for detecting subharmonic activity was 0.68 ± 0.15 MPa in situ (mean ± SD). Retrospective, large FOV acoustic reconstructions spanning the entire skull cavity (e.g., see Figure 3) revealed that whenever subharmonic activity was detected the location of SPTA source field intensity was no more than 3.0 mm from the intended target location (0.7 ± 0.5 mm, mean ± SD), and confirmed that no earlier cavitation activity was missed using the imaging settings employed intraoperatively during calibration (N = 49, data not shown). During pulses for which subharmonic microbubble activity was detected, the size of the -3 dB SPTA source field intensity volume's long axis (i.e., along the array's acoustic axis: 5.4 ± 0.5 mm, mean ± SD) was approximately a factor of two larger than its short axis (i.e., across the array's acoustic axis: 3.0 ± 0.5 mm, mean ± SD), which is expected due to the hemispherical receiver array geometry and is consistent with previous findings [53-55,61].
Summary of acoustic imaging data for pulses with subharmonic activity. The peak negative pressure subharmonic threshold (psub) values are in-situ SPTP estimates. The image metric values (positional error, -3 dB main lobe beamwidths) are based on offline, retrospective reconstructions (FOV = 10 mm × 10 mm × 10 mm, voxel size = 0.25 mm × 0.25 mm × 0.25 mm). Positional error is defined as the distance between the location of SPTA source field intensity and the intended target. The main lobe beamwidths (short/long axis sizes) are calculated based on 3D ellipsoidal fits of -3 dB source field intensity isosurfaces.
| Mean ± SD | Minimum | Maximum | |
|---|---|---|---|
| psub (MPa) | 0.68 ± 0.15 | 0.40 | 1.00 |
| Detection Time (s) | 47 ± 10 | 30 | 65 |
| Steering Distance (mm) | 10 ± 4 | 4 | 18 |
| Steering Factor (%) | 89 ± 4 | 78 | 97 |
| Positional Error (mm) | 0.7 ± 0.5 | 0 | 3.0 |
| -3 dB Main Lobe Short Axis (mm) | 3.0 ± 0.5 | 2.2 | 3.9 |
| -3 dB Main Lobe Long Axis (mm) | 5.4 ± 0.5 | 4.6 | 6.6 |
Acoustic imaging settings employed intraoperatively and for retrospective analysis. Normalized MIP contour images (linear contours at 10% intervals) of temporal-average source field intensity volume distributions corresponding to a pulse with subharmonic microbubble activity (f0/2 = 306 kHz). MIPs are shown for the imaging settings (i.e., FOV and voxel size) employed intraoperatively during calibration (yellow boxed regions, FOV = 10 mm × 10 mm × 10 mm, voxel size = 1.0 mm × 1.0 mm × 1.0 mm) as well as those used for retrospective analysis offline (FOV = 40 mm × 40 mm × 40 mm, voxel size = 0.5 mm × 0.5 mm × 0.5 mm). T2w MR images from the same animal acquired pre-sonication are shown for scale. The acoustic imaging data corresponds to the final pulse of the calibration sonication for the anterior/inferior-most treatment volume depicted in Figure 6A. The target location is overlaid on the T2w MR images (yellow '+' symbols). The sonication direction is out of the page (bottom-to-top) when viewing axial (coronal) planes. Scale bars indicate 5 mm.
No subharmonic microbubble activity was detected during any of the multi-point exposures carried out at the 50% target level (5 animals × 4 grids/animal × 36 points/grid × 120 pulses/point = 86,400 pulses in the treatment group). The data shown in Figure 2C are representative in that the SPTA source field intensity values for a given grid point remained near baseline (i.e., value obtained during sonication at same target and pressure level without microbubbles) over the entire sonication duration.
Variable point spacing during multi-point exposures
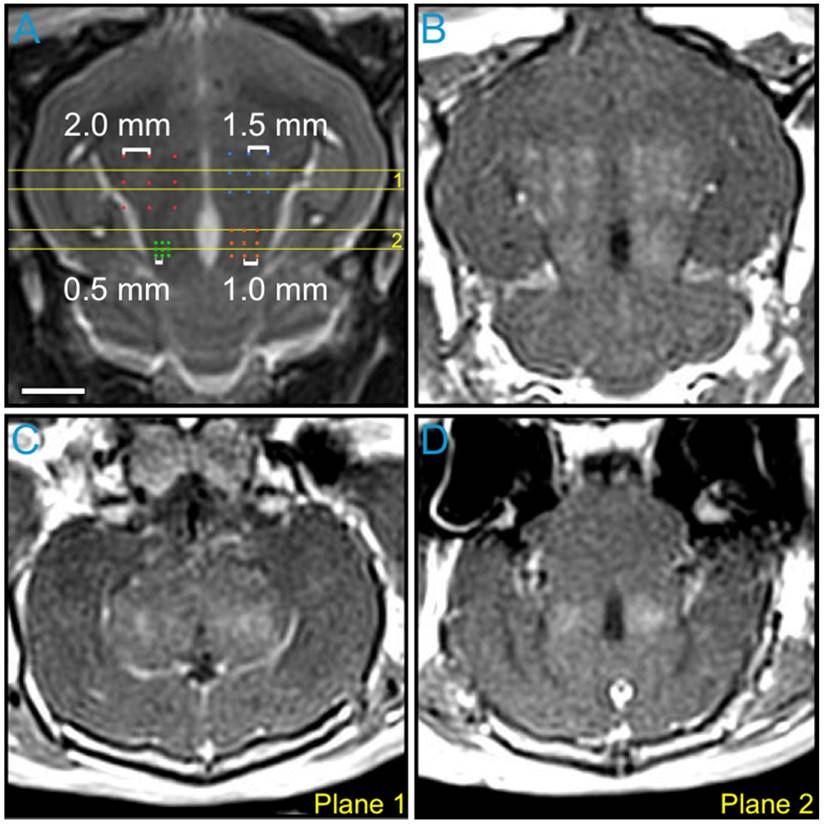
The impact of point spacing for multi-point BBB opening exposures at a transmit frequency of 612 kHz was investigated in the first rabbit of the pilot group (Figure 4). Four multi-point grids with point spacings ranging from 0.5-2.0 mm were arranged in the same axial plane (Figure 4A) and sonicated at each grid's respective 75% target level. Post-sonication CE-T1w MRI scans depicted increased BBB permeability levels relative to baseline (i.e., pre-sonication) within each of the targeted regions (Figure 4B-D). Visible drops in image intensity between grid points were observed for spacings of 1.5 mm and above, whereas a more uniform enhancement pattern was observed for spacings of 1.0 mm and below (Figure 4B and Figure S4A). This process was repeated in a more superior, non-overlapping axial plane in the same animal. Based on these data, a point spacing of 1.0 mm was chosen for all subsequent multi-point exposures, as it provided the best compromise between the BBB opening volume (Figure S4B) and the enhancement uniformity (Figure S4C).
Variable point spacing during multi-point exposures via electronic steering. Variable point spacing during multi-point BBB opening exposures (f0 = 612 kHz) was investigated in the first animal from the pilot group. Four 3 × 3 grids were sonicated with point-to-point spacings of 0.5 mm (green), 1.0 mm (orange), 1.5 mm (blue), and 2.0 mm (red). Each grid was sonicated at its respective 75% target level, based on calibration sonications carried out at the central grid point ('×' symbols). (A) Target locations overlaid on an axial T2w MR image. (B) Axial CE-T1w MR image depicting BBB opening within each targeted volume. Coronal CE-T1w MR images intersecting the two (C) anterior- and (D) posterior-most grids. The coronal slice volumes are indicated on the axial T2w MR image in (A) by the horizontal yellow lines (Planes 1 and 2). The sonication direction is out of the page in (A-B) and bottom-to-top in (C-D). Scale bar indicates 5 mm.
Multi-point exposures enable large volume BBB opening
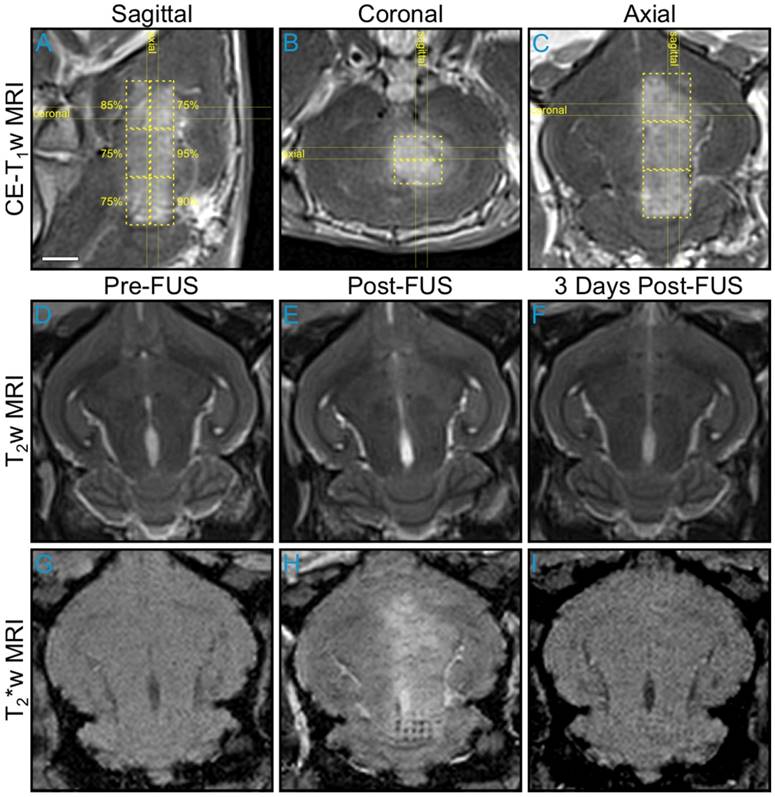
An example of large volume BBB opening in an animal from the pilot group is shown in Figure 5. Six non-overlapping multi-point grids (6 × 6 points per grid, 1.0 mm spacing) were sonicated at target levels ranging from 75-95%. Increased levels of BBB permeability (relative to the unsonicated contralateral tissue) were induced within each targeted region, and the resulting volume of opening was assessed via CE-T1w MRI to be approximately 850 mm3 (Figure 5A-C). No obvious regions of signal hyperintensity induced by the sonications were visible on T2w MRI scans acquired both immediately post-sonication (Figure 5D-E) and prior to animal sacrifice 3 days post-FUS (Figure 5F). Regions of signal hypointensity that were not present pre-treatment can be seen on corresponding T2*w MRI scans acquired immediately post-sonication, particularly in the posterior-most target volume where a clear grid pattern is apparent within a subset of the treated region (Figure 5G-H). Follow-up MRI scans taken 3 days post-FUS indicated that the T2*w hypointensities had been reduced in number and were less apparent at this time in terms of levels of signal intensity reduction relative to unsonicated tissue (Figure 5I). Histological examination in this animal confirmed the presence of extravasated RBCs in the sonicated hemisphere at the 3 day time point, including regions that were exposed at the 75% target level (data not shown).
Multi-point exposures enable large volume BBB opening. Example of large volume ultrasound-mediated BBB opening and tissue damage in an animal from the pilot group, assessed via MRI. Six non-overlapping grids (6 × 6, 1.0 mm point spacing) were sonicated at target levels ranging from 75-95%. (A) Sagittal, (B) coronal, and (C) axial CE-T1w MR images depicting increased BBB permeability within each targeted volume (yellow dashed regions, total volume ≈ 850 mm3). The target levels for each grid are labeled in (A). The horizontal and vertical yellow lines in (A-C) indicate the imaging slice volumes for the two orthogonal planes. The CE-T1w MR images were acquired immediately following sonication of the sixth multi-point grid. Four MRI contrast agent injections (4 × 0.1 mL/kg) had been administered in this animal over the course of 90 min at the time of image acquisition. Axial T2w MR images acquired (D) pre-, (E) 20 min post-, and (F) 3 days post-FUS. No obvious regions of T2w MRI signal hyperintensity induced by the exposures were present in this animal. Axial T2*w MR images acquired (G) pre-, (H) 15 min post-, and (I) 3 days post-FUS. Regions of T2*w MRI signal hypointensity induced by the exposures are apparent, particularly in the posterior-most grid (H-I), which was sonicated at the 90% target level. The sonication direction is out of the page, bottom-to-top, and right-to-left when viewing axial, coronal, and sagittal MR images, respectively. Scale bar indicates 5 mm.
Exposures at 50% of subharmonic pressure threshold are safe
A representative MRI dataset from an animal in the treatment group is given in Figure 6A. In this animal, four separate multi-point grids (6 × 6 points per grid, 1.0 mm spacing) were sonicated at each grid's respective 50% target level. Increased BBB permeability (relative to the unsonicated contralateral tissue) was observed within each of the targeted regions on CE-T1w MRI, and no regions of signal hypointensity induced by the sonications were found on corresponding T2*w MRI scans.
Volumetric exposures at 50% of the subharmonic pressure threshold are safe. (A) Example MRI datasets from an animal in the treatment group (Rabbit #1 in (B). Four non-overlapping grids (6 × 6, 1.0 mm spacing) were sonicated at each grid's respective 50% target level. Axial (left) and coronal (center) CE-T1w MR images depict increased BBB permeability within the targeted volumes (yellow dashed regions, total volume ≈ 300 mm3). No regions of T2*w MRI signal hypointensity induced by the sonications were observed in this animal (right, axial slice corresponding to CE-T1w data). The MR images were acquired immediately following sonication of the fourth multi-point grid. Scale bar indicates 5 mm. (B) BBB opening volume and CE-T1w MRI signal enhancement for each grid sonicated within the treatment group, along with an average value for each rabbit. The individual grid values are presented left-to-right in the order of sonication. Error bars denote one standard deviation. (C) MRI and H&E data from the only animal in the treatment group for which abnormalities were observed on histology 1 week post-FUS. One small region (largest dimension < 50 μm) of extravasated RBCs within a single focal spot (white arrow) was found on H&E stained slices obtained 1 week post-FUS. The tissue otherwise appears normal and resembles the contralateral, unsonicated control region. Both regions on histology are overlaid on axial CE-T1w and T2*w MRI scans (red and black boxes). The scale bars for the MRI and H&E data indicate 5 mm and 400 μm, respectively. The sonication direction is out of the page (bottom-to-top) when viewing axial (coronal) MR images.
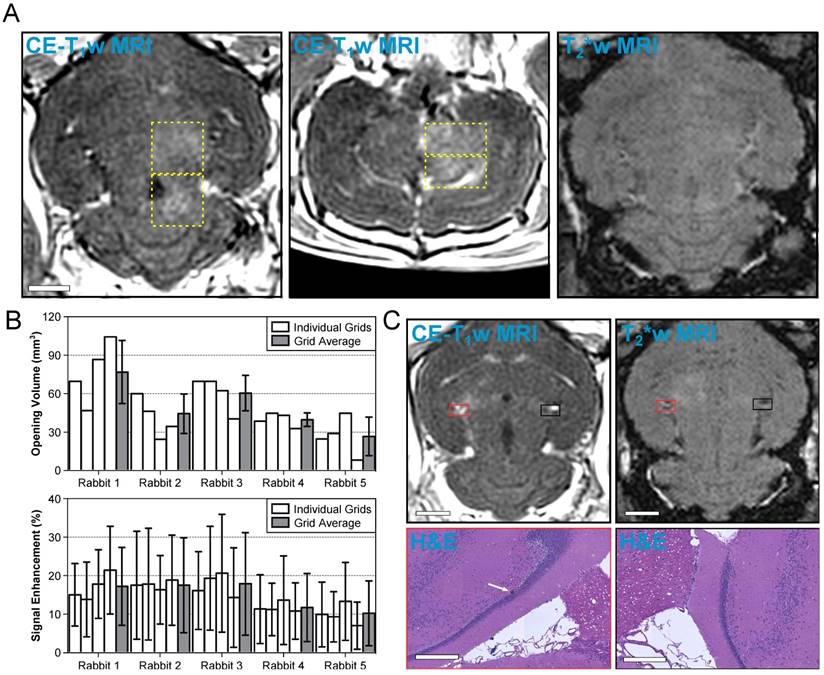
A summary of the CE-T1w MRI data from each multi-point grid sonicated in the treatment group is provided in Figure 6B. BBB opening was observed in each of the sonicated regions, though substantial inter- and intra-subject variability was observed. Across the 20 grids of the treatment group, the mean volume of BBB opening and mean signal enhancement were 48 ± 23 mm3 and 15 ± 10%, respectively (mean ± SD). Table 4 provides a summary of each individual focal spot from the treatment group (N = 720). BBB opening was observed immediately post-sonication in approximately 50% of all exposed foci, none of which remained open 1 week following FUS. Signal hyperintensities on T2w MRI were seen in less than 2% of all foci immediately post-sonication, all of which resolved 1 week following FUS. No instances of signal hypointensities on T2*w MRI scans were observed in this group of animals. Considering only the subset of focal spots corresponding to calibration points (N = 20) the success rate of inducing BBB opening was 100%, and no abnormalities were observed on T2w or T2*w MRI scans acquired either immediately following or 1 week post-FUS at these locations.
Summary of MRI and histological findings from treatment group. Individual focal spot analysis of MRI and histological data from the treatment group. 5 animals each received 4 non-overlapping 36-point grid exposures at the 50% target level (i.e., N = 720 focal spots total, N = 20 calibration points).
| Time Post-FUS | CE-T1w Hyper | T2w Hyper | T2*w Hypo | RBC Extravs | |
|---|---|---|---|---|---|
| All Focal Spots | 0 days | 336 (46.6%) | 12 (1.6%) | 0 | N/A |
| (N = 720) | 1 week | 0 | 0 | 0 | 1 (0.1%) |
| Calibration Points | 0 days | 20 (100%) | 0 | 0 | N/A |
| (N = 20) | 1 week | 0 | 0 | 0 | 0 |
Hyper: hyperintense; Hypo: hypointense; Extravs: extravasations.
In 19 of 20 volumetric sonications in the treatment group, no changes were found on histology compared to the contralateral, unsonicated control region. Within the remaining volumetric sonication, one small region (largest dimension < 50 μm) of extravasated RBCs was observed in the perivascular space of a single focal spot (Figure 6C). The focal spot did not correspond to the grid's calibration point. This area of extravasated RBCs occured in a region that was hyperintense on CE-T1w MRI immediately post-sonication yet void of obvious signal changes on T2*w imaging both immediately following and 1-week post-FUS.
Array design affects system detection sensitivity
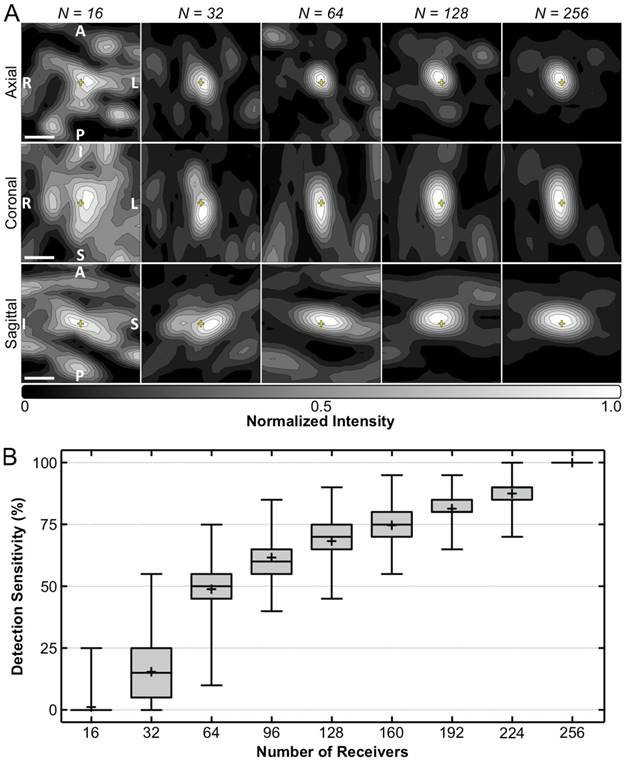
Figure 7A shows temporal-average source field intensity data corresponding to a pulse during calibration containing subharmonic microbubble activity in vivo, reconstructed retrospectively using receiver arrays with different element counts. The image quality obtained in vivo (e.g., positional error, -3 dB volume, peak sidelobe ratio, image SNR) was found to degrade with decreasing element count (Figure S5). The system's in-vivo subharmonic detection sensitivity was found to increase monotonically with increasing element count (Figure 7B). Poor detection performance was observed at the lowest level of sparsity investigated (e.g., maximum sensitivity of 25% with 16 receivers). A high degree of variability in detection sensitivity was found for a given level of sparsity (e.g., range = [10,75]% with 64 receivers), demonstrating a large spread in performance of different array configurations with the same number of receiver elements. The detection specificity was 100% for each receiver element number investigated; that is, the only cases where subharmonic activity was detected retrospectively were during pulses for which it was detected during calibration (i.e., using all 256 receivers).
Array sparsity and receiver element configuration affect image quality and detection sensitivity in vivo. (A) Normalized MIP contour images (linear contours at 10% intervals) of temporal-average source field intensity volume distributions from a pulse during calibration containing subharmonic microbubble activity (f0/2 = 306 kHz), reconstructed (FOV = 10 mm × 10 mm × 10 mm, voxel size = 0.5 mm × 0.5 mm × 0.5 mm) using receiver arrays with varying levels of sparsity (N = number of receivers). Representative dataset from an animal in the treatment group. The yellow '+' symbols denote the target location. Scale bars indicate 2.5 mm. (B) Box and whisker plots of the FUS systems's in-vivo subharmonic detection sensitivity for different levels of receiver array sparsity (20 calibration sonications over 5 animals from the treatment group, 500 distinct element configurations per level of sparsity). The error bars, '+' symbol, horizontal line, and boxed region denote the minimum/maximum, mean, median, and interquartile range values, respectively.
Discussion
We report on the feasibility of using 3D transcranial subharmonic imaging to calibrate exposure levels for safe volumetric BBB opening in healthy rabbits with a clinical-scale prototype transmit/receive ultrasound phased array. In our animal model, we were able to drive microbubbles to the point of generating subharmonic emissions without causing damage to the brain. Results from sonications carried out at target levels of 75% and above (Figure 5) suggest that repeated exposures at such pressures may be damaging to brain tissue, causing extensive microhemorrhage within the targeted region. The presence of such petechiae are undesirable, as they can be indicative of mild vascular damage or weakening of the vessel walls that can eventually lead to ischemic damage as a result of a compromised blood supply, though their impact on the brain may be minimal. Previous studies looking for ischemia or apoptosis following ultrasound-mediated BBB opening failed to detect anything more than a few individual damaged neurons, despite the presence of extravasated erythrocytes within the sonicated volumes [24,62]. Exposures at the 50% target level were safely performed (Figure 6), with few cases of edema and no evidence of microhemorrhage immediately post-sonication via MRI. Follow-up MRI 1 week post-FUS showed no remaining edema, and histological analysis at this time point revealed normal tissue apart from a small (largest dimension < 50 μm) region of perivascular RBC extravasations in 1 of 20 volumetric sonications from the treatment group that appeared to be below the detection limit of our T2*w MRI sequence (Table 4). With these treatment parameters (i.e., pulsing scheme, microbubble type/dosage/administration), target levels above 50% should therefore be avoided in the context of ultrasound-mediated BBB opening, as they may result in unwanted damage to brain parenchyma. These findings are in good agreement with previous work that employed a single-element detector for exposure control and a spherically-focused transducer for therapy delivery using a similar transmit pulsing scheme [37].
For the transmit frequency employed in this work (f0 = 612 kHz), a point-to-point spacing of 1.0 mm provided the best compromise between BBB opening volume and enhancement uniformity during volumetric exposures, as assessed by CE-T1w MRI using GadovistTM (Figure 4). This value corresponds to a grid point spacing of approximately 0.4λ, which is in line with previous studies that have employed a commercial low-frequency (f0 = 220-230 kHz) transcranial FUS brain system for volumetric BBB opening (e.g., 0.3λ in [14] and 0.5λ in [15], where λ denotes the acoustic wavelength). This data will help inform future multi-point exposure schemes for increasing the treatment volume during ultrasound-mediated BBB opening procedures, a necessity for clinical translation of the technique in the context of cerebral drug delivery for both brain tumors and neurodegenerative diseases.
Although single-point sonications carried out with the pulsing scheme and pressure levels employed here correspond to SPTA power levels that are approximately two orders of magnitude lower than those required to produce thermal damage in brain tissue [2], the application of multi-point grid exposures raises safety concerns regarding the potential for heat accumulation due to the increased ultrasound duty cycle. Ray-acoustic simulations carried out with our hemispherical array and volumetric sonication scheme (i.e., 6 × 6 point grid, 1.0 mm spacing) predicted an elevation in the SPTA power by a factor of 1.77 relative to the corresponding single-point case. Extrapolating the in-vivo data presented in [2] assuming a linear relationship between focal temperature and applied acoustic power, volumetric exposures at the highest pressure employed in this study (i.e., 1.0 MPa in situ, Table 3) are estimated to produce a SPTP temperature elevation in the brain of less than 0.05 °C for a 20 s sonication duration. The heat accumulation in the brain resulting from our 120 s duration volumetric exposure scheme is therefore expected to be negligible in practice. However, the potential for heat accumulation in the skull bone during such multi-point exposures exists, though it could not be monitored in the current study since the FUS device was not MRI-compatible. Trans-human skull multi-point exposures carried out using a commercial FUS brain system (f0 = 230 kHz, 3 × 3 grid, 3.0 mm spacing, effective duty cycle = 6.7%, 50 s duration) have been shown not to result in any appreciable skull heating [15], and future work will aim to evaluate the extent of cranial heating with our treatment parameters (f0 = 612 kHz, 6 × 6 grid, 1.0 mm spacing, effective duty cycle = 36%, 120 s duration).
Multi-point exposures at 50% of the pressure required to induce spatially-coherent subharmonic activity in vivo led to volumetric BBB openings in all animals, though substantial inter- and intra-subject variability was seen on CE-T1w MRI (Figure 6B). This observed variability is most likely due to the fact that calibration of the subharmonic pressure threshold was only carried out at one point within each treatment grid and was assumed to hold constant at surrounding grid points. Local differences in cerebral vascularity or in the in-situ peak negative pressure (e.g., due to spatially-varying skull aberrations) across each grid were thus not accounted for with this approach. Similar variability was also apparent on T2*w MRI, an example of which is seen in Figure 5H where a subset of all 36 grid points are hypointense post-sonication in the posterior-most treatment region shown. This intra-grid variability observed on MRI strongly suggests that exposure levels needs to be independently controlled at each grid point, and future experiments will investigate multi-point subharmonic calibration in an attempt to obtain more consistent treatment outcomes.
While this work demonstrates the feasibility of using 3D subharmonic imaging to calibrate exposure levels for large volume BBB opening without significant impacts on brain health (as assessed by T2/T2*w MRI and H&E histology), further research is needed to determine the safety of repeated large volume openings. Previous work in rodents has shown evidence of astrogliosis that persists for at least 4 days following sonication [63]. It is possible that the impact of increasing treatment volumes may exacerbate the magnitude and/or duration of this effect. However, BBB closure time has previously been shown to be independent of opening volume [57], which may suggest that the impact on astrogliosis would similarly be independent of opening volume. In addition, a recent study of repeated large volume openings in aged canines suggests that a treatment frequency and repetition number of 7 days and 4 treatments, respectively, does not result in altered microglia “load” two weeks following the last sonication [64]. Nevertheless, further work in this regard is paramount for advancing ultrasound-mediated drug delivery for brain disorders that may require repeated large volume openings.
Similarly, the concentration of therapeutics achievable within the targeted volumes using this general treatment approach warrants further study. Previous work has shown that concentrations of doxorubicin [65] and Herceptin [66] achieved in vivo are correlated with CE-T1w MRI signal enhancement and that the size of molecule delivered impacts the amount that crosses the BBB following sonication [67]. However, these conclusions are based on small volume openings and it is currently unclear whether this relationship would endure for larger volume openings. Moreover, given the dependence on experimental procedures (e.g., contrast agent type and injection protocol, imaging timing and sequence parameters), it is difficult to compare the levels of MRI signal intensity increase observed here (mean = 15%, Figure 6B) to previous work. Further investigations into the pharmacokinetics of specific drugs, as well as the influence of opening volume, are warranted.
Retrospective, large FOV reconstructions of the acoustic emissions data revealed that when subharmonic activity was detected the location of SPTA source field intensity was separated from the intended transmit focal location by at most 3.0 mm (Table 3). This finding is important as it suggests that large reconstruction volumes may not be necessary to apply these beamforming methods for guiding ultrasound-mediated BBB opening procedures, at least with the calibration approach employed in this work. The large FOV reconstructions presented here (Figure 3) took over 300 times longer to compute than those reconstructed intraoperatively during calibration (i.e., 27.1 s vs. 8.5 x 10⁻² s), despite the use of a computationally efficient beamforming algorithm that was parallelized and run on a GPGPU [54]. The reconstruction time places a theoretical upper bound on the rate at which pulses can be delivered if acoustic imaging-based feedback is to be carried out on a pulse-by-pulse basis, a limit that becomes increasingly restrictive in treatment scenarios where multi-point grid exposures and/or high PRFs (per spatial target) are desired. Our data suggest that with this calibration approach the use of small imaging FOVs centered on the intended target location (i.e., 10 mm × 10 mm × 10 mm), along with coarse voxel sizes (i.e., 1.0 mm × 1.0 mm × 1.0 mm), can reduce reconstruction times substantially without missing cavitation events.
Although the data reported here indicate that small FOV reconstructions may be sufficient for acoustic imaging-based feedback during ultrasound-mediated BBB opening, for general clinical implementation it would be desirable to reconstruct microbubble activity within the entire human skull cavity (mean volume ≈ 10 cm × 14 cm × 16 cm for 4 ex-vivo human skulls in our laboratory) in real-time during the treatments to ensure that no off-target cavitation activity is occurring. For example, cavitation activity can occur outside of the intended focal volume in the brain due to the formation of standing waves within the skull cavity [31-32] or in regions with a lower cavitation threshold, such as tissue-ventricle interfaces [68]. It is anticipated that large FOV acoustic imaging will be particularly critical for ensuring treatment safety during bubble-mediated therapies that harness violent inertial cavitation activity, such as sonothrombolysis [69], mechanical ablation [41,70-71], and histotripsy [72]. Future work should thus investigate methods for accelerating image formation, as well as the application of this general treatment guidance approach in the context of other cavitation-mediated treatments both in the brain and in other parts of the body [73-74].
Further retrospective analysis of the acoustic emissions data demonstrated that the imaging system's in-vivo subharmonic detection sensitivity is highly dependent on both the number and spatial configuration of sensors employed for image formation. In general, the image quality obtained was improved by using arrays with higher element counts (Figure 7A and Figure S5), which is consistent with our previous in-silico findings [61]. The large variability observed in array performance for a fixed level of sparsity (Figure 7B) illustrates the importance of sensor configuration on the resulting imaging quality obtained, and underscores the benefits obtained from simulation-optimized element layouts in designing sparse receiver arrays [61].
A limitation of this work is that following the initial calibration sonication, volumetric exposures were carried out at a fixed pressure level and the treatments effectively became open-loop. Any changes experienced by the microbubbles over the course of the volumetric exposures (e.g., growth or shrinkage from being in the vasculature) were thus not accounted for with this approach. Regardless, no subharmonic microbubble activity was detected during any of the volumetric exposures carried out at the 50% target level, and therefore no acoustic signatures were available for treatment feedback. It is possible that the short capture lengths employed here (3.2/10 ms during calibration sonications, 0.75/10 ms during volumetric exposures) limited our ability to detect subharmonic activity, either due to insufficient SNR or microbubble disruption within the transmit focal volume during the beginning portion of the pulses. Nevertheless, the detection of other spectral frequency bands, such as harmonics of the driving frequency (i.e., (n+1)f0, n = 1,2,3…) [25,36,39], may provide additional information that can be used for treatment guidance during BBB opening exposures carried out below the threshold for detecting subharmonic microbubble activity. Bandpass filtering of our channel data about the second harmonic frequency (i.e., 2f0 = 1224 kHz) prior to beamforming did not produce spatially-coherent acoustic activity during any of the exposures carried out at the 50% target level. However, in this study the channel data were captured using the transducer elements tuned to the subharmonic frequency (i.e., f0/2 = 306 kHz), which have reduced levels of sensitivity at the second harmonic. In future experiments we plan to use the high frequency elements present within the transducer modules of the current array to assess the feasibility of 3D second harmonic imaging during exposures carried out at pressure levels for which subharmonic activity is not detectable. However, it is worth noting that such higher frequency content is more susceptible to transcranial distortions that may need to be accounted for. Closed-loop exposure control based on these emission signatures [39,75] could also be incorporated within an acoustic imaging-based framework in the future.
Finally, although a phased array transducer was employed in this work, element-specific transcranial aberration correction was not performed to simplify the experiments. Our ability to generate focal regions of increased BBB permeability in vivo suggests that any beam defocusing caused by the relatively thin rabbit skulls (thickness ≈ 1.5-2.0 mm) was minimal at the transmit frequency employed in this work (f0 = 612 kHz). Nonetheless, in a clinical setting there will be a greater need to compensate for skull-induced aberrations, both on transmit and on receive, due to the increased thickness of human cranial bone relative to the acoustic wavelength(s) of interest. On transmit, skull-induced distortions lead to a defocusing of the therapy beam that complicates the prediction of in-situ pressure field distributions, altering the location and magnitude of the peak negative acoustic pressure, as well as the shape of the focal zone [29]. Similarly, on receive, skull-induced aberrations lead to a degradation in image quality if not properly compensated for [54,61,76]. However, the need for element-specific trans-skull aberration corrections is diminished at low acoustic frequencies, both on transmit [77] and receive [61]. It may therefore be possible to map subharmonic microbubble activity in vivo through human skullcaps at the frequency employed in this work (f0/2 = 306 kHz) without incorporating aberration correction into the reconstruction process, though such an approach would only be permissible in scenarios where precise spatial cavitation localization and high detection sensitivity are not essential. For instance, the treatment margins during large volume BBB opening [64] are more forgiving than those for inertial cavitation-mediated surgical applications of ultrasonic brain therapy (e.g., sonothrombolysis [69], mechanical ablation [41,70-71], histotripsy [72]), for which aberration corrections may be critical to ensure precise targeting. Nevertheless, experiments in a large animal model with ex-vivo human skullcaps (e.g., see Huang et al. [15]) and appropriate aberration correction techniques [61,78] are required prior to initial clinical testing with this device.
Abbreviations
A: anterior; BBB: bood-brain barrier; CPU: central processing unit; CE-T1w: contrast-enhanced T1-weighted; FOV: field-of-view; FUS: focused ultrasound; pfree-field: free-field pressure; GPGPU: general-purpose graphics processing unit; H&E: hematoxylin-eosin; I: inferior; pin-situ: in-situ pressure; PZT-4: lead zirconate titanate; L: left; MR: magnetic resonance; MRI: magnetic resonance imaging; MIP: maximum intensity projection; 1D: one-dimensional; P: posterior; p: pressure; Δp: pressure step size; PRF: pulse repetition frequency; RBC: red blood cell; R: right; SPTA: spatial-peak temporal-average; SPTP: spatial-peak temporal-peak; SD: standard deviation; pstart: starting pressure; psub: subharmonic pressure threshold; SRI: Sunnybrook Research Institute; S: superior; t: temporal coordinate; 3D: three-dimensional; f0: transmit frequency; 2D: two-dimensional; T1w: T1-weighted; T2w: T2-weighted; T2*w: T2*-weighted; λ: wavelength.
Supplementary Material
Supplementary figures and tables.
Acknowledgements
Support for this work was provided by a grant from the National Institute of Biomedical Imaging and Bioengineering of the National Institutes of Health (R01 EB003268), an operating grant from the Canadian Institutes of Health Research (MOP 119312), the W. Garfield Weston Foundation, and the Canada Research Chairs program. The authors would like to thank S. Rideout-Gros, V. Chan, A. Garces, L. Ngheim, and J. Barry for their help with the animal care, J. Sun for performing the histological processing, T. Portelli, S. Gunaseelan, E. Ye, A. Chau, M. Kazem, R. Reyes, Y. Huang, P. Buragohain, S. Yang, and H. Lin for providing technical assistance, as well as D. Goertz and S. Graham for providing feedback on an early version of the manuscript.
Competing interests
KH, MAO, RMJ, and LD are inventors on issued patents and pending patent applications related to the methods used in this study.
References
1. Pardridge WM. The blood-brain barrier: bottleneck in brain drug development. NeuroRx. 2005;2:3-14
2. Hynynen K, McDannold N, Vykhodtseva N, Jolesz FA. Noninvasive MR imaging-guided focal opening of the blood-brain barrier in rabbits. Radiology. 2001;220:640-646
3. Underwood E. Can sound open the brain for therapies? Science. 2015;347:1186-1187
4. Konofagou EE, Tung YS, Choi J, Deffieux T, Baseri B, Vlachos F. Ultrasound induced blood-brain barrier opening. Curr Pharm Biotechnol. 2012;13:1332-1345
5. O'Reilly MA, Hynynen K. Ultrasound enhanced drug delivery to the brain and central nervous system. Int J Hyperthermia. 2012;28:386-396
6. Aryal M, Arvanitis CD, Alexander PM, McDannold N. Ultrasound-mediated blood-brain barrier disruption for targeted drug delivery in the central nervous system. Adv Drug Deliv Rev. 2014;72:94-109
7. Liu HL, Hua MY, Chen PY, Chu PC, Pan CH, Yang HW. et al. Blood-brain barrier disruption with focused ultrasound enhances delivery of chemotherapeutic drugs for glioblastoma treatment. Radiology. 2010;255:415-425
8. Treat LH, McDannold N, Zhang Y, Vykhodtseva N, Hynynen K. Improved antitumor effect of liposomal doxorubicin after targeted blood-brain barrier disruption by MRI-guided focused ultrasound in rat glioma. Ultrasound Med Biol. 2012;38:1716-1725
9. Aryal M, Vykhodtseva N, Zhang YZ, Park J, McDannold N. Multiple treatments with liposomal doxorubicin and ultrasound-induced disruption of blood-tumor and blood-brain barriers improve outcomes in a rat glioma model. J Control Release. 2013;169:103-111
10. Jordão JF, Ayala-Grosso CA, Markham K, Huang Y, Chopra R, McLaurin J. et al. Antibodies targeted to the brain with image-guided focused ultrasound reduces amyloid-beta plaque load in the TgCRND8 mouse model of Alzheimer's disease. PLoS ONE. 2010;5:e10549
11. Burgess A, Dubey S, Yeung S, Hough O, Eterman N, Aubert I. et al. Alzheimer disease in a mouse model: MR imaging-guided focused ultrasound targeted to the hippocampus opens the blood-brain barrier and improves pathologic abnormalities and behavior. Radiology. 2014;273:736-745
12. Leinenga G, Götz J. Scanning ultrasound removes amyloid-β and restores memory in an Alzheimer's disease mouse model. Sci Transl Med. 2015;7:278ra33
13. Nisbet RM, Van der Jeugd A, Leinenga G, Evans HT, Janowicz PW, Götz J. Combined effects of scanning ultrasound and a tau-specific single chain antibody in a tau transgenic mouse model. Brain. 2017;140:1220-1230
14. McDannold N, Arvanitis CD, Vykhodtseva N, Livingstone MS. Temporary disruption of the blood-brain barrier by use of ultrasound and microbubbles: safety and efficacy evaluation in rhesus macaques. Cancer Res. 2012;72:3652-3663
15. Huang Y, Alkins R, Schwartz ML, Hynynen K. Opening the blood-brain barrier with MR imaging-guided focused ultrasound: preclinical testing on a trans-human skull porcine model. Radiology. 2017;282:123-130
16. Carpentier A, Canney M, Vignot A, Reina V, Beccaria K, Horodyckid C. et al. Clinical trial of blood-brain barrier disruption by pulsed ultrasound. Sci Transl Med. 2016;8:343re2
17. McDannold N, Vykhodtseva N, Hynynen K. Effects of acoustic parameters and ultrasound contrast agent dose on focused-ultrasound induced blood-brain barrier disruption. Ultrasound Med Biol. 2008;34:930-937
18. Chopra R, Vykhodtseva N, Hynynen K. Influence of exposure time and pressure amplitude on blood-brain-barrier opening using transcranial ultrasound exposures. ACS Chem Neurosci. 2010;1:391-398
19. Choi JJ, Selert K, Gao Z, Samiotaki G, Baseri B, Konofagou EE. Noninvasive and localized blood-brain barrier disruption using focused ultrasound can be achieved at short pulse lengths and low pulse repetition frequencies. J Cereb Blood Flow Metab. 2011;31:725-737
20. McDannold N, Vykhodtseva N, Hynynen K. Use of ultrasound pulses combined with Definity for targeted blood-brain barrier disruption: a feasibility study. Ultrasound Med Biol. 2007;33:584-590
21. Choi JJ, Feshitan JA, Baseri B, Wang S, Tung YS, Borden MA. et al. Microbubble-size dependence of focused ultrasound-induced blood-brain barrier opening in mice in vivo. IEEE Trans Biomed Eng. 2010;57:145-154
22. McMahon D, Hynynen K. Acute inflammatory response following increased blood-brain barrier permeability induced by focused ultrasound is dependent on microbubble dose. Theranostics. 2017;7:3989-4000
23. McDannold N, Zhang Y, Vykhodtseva N. The effects of oxygen on ultrasound-induced blood-brain barrier disruption in mice. Ultrasound Med Biol. 2017;43:469-475
24. Hynynen K, McDannold N, Vykhodtseva N, Raymond S, Weissleder R, Jolesz FA. et al. Focal disruption of the blood-brain barrier due to 260-kHz ultrasound bursts: a method for molecular imaging and targeted drug delivery. J Neurosurg. 2006;105:445-454
25. McDannold N, Vykhodtseva N, Hynynen K. Targeted disruption of the blood-brain barrier with focused ultrasound: association with cavitation activity. Phys Med Biol. 2006;51:793-807
26. Tung YS, Vlachos F, Choi JJ, Deffieux T, Selert K, Konofagou EE. In vivo transcranial cavitation threshold detection during ultrasound-induced blood-brain barrier opening in mice. Phys Med Biol. 2010;55:6141-6155
27. Miller DL, Quddus J. Diagnostic ultrasound activation of contrast agent gas bodies induces capillary rupture in mice. Proc Natl Acad Sci USA. 2000;97:10179-10184
28. Kovacs ZI, Kim S, Jikaria N, Qureshi F, Milo B, Lewis BK. et al. Disruption of the blood-brain barrier by focused ultrasound induces sterile inflammation. Proc Natl Acad Sci USA. 2017;114:E75-E84
29. Fry FJ, Barger JE. Acoustical properties of the human skull. J Acoust Soc Am. 1978;63:1576-1590
30. Pichardo S, Sin VW, Hynynen K. Multi-frequency characterization of the speed of sound and attenuation coefficient for longitudinal transmission of freshly excised human skulls. Phys Med Biol. 2011;56:219-250
31. Baron C, Aubry JF, Tanter M, Meairs S, Fink M. Simulation of intracranial acoustic fields in clinical trials of sonothrombolysis. Ultrasound Med Biol. 2009;35:1148-1158
32. Song J, Pulkkinen A, Huang Y, Hynynen K. Investigation of standing-wave formation in a human skull for a clinical prototype of a large-aperture, transcranial MR-guided focused (MRgFUS) phased array: an experimental and simulation study. IEEE Trans Biomed Eng. 2012;59:435-444
33. Sassaroli E, Hynynen K. Resonance frequency of microbubbles in small blood vessels: a numerical study. Phys Med Biol. 2005;50:5293-5305
34. Hosseinkhah N, Goertz DE, Hynynen K. Microbubbles and blood-brain barrier opening: a numerical study on acoustic emissions and wall stress predictions. IEEE Trans Biomed Eng. 2015;62:1293-1304
35. O'Reilly MA, Hynynen K. A PVDF receiver for ultrasound monitoring of transcranial focused ultrasound therapy. IEEE Trans Biomed Eng. 2012;57:2286-2294
36. Arvanitis CD, Livingstone MS, Vykhodtseva N, McDannold N. Controlled ultrasound-induced blood-brain barrier disruption using passive acoustic emissions monitoring. PLoS ONE. 2012;7:e45783
37. O'Reilly MA, Hynynen K. Blood-brain barrier: real-time feedback-controlled focused ultrasound disruption by using an acoustic emissions-based controller. Radiology. 2012;263:96-106
38. Tsai CH, Zhang JW, Liao YY, Liu HL. Real-time monitoring of focused ultrasound blood-brain barrier opening via subharmonic acoustic emission detection: implementation of confocal dual-frequency piezoelectric transducers. Phys Med Biol. 2016;61:2926-2946
39. Sun T, Zhang Y, Power C, Alexander PM, Sutton JT, Aryal M. et al. Closed-loop control of targeted ultrasound drug delivery across the blood-brain/tumor barriers in a rat glioma model. Proc Natl Acad Sci. USA. 2017;114(E):10281-10290
40. McDannold NJ, Vykhodtseva NI, Hynynen K. Microbubble contrast agent with focused ultrasound to create brain lesions at low power levels: MR imaging and histologic study in rabbits. Radiology. 2006;241:95-106
41. Arvanitis CD, Vykhodtseva N, Jolesz F, Livingstone M, McDannold N. Cavitation-enhanced nonthermal ablation in deep brain targets: feasibility in a large animal model. J Neurosurg. 2016;124:1450-1459
42. Korpel A. Acoustic imaging and holography. IEEE Spectr. 1968;5:45-52
43. Sato T, Nakamura Y, Sasaki K, Uemura K. Three Dimensional Passive Acoustical Imaging System Using Hemispherical Array Detectors. Metherell AF, ed. Acoustical Imaging, Boston, MA, USA: Springer. 1980:187-200
44. Buckingham MJ, Berknout BV, Glegg S. Imaging the ocean with ambient noise. Nature. 1992;356:327-329
45. Farny CH, Holt RG, Roy RA. Temporal and spatial detection of HIFU-induced inertial and hot-vapor cavitation with a diagnostic ultrasound system. Ultrasound Med Biol. 2009;35:603-615
46. Salgaonkar VA, Datta S, Holland CK, Mast TD. Passive cavitation imaging with ultrasound arrays. J Acoust Soc Am. 2009;126:3071-3083
47. Gyöngy M, Coussios CC. Passive spatial mapping of inertial cavitation during HIFU exposure. IEEE Trans Biomed Eng. 2010;57:48-56
48. Gateau J, Aubry JF, Pernot M, Fink M, Tanter M. Combined passive detection and ultrafast active imaging of cavitation events induced by short pulses of high-intensity ultrasound. IEEE Trans Ultrason, Ferroelect, Freq Control. 2011;58:517-532
49. Vignon F, Shi WT, Powers JE, Everbach EC, Liu J, Gao S. et al. Microbubble cavitation imaging. IEEE Trans Ultrason, Ferroelect, Freq Control. 2013;60:661-670
50. Choi JJ, Carlisle RC, Coviello C, Seymour L, Coussios CC. Non-invasive and real-time passive acoustic mapping of ultrasound-mediated drug delivery. Phys Med Biol. 2014;59:4861-4877
51. Arvanitis CD, Livingstone MS, McDannold N. Combined ultrasound and MR imaging to guide focused ultrasound therapies in the brain. Phys Med Biol. 2013;58:4749-4761
52. Arvanitis CD, Clement GT, McDannold N. Transcranial assessment and visualization of acoustic cavitation: modeling and experimental validation. IEEE Trans Med Imag. 2015;34:1270-1281
53. O'Reilly MA, Jones RM, Hynynen K. Three-dimensional transcranial ultrasound imaging of microbubble clouds using a sparse hemispherical array. IEEE Trans Biomed Eng. 2014;61:1285-1294
54. Jones RM, O'Reilly MA, Hynynen K. Experimental demonstration of passive acoustic imaging in the human skull cavity using CT-based aberration corrections. Med Phys. 2015;42:4385-4400
55. Deng L, O'Reilly MA, Jones RM, An R, Hynynen K. A multi-frequency sparse hemispherical ultrasound phased array for microbubble-mediated transcranial therapy and simultaneous cavitation mapping. Phys Med Biol. 2016;61:8476-8501
56. Hynynen K, Yin J. Lateral mode coupling to reduce the electrical impedance of small elements required for high power ultrasound therapy phased arrays. IEEE Trans Ultrason, Ferroelect, Freq Control. 2009;56:557-564
57. O'Reilly MA, Hough O, Hynynen K. Blood-brain barrier closure time after controlled ultrasound-induced opening is independent of opening volume. J Ultrasound Med. 2017;36:475-483
58. Duck FA. Physical Properties of Tissue: A Comprehensive Reference Book. San Diego, CA, USA: Academic Press. 1990:73-135
59. Bilaniuk N, Wong GS. Speed of sound in pure water as a function of temperature. J Acoust Soc Am. 1993;93:1609-1612
60. Cheung CCP, Yu ACH, Salimi N, Yiu BYS, Tsang IKH, Kerby B. et al. Multi-channel pre-beamformed data acquisition system for research on advanced ultrasound imaging methods. IEEE Trans Ultrason, Ferroelect, Freq Control. 2012;59:243-253
61. Jones RM, O'Reilly MA, Hynynen K. Transcranial passive acoustic mapping with hemispherical sparse arrays using CT-based skull-specific aberration corrections: a simulation study. Phys Med Biol. 2013;58:4981-5005
62. McDannold N, Vykhodtseva N, Raymond S, Jolesz FA, Hynynen K. MRI-guided targeted blood-brain barrier disruption with focused ultrasound: histological findings in rabbits. Ultrasound Med Biol. 2005;31:1527-1537
63. Jordão J, Thévenot E, Markham-Coultes K, Scarcelli T, Weng YQ, Xhima K. et al. Amyloid-β plaque reduction, endogenous antibody delivery and glial activation by brain-targeted, transcranial focused ultrasound. Exp Neurol. 2013;248:16-29
64. O'Reilly MA, Jones RM, Barrett E, Schwab A, Head E, Hynynen K. Investigation of the safety of focused ultrasound-induced blood-brain barrier opening in a natural canine model of aging. Theranostics. 2017;7:3573-3584
65. Treat L, McDannold N, Vykhodtseva N, Zhang Y, Tam K, Hynynen K. Targeted delivery of doxorubicin to the rat brain at therapeutic levels using MRI-guided focused ultrasound. Int J Cancer. 2007;121:901-907
66. Kinoshita M, McDannold N, Jolesz FA, Hynynen K. Noninvasive localized delivery of Herceptin to the mouse brain by MRI-guided focused ultrasound-induced blood-brain barrier disruption. Proc Natl Acad Sci USA. 2007;103:11719-11723
67. Marty B, Larrat B, Van Langedhem M, Robic C, Robert P, Port M. et al. Dynamic study of blood-brain barrier closure after its disruption using ultrasound: a quantitative analysis. J Cereb Blood Flow Metab. 2012;32:1948-1958
68. Fry FJ, Kossoff G, Eggleton RC, Dunn F. Threshold ultrasonic dosages for structural changes in the mammalian brain. J Acoust Soc Am. 1970;48:1413-1417
69. Molina CA, Ribo M, Rubiera M, Montaner J, Santamarina E, Delgado-Mederos R. et al. Microbubble administration accelerates clot lysis during continuous 2-MHz ultrasound monitoring in stroke patients treated with intravenous tissue plasmonigen activator. Stroke. 2006;37:425-429
70. Huang Y, Vykhodtseva NI, Hynynen K. Creating brain lesions with low-intensity focused ultrasound with microbubbles: a rat study at half a megahertz. Ultrasound Med Biol. 2013;39:1420-1428
71. McDannold N, Zhang YZ, Power C, Jolesz F, Vykhodtseva N. Nonthermal ablation with microbubble-enhanced focused ultrasound close to the optic tract without affecting nerve function. J Neurosurg. 2013;119:1208-1220
72. Roberts WW, Teofilovic D, Jahnke RC, Patri J, Risdahl JM, Bertolina JA. Histotripsy of the prostate using a commercial system in a canine model. J Urol. 2014;191:860-865
73. Peng S, Xiong Y, Li K, He M, Deng Y, Chen L. et al. Clinical utility of a microbubble-enhancing contrast (SonoVue) in treatment of uterine fibroids with high intensity focused ultrasound: a retrospective study. Eur J Radiol. 2012;81:3832-3838
74. Mathias W, Tsutsui JM, Tavares BG, Xie F, Aguiar MOD, Garcia DR. et al. Diagnostic ultrasound impulses improve microvascular flow in patients with STEMI receiving intravenous microbubbles. J Am Coll Cardiol. 2016;67:2506-2515
75. McDannold N, Livingstone M, Top CB, Sutton J, Todd N, Vykhodtseva N. Preclinical evaluation of a low-frequency transcranial MRI-guided focused ultrasound system in a primate model. Phys Med Biol. 2016;61:7664-7687
76. Jones RM, Hynynen K. Comparison of analytical and numerical approaches for CT-based aberration correction in transcranial passive acoustic imaging. Phys Med Biol. 2016;61:23-36
77. Yin X, Hynynen K. A numerical study of transcranial focused ultrasound beam propagation at low frequency. Phys Med Biol. 2005;50:1821-1836
78. Clement GT, Hynynen K. A non-invasive method for focusing ultrasound through the human skull. Phys Med Biol. 2002;47:1219-1236
79. Hutchinson EB, Buchanan MT, Hynynen K. Design and optimization of an aperiodic ultrasound phased array for intracavitary prostate thermal therapies. Med Phys. 1996;23:767-776
80. Cline HE, Hynynen K, Hardy CJ, Watkins RD, Shenck JF, Jolesz FA. MR temperature mapping of focused ultrasound surgery. Magn Reson Med. 1994;31:628-636
Author contact
![]() Corresponding author: Ryan M. Jones, Sunnybrook Research Institute, 2075 Bayview Avenue, C736b, Toronto, Ontario, M4N 3M5, Canada. rmjonesutoronto.ca; +1 416 480 6100 x 6156
Corresponding author: Ryan M. Jones, Sunnybrook Research Institute, 2075 Bayview Avenue, C736b, Toronto, Ontario, M4N 3M5, Canada. rmjonesutoronto.ca; +1 416 480 6100 x 6156